[Moh’d* 3(11): November, 2016] ISSN 2349-4506
Impact Factor: 2.785
G
lobal
J
ournal of
E
ngineering
S
cience and
R
esearch
M
anagement
A NEW SIMPLE METHOD TO DERIVE SOME PORE-RELATED PROPERTIES OF
LIMESTONE FROM THE WEIGHT OF 4-CM OVEN-DRIED LIMESTONE CUBES
Basem K. Moh'd*
*
Department of Civil Engineering, Applied Science Private University ASU, Amman- Jordan, on leave
from Tafila Technical University, Tafila-Jordan
DOI: 10.5281/zenodo.186822
KEYWORDS: limestone, cubes, porosity, saturation, absorption (normal and vacuum pumped), density (dry, bulk, grain).
ABSTRACT
In a previous paper (Moh’d, 2002), the author has presented a technical note for estimating some pore-related properties of limestone from bulk density and water absorption data. The method includes measuring four parameters (W1, W2, W0 and W3) which are the weights of 4-cm cubes of limestone in different states of water absorption (oven-dried, soaked in water, vacuum-pumped and then soaked in air) to derive porosity, water saturation, water absorption (normal and vacuum pumped), and density (bulk, dry and grain). In the present work it was found that W2, W0 and W3 can be derived from W1 as revealed by 50 specimens of almost pure Jordanian limestone. This is important as in the new method there is no need for the use of a vacuum pump. This may be very useful both in the field and also in laboratories where the necessary equipment, or time, is unavailable. It is highly recommended to test more samples and to include both bituminous and non-bituminous limestones with primary and secondary porosity types (inter-granular, inter-crystalline, fracture and vuggy). Cubes with dimensions other than 4-cm and other specimen shapes such as cylinders (to simulate cores) are to be included.
INTRODUCTION
The porosity of carbonate rocks is very important with respect to their exploitation (in oil, mineral, and water exploration, as well as, in and as building and industrial materials). Microscopy (optical and electron) can provide qualitative information on the origin, distribution, and shape of pores. For a sufficiently accurate estimate of porosity, the use of other experimental techniques is required (Brown, 1981; Halley, 1978). Deriving the pore structure of carbonates using simple methods and its applications has been one important research interest of the author for the last 20 years which started during his PhD work on evaluating 12 Jordanian limestones as building stones (Moh’d, 1996; Moh’d et. al. 1996) and thereafter (Moh’d 2002; 2003; 2006a and b; 2007; 2008; 2009; 2012; 2015).
The present work is an extension of 2002 paper but emphasizes the inter-relationships between the different types of weight of cubic rock samples (W1, W2, W0 and W3). Accordingly, in order to obtain the data necessary to derive the pore-related properties, W1, W2, W0 and W3 have to be actually measured (as done in 2002 work) or derived (from W1 as emphasized) in the present work.
SAMPLES AND METHODS
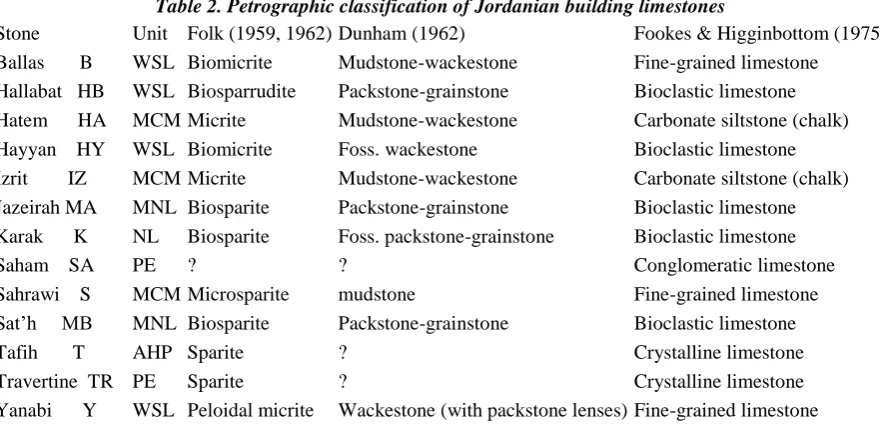
Most of the building limestones in Jordan are quarried from different horizons of the Upper Cretaceous and Tertiary. These rocks, which are dominantly of limestone lithologies, cover most of Jordan. The stratigraphy of the late Cretaceous and early Tertiary in Jordan is shown in Table 1. Units with good potential as sources of building limestone are starred. The limestones are classified petrographically in Table 2 following Folk (1959; 1962) Dunham (1962), and Fookes and Higginbottom (1975) schemes.
Table 1. Stratigraphy of Cretaceous and early Tertiary rocks of Jordan
Series Stage Formation Symbol Description
[Moh’d* 3(11): November, 2016] ISSN 2349-4506
Impact Factor: 2.785
G
lobal
J
ournal of
E
ngineering
S
cience and
R
esearch
M
anagement
Paleocene Muwaqqar* MCM Chalk, marl, limestone concretions Maestrichtian Al Hisa AHP Phosphorite, limestone, chert Late Sant./Camp. Amman ASL Chert, limestone, dolomiteConiacian Umm Ghudran WG Chalk
Turonian Wadi As Sir* WSL Limestone, dolomite Shuayb S Marl, nodular limestone Cretaceous Cenomanian Hummar H Dolomite, limestone
Fuhays F Marl, clayey
Naur * NL Limestone, nodular, dolmite Early Cretaceous Kurnub Sandstone KS
Units with good potential as sources of building stone
It is important to note that in order to determine the specific gravity and water absorption, the ASTM standard (C 97-83) requires that the test specimens be immersed in water for 48 hours. However, as most of the water absorption takes place during the first few hours of immersion (Moh'd, 1996), the 24 hours immersion period used by BRE was considered sufficient to enable water absorption, density and effective porosity to be determined.
Table 2. Petrographic classification of Jordanian building limestones
Stone Unit Folk (1959, 1962) Dunham (1962) Fookes & Higginbottom (1975) Ballas B WSL Biomicrite Mudstone-wackestone Fine-grained limestone
Hallabat HB WSL Biosparrudite Packstone-grainstone Bioclastic limestone Hatem HA MCM Micrite Mudstone-wackestone Carbonate siltstone (chalk) Hayyan HY WSL Biomicrite Foss. wackestone Bioclastic limestone Izrit IZ MCM Micrite Mudstone-wackestone Carbonate siltstone (chalk) Jazeirah MA MNL Biosparite Packstone-grainstone Bioclastic limestone Karak K NL Biosparite Foss. packstone-grainstone Bioclastic limestone Saham SA PE ? ? Conglomeratic limestone Sahrawi S MCM Microsparite mudstone Fine-grained limestone Sat’h MB MNL Biosparite Packstone-grainstone Bioclastic limestone Tafih T AHP Sparite ? Crystalline limestone Travertine TR PE Sparite ? Crystalline limestone Yanabi Y WSL Peloidal micrite Wackestone (with packstone lenses) Fine-grained limestone
PE: Post-Eocene ?: classes not known in Folk’s and/or Dunham’s classifications. Foss.: fossiliferous
The following definitions of terms are used:
Bulk density (g/cm3): the weight of the oven-dried rock divided by its total volume (including pore-space), with volume being determined by normal immersion (without the use of a vacuum pump).
Dry density (g/cm3): the weight of the oven-dried rock divided by its total volume, with volume being determined by immersion using a vacuum pump.
Grain density (g/cm3): the weight of oven-dried rock divided by its volume (excluding pore-space).
Water absorption (%): the weight of water absorbed by the rock after 24 hours of immersion in water divided by its oven-dried weight expressed as a percentage of its oven-dried weight.
Apparent porosity (%): the percentage of volume of voids over the total volume of rock.
[Moh’d* 3(11): November, 2016] ISSN 2349-4506
Impact Factor: 2.785
G
lobal
J
ournal of
E
ngineering
S
cience and
R
esearch
M
anagement
Formulae UsedThe following measurements need to be made in order to determine the different pore-related properties W0: weight of oven-dried sample,
W1: weight of sample soaked in water,
W2: weight of sample (vacuum-pumped and then soaked) in air, W3: weight of normally immersed sample in air.
Assuming that the weight of the sample soaked in water (W1) is equal to the weight of the sample normally immersed in water, then the following relationships exist:
Porosity = [(W2 - W0) / (W2 - W1)] ´ 100 (1)
Normal water absorption = [(W3 - W0) / (W0)] ´ 100 (2)
Vacuum-pumped water absorption = [(W2 - W0) / (W0)] ´ 100 (3)
Bulk density = W0 / (W3 - W1) (4)
Dry density = W0/ (W2 - W1) (5)
Grain density = W0 / (W0 - W1) (6)
Saturation = (W3 - W0)/ (W2 - W0) (7)
It is important to remember that the total volume of rock measured using a vacuum pump (Brown, 1981; RILEM, 1980; Price, 1975; Ross and Butlin, 1989) is higher than that measured by normal immersion, because air filling the pore space is removed in the former and hence water has better access to the pores. Consequently, bulk density, as prescribed in the ASTM standard (C 97-83), is higher than dry density.
RESULTS
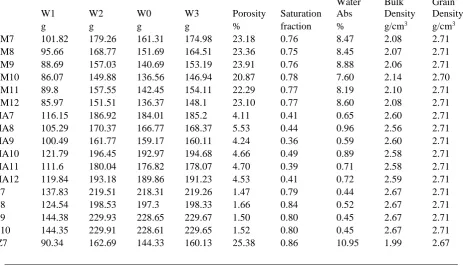
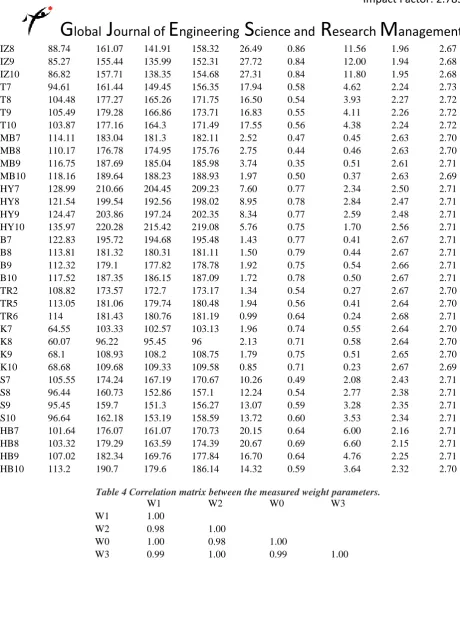
The results of the present work are shown in Table 3. A correlation matrix between the different weights (Table 4), shows very high to perfect correlation coefficients. This is further evidenced in Figures 1 through 3, with clear positive linear relationships.
Table 3 Results of the present work.
W1 W2 W0 W3 Porosity Saturation
Water Abs
Bulk Density
Grain Density g g g g % fraction % g/cm3 g/cm3
[Moh’d* 3(11): November, 2016] ISSN 2349-4506
Impact Factor: 2.785
G
lobal
J
ournal of
E
ngineering
S
cience and
R
esearch
M
anagement
IZ8 88.74 161.07 141.91 158.32 26.49 0.86 11.56 1.96 2.67 IZ9 85.27 155.44 135.99 152.31 27.72 0.84 12.00 1.94 2.68 IZ10 86.82 157.71 138.35 154.68 27.31 0.84 11.80 1.95 2.68 T7 94.61 161.44 149.45 156.35 17.94 0.58 4.62 2.24 2.73 T8 104.48 177.27 165.26 171.75 16.50 0.54 3.93 2.27 2.72 T9 105.49 179.28 166.86 173.71 16.83 0.55 4.11 2.26 2.72 T10 103.87 177.16 164.3 171.49 17.55 0.56 4.38 2.24 2.72 MB7 114.11 183.04 181.3 182.11 2.52 0.47 0.45 2.63 2.70 MB8 110.17 176.78 174.95 175.76 2.75 0.44 0.46 2.63 2.70 MB9 116.75 187.69 185.04 185.98 3.74 0.35 0.51 2.61 2.71 MB10 118.16 189.64 188.23 188.93 1.97 0.50 0.37 2.63 2.69 HY7 128.99 210.66 204.45 209.23 7.60 0.77 2.34 2.50 2.71 HY8 121.54 199.54 192.56 198.02 8.95 0.78 2.84 2.47 2.71 HY9 124.47 203.86 197.24 202.35 8.34 0.77 2.59 2.48 2.71 HY10 135.97 220.28 215.42 219.08 5.76 0.75 1.70 2.56 2.71 B7 122.83 195.72 194.68 195.48 1.43 0.77 0.41 2.67 2.71 B8 113.81 181.32 180.31 181.11 1.50 0.79 0.44 2.67 2.71 B9 112.32 179.1 177.82 178.78 1.92 0.75 0.54 2.66 2.71 B10 117.52 187.35 186.15 187.09 1.72 0.78 0.50 2.67 2.71 TR2 108.82 173.57 172.7 173.17 1.34 0.54 0.27 2.67 2.70 TR5 113.05 181.06 179.74 180.48 1.94 0.56 0.41 2.64 2.70 TR6 114 181.43 180.76 181.19 0.99 0.64 0.24 2.68 2.71 K7 64.55 103.33 102.57 103.13 1.96 0.74 0.55 2.64 2.70 K8 60.07 96.22 95.45 96 2.13 0.71 0.58 2.64 2.70 K9 68.1 108.93 108.2 108.75 1.79 0.75 0.51 2.65 2.70 K10 68.68 109.68 109.33 109.58 0.85 0.71 0.23 2.67 2.69 S7 105.55 174.24 167.19 170.67 10.26 0.49 2.08 2.43 2.71 S8 96.44 160.73 152.86 157.1 12.24 0.54 2.77 2.38 2.71 S9 95.45 159.7 151.3 156.27 13.07 0.59 3.28 2.35 2.71 S10 96.64 162.18 153.19 158.59 13.72 0.60 3.53 2.34 2.71 HB7 101.64 176.07 161.07 170.73 20.15 0.64 6.00 2.16 2.71 HB8 103.32 179.29 163.59 174.39 20.67 0.69 6.60 2.15 2.71 HB9 107.02 182.34 169.76 177.84 16.70 0.64 4.76 2.25 2.71 HB10 113.2 190.7 179.6 186.14 14.32 0.59 3.64 2.32 2.70Table 4 Correlation matrix between the measured weight parameters.
W1 W2 W0 W3
W1 1.00
W2 0.98 1.00
W0 1.00 0.98 1.00
[Moh’d* 3(11): November, 2016] ISSN 2349-4506
Impact Factor: 2.785
G
lobal
J
ournal of
E
ngineering
S
cience and
R
esearch
M
anagement
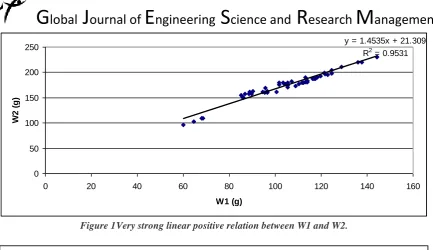
Figure 1 Very strong linear positive relation between W1 and W2.
Figure 2 Perfect positive linear relation between W1 and W0.
Recommendations
Figure 3 Very strong positive linear relation between W1 and W3.
y = 1.4535x + 21.309
R2 = 0.9531
0 50 100 150 200 250
0 20 40 60 80 100 120 140 160
W1 (g)
W
2
(
g
)
y = 1.5778x + 0.862
R2 = 0.9999
0 50 100 150 200 250
0 20 40 60 80 100 120 140 160
W1 (g)
W
0
(
g
[Moh’d* 3(11): November, 2016] ISSN 2349-4506
Impact Factor: 2.785
G
lobal
J
ournal of
E
ngineering
S
cience and
R
esearch
M
anagement
CONCLUSIONS AND RECOMENDATIOS FOR FURTHER WORK
From W1 (weight of sample soaked in water), and using the three equations in figures 1 through 3, W0, W2 and W3 can be derived. Once the weights are known they can be used in equations 1 through 7, to estimate porosity, water absorption (normal and vacuum-pumped), density (bulk, dry, grain) and water saturation. Using W0, weight of oven-dried sample, instead of W1 to derive the other weights may save testing time as drying of samples in the oven takes very short time (around one hour) compared to waiting for 24 hours to allow the samples to soak in water.
To apply this method, samples of rock has to be cut in the form of 4-cm cubes, oven dried in the oven at 105 C for one hour or until they reach constant weight, then using the equations in Figures 4 through 6 to derive W1, W2 and W3 from W0 and finally insert the results in equations 1 through 7 to derive the pore related properties (porosity, water absorption, density and water saturation).
Time saving is an advantage of the new proposed method as there is no need to wait 24 hours for soaking to occur. Moreover, vacuum pumping of samples may not be possible simply because the necessary equipment is unavailable. The new method curtails the need for vacuum pumping as the vacuum-pumped weight can be estimated from the derived equations (see figures 1 -6).
The data presented in this paper cover relatively pure limestones, which have very small amounts of clay minerals, silica, and dolomite present. The results of this work should not be generalized to apply to impure limestones and other lithologies without further study. Carrying out similar work on impure limestone lithologies (marl, marly limestones, dolomite, dolomitic limestones, and sandy limestones) and other rock types is highly recommended. A prerequisite for using immersion methods is that the tested rock should not swell appreciably or disintegrate when oven-dried and immersed in water.
ACKNOWLEDGMENTS
The author is greatly indebted to Dr Tim Yates, and Bell Ferrier, of the Building Research Establishment, for access to equipment and for technical assistance.
REFERENCES
1. American Society for Testing and Materials. 1983. Absorption and bulk specific gravity of natural building stone. ASTM Designation C 97-83
2. Brown, E. T. ( ed.) 1981. Rock characterisation, testing and monitoring, Pergamon, Oxford.
3. Dunham, R. J., 1962. Classification of carbonate rocks according to depositional texture, in W. E. Ham, ed., Classification of carbonate rocks, Mem. AAPG 1, PP.108-21.
4. Folk, R., 1959. Practical petrographic classification of limestone, AAPG Bll., 43, pp. 1-38.
5. Folk, R., 1962. Spectral subdivision of limestone types, in W. E. Ham, ed., Classification of carbonate rocks, Mem. AAPG 1, PP.62-84.
6. Fookes, P. G., and Higginbottom, I. E., 1975. The classification and description of near-shore carbonate sediments for engineering purposes, Geotechnique, 25, pp. 406-4
7. Halley, R. B. 1978. Estimating pore and cement volumes in thin section. J. Sedm. Petrol. 48: pp.642-50. 8. Moh’d, B. K. 2016 Predicting mercury-intrusion derived pore structural elements of limestone from
routinely measured petrophysical properties. EJGE 21 (17): 4709-19.
9. Moh’d, B. K. 2015 Deriving pore structure of selected Jordanian building limestones. JJEES 7 (2): 71-75.
10. Moh’d, B. K. and Cranganu, C. 2013 Amount of water absorption as controlled by carbonate unimodal and bimodal pore structure. EJGE (17): 2485-2507.
11. Moh'd, B. K. 2009 Compressive strength of vuggy oolitic limestones as a function of their porosity and sound propagation. Jordan Journal of earth and environmental Sciences (JJEES). (Vol.2)
12. Moh'd, B. K. 2008. Determination of the vuggy porosity of some oolitic building limestones and the practical implications. Jordan Journal of earth and environmental Sciences (JJEES). (Vol.1)
[Moh’d* 3(11): November, 2016] ISSN 2349-4506
Impact Factor: 2.785
G
lobal
J
ournal of
E
ngineering
S
cience and
R
esearch
M
anagement
14. Moh'd, B. K. 2006. Effect on limestone of 15 cycles of immersion in Dead Sea water, Journal of AppliedSciences 6(12): 2682-2684
15. Moh'd, B. K.2003. The salt durability of some Jordanian limestones as a function of their petrophysical properties. Electronic Journal of Geotechnical Engineering 15 pages.
16. Moh'd, B. K.2002. Estimation of some pore-related properties in limestone from bulk density and water absorption. Electronic Journal of Geotechnical Engineering, 7 pages.
17. Moh'd, B. K., Howarth, R. J., and Bland, C. H. 1996b Rapid prediction of Building Research Establishment limestone durability class from porosity and saturation. Quarterly Journal of Engineering Geology, 29: 285-297.
18. Moh'd, B. K., 1996aEvaluation of some Jordanian limestones as building stones. PhD thesis, University of London.
19. Price, C. A. 1975.Testing porous building stone. Specification technical study 1. The Architects Journal 13:p.3
20. RILEM, 1980.Recommended tests to measure the deterioration of stone and to assess the effectiveness of treatment methods. Mater. et Const. 13: pp. 175-253.