VOLUME 39, ARTICLE 14, PAGES 415
,
430
PUBLISHED 6 SEPTEMBER 2018
https://www.demographic-research.org/Volumes/Vol39/14/ DOI: 10.4054/DemRes.2018.39.14
Research Article
Interviewer effects on patterns of nonresponse:
Evaluating the impact on the reasons for
contraceptive nonuse in the Indonesia and the
Philippines DHS
Mark Amos
© 2018 Mark Amos.
This open-access work is published under the terms of the Creative Commons Attribution 3.0 Germany (CC BY 3.0 DE), which permits use, reproduction, and distribution in any medium, provided the original author(s) and source are given credit.
1 Introduction 415
2 Data 418
3 Method and model 419
4 Results 422
4.1 Indonesia 422
4.2 The Philippines 424
5 Conclusions and discussion 426
Interviewer effects on patterns of nonresponse:
Evaluating the impact on the reasons for contraceptive nonuse in the
Indonesia and the Philippines DHS
Mark Amos1
Abstract
BACKGROUND
Much social science research is reliant on generating data through questionnaires and interviews. Understanding the processes by which this data is generated is therefore vital for ensuring validity of scientific results. Interviewers, as a primary means of collecting responses, are one mode through which the generation of data can be affected.
METHODS
This paper uses the reason for contraceptive non-use module of the Indonesian DHS to examine the effect of differential effects of interviewers on response patterns. A cross-classified multilevel model is used to examine the effect of question order on the probability of providing a positive response.
RESULTS
The probability of providing a response declines across the module, an effect which is robust to the introduction of controls. We are able to partition the effect of this decline into respondent and interviewer effects by cross-classified residuals in the multilevel model. We find that although significant, the substantive effect of interviewers on the response profile is small and the majority of variation is accounted for by interviewee-level variation.
CONCLUSIONS
While data collection via interviewers seems to be a reliable mechanism within the DHS, care should be taken to minimise respondent burden to ensure valid responses. CONTRIBUTION
This submission confirms the high quality of DHS interviewing practices, while finding evidence of some systematic effects of data collection on responses.
1. Introduction
Unmet need for contraception has fallen in Indonesia within the last two decades. From a value of 17% in the 1991 DHS, the most recent DHS estimates that 11% of Indonesian women have unmet need, with increasing demand for contraception, the percentage of demand met and the percentage of demand met by a modern method all contributing to this fall (Statistics Indonesia 2012). While this decline is impressive, in order to continue to reduce the number of women at risk of unwanted pregnancy – and in particular in the Indonesian context unmet need for limiting contraception – a thorough understanding of the reasons for contraceptive nonuse is required. While this has been extensively studied in general, the usefulness of existing literature going forward is limited by the fact that reason for nonuse at a population level shifts over time (Sedgh, Ashford, and Hussain 2016). Indeed, this is the situation that has arisen in the Philippines, which has seen increases in the rate of contraceptive utilisation until stalling increases at around 55% since 1995. Further, there is a continued and somewhat intractable use of traditional contraceptives in the Philippines (Marquez, Kabamalan, and Laguna 2017) with the continuity of factors predicting traditional contraceptive use seeming to point to subpopulations of women not currently reached by modern family planning or family planning programmes.
To fully understand processes of contraceptive nonuse, or the use of less effective contraceptive methods, high-quality data is required. Data quality in general has changed internationally (De Heer 1999). While DHS data quality has largely remained of a high quality (Lyons-Amos and Stones 2017), much evaluation has concentrated on demographic data such as age (Johnson et al. 2009; Pullum 2008; Robles and Goldman 1999) or basic health information (Channon, Padmadas, and McDonald 2011; Pullum 2008) with scant attention paid to more complicated data collection modules. Indeed, analysis that evaluates more complex data collection modules tends to find some major quality concerns (Strickler et al. 1997).
can introduce systematic biases into the responses elicited (Mathews et al. 2012; Beaujouan 2013).
In addition to respondent effects, interviewers can have a major impact on the quality of data collected. Interviewers systematically affect the rate at which survey respondents are both contacted and agree to participate in surveys (Durrant and Steele 2009), with systematic differences in interviewer success according to age, sex, interviewer’s experience, pay grade, and years of experience and attitudes regarding the persuasion of reluctant respondents (Blom, De Leeuw, and Hox 2010; Durrant et al. 2010; Hox and De Leeuw 2002; Hansen 2006; Haunberger 2010). Interviewer characteristics tend to interact with those of their respondents when generating responses, with Durrant et al. (2010) finding that similarity between respondent and interviewer tends to improve survey response. Johnson et al. (2009) find this within the context of DHS data, with the sex of the interviewer and the presence of a translator having marked impact on the quality of data collected. Importantly, interviewers are subject to the same pressures as respondents, with the length of the interview assignment and the expectations of the interviewer playing a significant role in the quality of responses (Singer, Frankel, and Glassman 1983).
formulated under the assumption that there will be influences on response patterns from both respondents and interviewers: from this perspective rejection of the research hypotheses indicates higher quality collection of data, and support for these hypotheses indicates lower quality data collection:
Research Hypothesis I: Question order within the nonresponse module will affect the propensity to provide a positive response.
Research Hypothesis II: Interviewers will affect the propensity of obtaining a positive response within the nonresponse module.
Research Hypothesis III: Interviewer will affect the impact of question order on positive response differently: diligent interviewing teams will mediate the effect of question order whereas lackadaisical interviewing teams will accentuate it.
2. Data
Data for this analysis is drawn for the reason for contraceptive nonuse module from the 2012 Indonesian DHS and the 2013 Philippines DHS. DHS is a nationally representative household sample survey, which uses a cluster randomised sampling design. Primary Sampling Units (PSU) are selected based on national level data, with complete enumeration of households within the PSU to create a sampling frame to provide a list for secondary sampling. Within selected households all eligible women are interviewed.
The 2012 Indonesia DHS employed 119 interviewing teams to collect the data. Each team was comprised of eight interviewers: one male supervisor, one female field editor, four female interviewers, and two male interviewers, one for currently married men and one for never-married men. In Papua and West Papua, each team consisted of five interviewers: one male supervisor, one female field editor, two female interviewers, and one male interviewer for married men and never-married men. The 2013 Philippines DHS was conducted by 70 interviewing teams. Each team comprised a supervisor, field editor, and four female interviewers.
the responses of individuals due to contextual effects such as the presence of a family planning clinic in the local area (which could inhibit access to contraception) as well as other local geographic effects, such as contraceptive networks (Lyons-Amos, Durrant, and Padmadas 2011; Behrman, Kohler, and Watkins 2002). The cross-classified design removes potential confounding of this nature and allows estimation of the relative size of the effect of interviewer, geographic and individual effects on the data generated.
Within the Indonesia DHS questionnaire, the module for contraceptive nonuse is relatively vulnerable to respondent and interviewer burden. The reasons for nonuse questions come in a list format, which requires the respondent to affirm whether any of twenty potential reasons for nonuse are relevant. Moreover, this comes at the end of the contraceptive use section of the DHS, which uses similar question structures and as such the respondent will be familiar with the list format. Respondent and interviewer fatigue then can potentially manifest in the form of a string of negative responses to questions proffered to speed the process of completing the module, or in item nonresponse (Groves et al. 2002).
The analytic sample for this paper comprises all women with reported unmet need who were not using a contraceptive at the time of survey. Only women with unmet need are considered for this analysis since by definition they will not be using a contraceptive, which allows identification of missing responses due to item nonresponse as opposed to nonresponse due to skip patterns within the questionnaire. The analytic sample for Indonesia comprises 2,956 women. Women within the selected sample are nested within both 1188 Primary Sampling Units (PSU) and 26 interviewing teams, although, as noted already, each PSU will be served by more than one interviewing team, and each interviewing team is active in more than one primary sampling unit. This leads to a cross-classified nesting structure with an average of 37.4 observations within each PSU and 1709.1 observations per interviewing team. For the Philippines the analytic sample is 1,871 women nested in 669 PSU (50.2 observations per PSU) and 55 interviewing teams (610.2 women per interviewing team).
3. Method and model
The basic model for this analysis is a logistic regression where the probability of a positive response is denoted as a logit function of the question order within the reasons for nonresponse module. This model is presented in equation (1):
In equation (4), the response variable takes the form of an indicator variable, which takes the value 1 if the respondent proffers a positive response to the reasons for contraceptive nonuse and zero if not. The effect of question order is captured by the coefficient which is a linear fixed effect. This operationalises the concept of declining data quality: respondent or interviewer fatigue can introduce a declining probability of responding positively to the reason for nonuse, which would introduce a significant and negative effect of question order.
The variation attributable to interviewer effects is captured by the addition of a random effect indexed by the interviewing team j, which allows for variation in the probability of a positive response according to interview team and is presented in equation (2).
logit ( ) = + + ( ) , . (2)
This paper makes use of cross-classified multilevel models to separate interviewer effects from the effect of local geography on response patterns, mirroring the approach of Durrant and Steele (2009), O’Muircheartaigh and Campanelli (1998), Durrant et al. (2010), and Vassallo, Durrant, and Smith (2017). The cross classified multilevel model can be written in the form of equation (3) using the notation of Browne, Goldstein, and Rasbash (2001).
logit ( ) = + + ( ) , + ( ) ,
and
( ) ~ 0,
( ) , ( )~ (0, ( )). (3)
logit( ( )) = + + + ( ) ,
+ ( ), (4)
and
( ) ~ 0,
( ) , ( ) ~ 0, ( ) .
This model can be extended in the form of equation (5) to account for variation in the effect of question order by interviewing team.
( ) = + + ( ) ,
+ ( ), + ( ) ,
and
( )
( ) ~ (0, Ω ) with Ω ~ ( )
( ), ( ) ( ) and
( ) ~ (0,
( )). (5)
This model is defined similarly to equation (4), save for the addition of the random coefficient ( ) which allows the effect of the question order to vary depending on the interviewing team. The distribution of the interviewer random effects is now multivariate normal according to the variance-covariance matrixΩ , with the random intercept captured by the variance ( ) and the random slope by ( ) which have covariance ( ), ( ).
The modelling strategy builds successive models to test the research aims and research hypotheses. The modelling procedure is conducted for each data set under analysis: results are presented for Indonesia and the Philippines in turn. Model I is a simple logit model which simply tests whether the effect of question order on the probability of a positive response is statistically significant. This allows us to test the validity of research hypothesis I.
controls. Model II therefore comprises a random intercept model with the random part reflecting variation at the interviewer level. Model III extends this by introducing a cross-classification with random intercepts for both interviewer and primary sampling unit, which should remove any confounding between area level characteristics and interviewer characteristics (Vassallo, Durrant, and Smith 2017). This model allows us to test research hypothesis II.
Model IV introduces fixed part controls for age, education, marital status, and wealth. This establishes whether both the effects of question order, and the clustering by both PSU and interview team are robust to woman-level determinants of contraceptive nonuse. Finally, Model V introduces a random slope for question order by interviewing team. This allows us to test research hypothesis III by allowing the effect of question order to depend on the interviewing team collecting data.
Model I is estimated using regression function in Stata 13.0 for Windows. All multilevel modelling is conducted in MLwiN 2.36 for Windows (Charlton et al. 2017) via the runmlwin function in Stata (Leckie and Charlton 2013). For model II to model IV, models are estimated via MCMC using 10000 samples with a 2000 sample burn in with initial values taken from models estimated using second order penalised quasi-likelihood. This follows the recommendation of Browne (2017) which advises the re-estimation of binary response models using MCMC since iterative (such as IGLS or RIGLS) estimation is likely to create downward bias variance estimates. Model V was also estimated using MCMC with 10000 samples and a 2000 sample burn in, but initial values were taken from a bespoke input matrix since second-order PQL gave nonpositive definite starting values.
4. Results
4.1 Indonesia
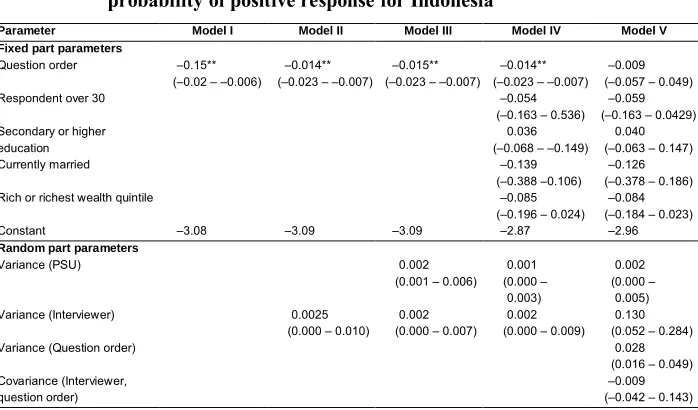
Table 1: Estimated models from multilevel cross-classified regression for probability of positive response for Indonesia
Parameter Model I Model II Model III Model IV Model V Fixed part parameters
Question order –0.15** (–0.02 – –0.006)
–0.014** (–0.023 – –0.007)
–0.015** (–0.023 – –0.007)
–0.014** (–0.023 – –0.007)
–0.009 (–0.057 – 0.049)
Respondent over 30 –0.054
(–0.163 – 0.536) –0.059 (–0.163 – 0.0429) Secondary or higher
education
0.036 (–0.068 – –0.149)
0.040 (–0.063 – 0.147)
Currently married –0.139
(–0.388 –0.106) –0.126 (–0.378 – 0.186)
Rich or richest wealth quintile –0.085
(–0.196 – 0.024) –0.084 (–0.184 – 0.023)
Constant –3.08 –3.09 –3.09 –2.87 –2.96
Random part parameters
Variance (PSU) 0.002
(0.001 – 0.006) 0.001 (0.000 – 0.003) 0.002 (0.000 – 0.005) Variance (Interviewer) 0.0025
(0.000 – 0.010) 0.002 (0.000 – 0.007)
0.002 (0.000 – 0.009)
0.130 (0.052 – 0.284)
Variance (Question order) 0.028
(0.016 – 0.049) Covariance (Interviewer,
question order)
–0.009 (–0.042 – 0.143)
Notes: Model II–V based on 10000 MCMC sample with 2000 sample burning. Starting values from 2nd order penalised
quasi-likelihood estimates for models II–IV, and from bespoke input matrix for model V. Figure in (parentheses) indicate 95% credible intervals.
** denotes p<0.01, * denotes p<0.05, based on overlap of credible intervals of null value.
Model I finds a significant effect of question order on the probability of providing a positive response to a reason for nonuse (p<0.01). This effect is negative, indicating the probability of providing a positive response declines with increasing order. This is consistent with research hypothesis I: there is an effect of question order on the responses and the data generated.
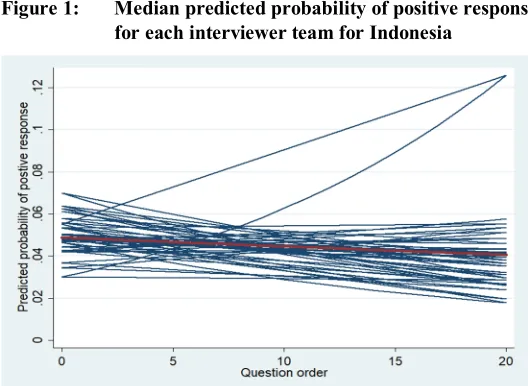
Model V includes a random slope to account for differential effects of interviewers on the effect of question order. This random coefficient, again, is significant but relatively small in magnitude. This is reflected in the predicted probabilities of a positive response presented in Figure 1. Each blue line denotes the slope for one interviewer team, with the population average presented in red. Overall, there is little deviation from the population line, with most interview teams clustering around the overall downward trend. There are only two major outliers, both of whom show relatively rapid increases in the probability of positive responses with increasing question order.
Figure 1: Median predicted probability of positive response by question order for each interviewer team for Indonesia
4.2 The Philippines
retains a significant effect of question order on the probability of a positive response even after the introduction of other fixed effects.
Table 2: Estimated models from multilevel cross-classified regression for probability of positive response for the Philippines
Parameter Model I Model II Model III Model IV Model V Fixed part parameters
Question order –0.059** (–0.067 – 0.052)
–0.059** (–0.067 – –0.052)
–0.059** (–0.067 – –0.051)
–0.059** (–0.067 – –0.052)
–0.077** (–0.109 – –0.046)
Respondent over 30 0.062
(–0.040 – 0.169) 0.071 (–0.041 – 0.177)
Secondary or higher education –0.084
(–0.193 – 0.028) –0.091 (–0.202 – 0.010)
Currently married –0.010
(–0.117 – 0.094) –0.018 (–0.121 – 0.086)
Rich or richest wealth quintile –0.027
(–0.125 – 0.072) –0.035 (–0.138 – 0.060)
Constant –2.17 –2.17 –2.17 –2.13 –2.10
Random part parameters
Variance (PSU) 0.002
(0.001– 0.003) 0.001 (0.000 – 0.004)
0.001 (0.000 – 0.003) Variance (Interviewer) 0.001
(0.000 – 0.004) 0.001 (0.000 – 0.005)
0.001 (0.000 – 0.005)
0.108 (0.055 – 0.190)
Variance (Question order) 0.015
(0.010 – 0.023) Covariance (Interviewer,
question order)
–0.011 (–0.027 – 0.001)
Notes: Model II–V based on 10000 MCMC sample with 2000 sample burning. Starting values from 2nd order penalised
quasi-likelihood estimates for models II–IV, and from bespoke input matrix for model V. Figure in (parentheses) indicate 95% credible intervals.
** denotes p<0.01, * denotes p<0.05, based on overlap of credible intervals of null value.
Figure 2: Median predicted probability of positive response by question order for each interviewer team for the Philippines
5. Conclusions and discussion
This paper evaluates the effect of interviewers on the responses obtained from the reasons for contraceptive nonuse module of the most recent Indonesia DHS (2012) and the Philippines DHS (2013). Three major research hypotheses were tested, first, that the probability of obtaining a positive response declines with question order, due either to respondent burden or interviewer induced question skipping. Second, the extent to which interviewers compared to respondents influence the pattern of positive responses. Thirdly, we tested whether there was a significant effect of interviewers on the effect of question order.
quality of data available from DHS surveys. That said, the Filipino data produced estimates of outlying teams of interviewers associated with more rapid drops in the probability of a positive response. Whilst this is a relatively small fraction of the interviewing staff, care should be taken to ensure comparable quality across interviewing teams and validation of data quality post hoc. In particular efforts should be made to identify.
References
Beaujouan, É. (2013). Counting how many children people want: The influence of question filters and pre-codes.Demográfia English Edition 56(5): 35–61. Behrman, J.R., Kohler, H.P., and Watkins, S.C. (2002). Social networks and changes in
contraceptive use over time: Evidence from a longitudinal study in rural Kenya. Demography 39(4): 713–738.doi:10.1353/dem.2002.0033.
Blom, A.G., De Leeuw, E.D., and Hox, J.J. (2010). Interviewer effects on nonresponse in the European social survey. Colchester: University of Essex, Institute for Social and Economic Research (Working paper 2010‒25).
Browne, W.J. (2017). MCMC estimation in MLwiN v3.00 [electronic resource]. Bristol: Centre for Multilevel Modelling, University of Bristol.
Browne, W.J., Goldstein, H., and Rasbash, J. (2001). Multiple Membership Multiple Classification (MMMC) models. Statistical Modelling 1(2): 103–124.
doi:10.1177/1471082X0100100202.
Charlton, C., Rasbash, J., Browne, W.J., Healy, M., and Cameron, B. (2017). MLwiN v3.00 [electronic resource]. Bristol: Centre for Multilevel Modelling, University of Bristol.
Campanelli, P. and O’Muircheartaigh, C. (1999). Interviewers, interviewer continuity, and panel survey nonresponse.Quality and Quantity 33(1): 59–76.doi:10.1023/ A:1004357711258.
Channon, A.R., Padmadas, S.S., and McDonald, J.W. (2011). Measuring birth weight in developing countries: Does the method of reporting in retrospective surveys matter? Maternal and Child Health Journal 15(1): 12–18. doi:10.1007/s10995-009-0553-3.
De Heer, W. (1999). International response trends: Results of an international survey.
Journal of Official Statistics 15(2): 129–142.
Durrant, G.B., and Steele, F. (2009). Multilevel modelling of refusal and non-contact in household surveys: Evidence from six UK government surveys. Journal of the
Royal Statistical Society: Series A (Statistics in Society) 172(2): 361–381.
doi:10.1111/j.1467-985X.2008.00565.x.
Durrant, G.B., Groves, R.M., Staetsky, D., and Steele, F. (2010). Effects of interviewer attitudes and behaviors on refusal in household surveys. Public Opinion Quarterly 74(1): 1–36.doi:10.1093/poq/nfp098.
Groves, R.M., Dillman, D.A., Eltinge, J.L., and Little, R.J.A. (eds.) (2002). Survey
Hansen, K.M. (2006). The effects of incentives, interview length, and interviewer characteristics on response rates in a CATI study. International Journal of Public Opinion Research 19(1): 112–121.doi:10.1093/ijpor/edl022.
Haunberger, S. (2010). The effects of interviewer, respondent, and area characteristics on cooperation in panel surveys: A multilevel approach. Quality and Quantity
44(5): 957–969.doi:10.1007/s11135-009-9248-5.
Hox, J. and De Leeuw, E.D. (2002). The influence of interviewers attitude and behavior on household survey nonresponse: An international comparison. In: Groves, R.M., Dillman, D.A., Eltinge, J.L., and Little, R.J.A. (eds.). Survey
Nonresponse. New York: Wiley: 103–119.
Johnson, K., Grant, M., Khan, S., Moore, Z., Armstrong, A., and Sa, Z. (2009). Fieldwork-related factors and data quality in the demographic and health surveys program. Calverton: ICF Macro, Measure DHS (DHS Analytical Studies No. 19).
Leckie, G. and Charlton, C. (2013). Runmlwin: A program to run the MLwiN multilevel modelling software from within Stata.Journal of Statistical Software 52(11): 1–40.
Lyons-Amos, M.J., Durrant, G.B., and Padmadas, S.S. (2011). Is traditional contraceptive use in Moldova associated with poverty and isolation?Journal of Biosocial Science 43(3): 305–327.doi:10.1017/S0021932010000775.
Lyons-Amos, M.J. and Stones, T. (2017). Trends in demographic and health survey data quality: An analysis of age heaping over time in 34 countries in sub-Saharan Africa between 1987 and 2015. BMC Research Notes 10(1): 760. doi:10.1186/s13104-017-3091-x.
Marquez, M.P.N., Kabamalan, M., and Laguna, E. (2017). Ten years of traditional contraceptive method use in the Philippines: Continuity and change. Rockville: ICF (DHS Working Papers No. 130).
Mathews, P., Sear, R., Coast, E., and Iacovou, M. (2012). Do preceding questions influence the reporting of childbearing intentions in social surveys? Paper presented at Population Association of America Annual Meeting, San Francisco, May 3–5, 2012.
Morgan, S.P. and Hagewen, K.J. (2005). Fertility. In: Poston, D.L. and Micklin, M. (eds.). Handbook of population. New York: Kluwer Academic/Plenum: 229– 249.doi:10.1007/0-387-23106-4_9.
Statistical Society: Series A (Statistics in Society) 161(1): 63–77. doi:10.1111/1467-985X.00090.
Pullum, T.W. (2006). An assessment of age and date reporting in the DHS surveys, 1985–2003. Calverton: Macro International Inc. (Methodological Reports 5). Pullum, T.W. (2008). An assessment of the quality of data on health and nutrition in the
DHS surveys, 1993–2003. Calverton: Macro International Inc. (Methodological Reports 6).
Robles, A. and Goldman, N. (1999). Can accurate data on birth weight be obtained from health interview surveys? International Journal of Epidemiology 28(5): 925–931.doi:10.1093/ije/28.5.925.
Schnell, R. and Kreuter, F. (2005). Separating interviewer and sampling-point effects. Journal of Official Statistics 21(3): 389–410.
Sedgh, G., Ashford, L.S., and Hussain, R. (2016). Unmet need for contraception in developing countries: Examining women’s reasons for not using a method [electronic resource]. New York: Guttmacher Institute. http://repositorio.gire. org.mx/handle/123456789/2049.
Singer, E., Frankel, M.R., and Glassman, M.B. (1983). The effect of interviewer characteristics and expectations on response. Public Opinion Quarterly 47(1): 68–83.doi:10.1086/268767.
Statistics Indonesia (Badan Pusat Statistik BPS), National Population and Family Planning Board (BKKBN), Kementerian Kesehatan (Kemenkes MOH), and ICF International (2013). Indonesia Demographic and Health Survey 2012. Jakarta: BPS, BKKBN, Kemenkes, and ICF International.
Strickler, J.A., Magnani, R.J., McCann, H.G., Brown, L.F., and Rice, J.C. (1997). The reliability of reporting of contraceptive behavior in DHS calendar data: Evidence from Morocco.Studies in Family Planning 28(1): 44–53.doi:10.2307/2137970. Teclaw, R., Price, M.C., and Osatuke, K. (2012). Demographic question placement:
Effect on item response rates and means of a veterans health administration survey. Journal of Business and Psychology 27(3): 281–290. doi:10.1007/ s10869-011-9249-y.