VOLUME 39, ARTICLE 7, PAGES 209
,
250
PUBLISHED 31 JULY 2018
http://www.demographic-research.org/Volumes/Vol39/7/ DOI: 10.4054/DemRes.2018.39.7
Research Article
Disability crossover: Is there a Hispanic
immigrant health advantage that reverses
from working to old age?
Mara Getz Sheftel
Frank W. Heiland
© 2018 Mara Getz Sheftel & Frank W. Heiland.
This open-access work is published under the terms of the Creative Commons Attribution 3.0 Germany (CC BY 3.0 DE), which permits use, reproduction, and distribution in any medium, provided the original author(s) and source are given credit.
1 Introduction 210
2 Data, measures, and methods 212
3 Results 214
3.1 Sample descriptive statistics 214
3.2 Mexican-born vs. US-born 215
3.3 Mexican-born vs. other foreign-born Hispanics 219
3.4 Mexican-born by age at migration 221
3.5 Mexican-born by education level 223
3.6 Specific disabilities 225
3.6.1 Ambulatory disability 225
3.6.2 Cognitive disability 227
3.6.3 Difficulty with independent living 228
3.6.4 Difficulty with self-care 230
3.6.5 Visual disability 231
3.6.6 Auditory disability 233
4 Discussion and conclusion 234
5 Acknowledgments 238
References 239
Disability crossover:
Is there a Hispanic immigrant health advantage that reverses
from working to old age?
Mara Getz Sheftel1
Frank W. Heiland2
Abstract
BACKGROUND
Hispanic immigrants have been found to be more likely to have a disability than US-born populations. Studies have primarily focused on populations aged 60 and older; little is known about immigrant disability at younger ages.
OBJECTIVE
Taking a broader perspective, we investigate whether Hispanic immigrants have lower disability rates in midlife; if so, at what ages this health advantage reverses; and the correlates of this pattern.
METHODS
Using American Community Survey 2010–2014 data, we estimate age-specific disability prevalence rates by gender, nativity, education, and migration age from age 40 to 80. We also present estimates by six types of disability.
RESULTS
Compared to non-Hispanic whites, disability prevalence among foreign-born Mexican women is lower until age 53 (men: 61) and greater after 59 (66). Similar patterns hold for other foreign-born Hispanics. Crossovers are observed in rates of ambulatory,
cognitive, independent living, and self-care disability. Evidence of a steeper age–
disability gradient among less-educated immigrants is found. Minimal differences are noted by migration age, challenging an acculturation explanation for the crossover.
CONTRIBUTION
The paper contributes to a better understanding of immigrant–native disability patterns
in the United States. It is the first to systematically document a Hispanic immigrant
health advantage in disability that reverses from working to old age. Hispanic immigrants (particularly foreign-born Mexican women), may face steeper risk trajectories, consistent with their greater concentration in low-skill manual occupations. We call for increased scholarly attention to this phenomenon.
1. Introduction
The Hispanic population in the United States continues to grow rapidly, and its share in the population over age 65 is expected to more than double between 2012 and 2050, from just over 7% to over 18% (15.4 million people). Hispanics tend to be disadvantaged socioeconomically relative to non-Hispanic whites (based on income, education, employment, and occupational status) and have lower rates of health insurance coverage. They are also overrepresented among the undocumented immigrant population (Hummer and Hayward 2015). Rapid growth and aging of this particularly vulnerable population will impact future health patterns in the United States. Hence, understanding how this population fares in terms of health outcomes is important to researchers and policy makers.
‘Hispanic paradox’ (Abraido-Lanza et al. 1999; Franzini, Ribble, and Keddie 2001; Markides and Eschbach 2005; Palloni and Arias 2004).
Recent literature on immigrant health has broadened the scope to include disability. The emerging evidence suggests that the Hispanic immigrant health advantage in mortality may not extend to disability: Several studies – using various disability measures and data sources – report that Hispanic immigrants, and particularly Mexicans, have higher disability rates than non-Hispanic whites at age 60 and older (Angel, Angel, and Hill 2014; Eschbach et al. 2007; Garcia et al. 2015; Hummer, Benjamins, and Rogers 2004; Markides et al. 2007; Nam, Al-Snih, and Markides 2015). Relatively little is known about disability among Hispanic immigrants younger than 60. Warner and Brown (2011) estimate longitudinal models of functional limitations using Health and Retirement Study (HRS) data and show that Mexican Americans experience limitations at higher rates from age 53 to 75 than non-Hispanic whites. They adjust for nativity but do not look specifically at foreign-born Mexicans. Hayward et al. (2014) show that foreign-born Hispanic men in the HRS have comparable disability rates to non-Hispanic whites at ages 50–54, but rates increase more rapidly among foreign-born Hispanic men at older ages. Foreign-born Hispanic women already have higher disability rates than white women at ages 50–54, and this differential widens with age. Also using HRS data, Crimmins, Hayward, and Seeman (2004) find that foreign-born Hispanics between ages 51 and 61 are more likely to have a disability than non-Hispanic whites. Using National Health Interview Study (NHIS) data, Melvin et al. (2014) find that at midlife (ages 50–64) both male and female foreign-born Hispanics (with the exception of Puerto Ricans) have equal or lower proportions of functional limitations as compared to non-Hispanic whites, but the proportions reverse by age 65 for both men and women on all measures of disability. Using American Community Survey (ACS) data, Sheftel (2017) estimates that 18–64-year-old foreign-born Mexican males and females experience lower disability rates than non-Hispanic whites and those of Mexican origin born in the United States. However, above age 64, foreign-born Mexican males have higher disability rates than white males, and foreign-born Mexican females have higher rates than US-born white females and females of Mexican origin born in the United States.
Surveying the literature on immigrant disability, the findings – collectively – suggest a health advantage at younger ages that later reverses. This type of phenomenon, known as a “crossover” in demography and public health, is based on two graphs representing age-specific rates of two populations that narrow, intersect, and then diverge over some age range. (See, e.g., Lariscy 2017 for a recent contribution on
black–white mortality crossovers at old age.) However, no study has systematically
type of disability. Further, while a few of the studies reviewed above base their findings on age 50 and older (Crimmins, Hayward, and Seeman 2004; Hayward et al. 2014; Melvin et al. 2014; Sheftel 2017; Warner and Brown 2011), the primary focus of research to date has been populations older than 60. Disablement is a process that can begin at young ages; thus, taking a broader (life course) perspective is important to understanding disability onset and progression (Verbrugge and Jette 1994).
This paper attempts to fill this void by presenting results from a comprehensive analysis of disability patterns comparing foreign-born Mexicans and non-Mexican Hispanic immigrants to US-born demographics from age 40. We use large nationally representative samples of these populations available in the 2010–2014 ACS, enabling us to determine more accurately the age-specific patterns of disability, including at what ages disability rates cross. Unlike previous studies, we estimate disability rates from middle working age onward (age 40 and above) and for single-year age groups. In addition to (unadjusted) rates of overall disability, we also present evidence stratified by gender and type of disability. Additionally, we look at patterns by educational attainment and age at migration to evaluate explanations related to socioeconomic status and acculturation.
2. Data, measures, and methods
Hispanic question. Similarly, non-Hispanic blacks are those who answered ‘black’ or ‘African American’ to the race question and ‘non-Hispanic’ to the Hispanic question.
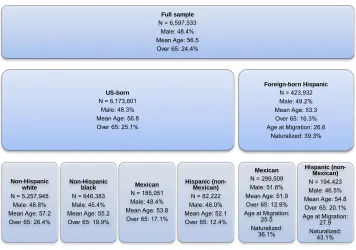
Table 1 displays basic descriptive statistics for the groups analyzed. Combined, our sample consists of 6,597,533 people between ages 40 and 80. The lower age bound of 40 was implemented to conduct analyses by age at migration (while still observing prime working ages). We did not go beyond age 80 because of sample size and selective mortality concerns. Results for those outside this age range are available upon request.
Table 1: Subgroups included in the analysis, sample size, and selected demographic characteristics (weighted)
Source: ACS 2010–2014.
ACS disability measures are generally considered reliable for studying US disability patterns and trends (Elo, Mehta, and Huang 2011; Erikson 2012; Gubernskaya, Bean, and Van Hook 2013; Markides et al. 2007; Siordia 2016; Siordia and Ramos 2015). The survey includes six disability questions regarding hearing, vision, cognitive, ambulatory, self-care, and independent living difficulties, covering a
Full sample N = 6,597,533
Male: 48.4% Mean Age: 56.5 Over 65: 24.4%
Foreign-born Hispanic N = 423,932 Male: 49.2% Mean Age: 53.3 Over 65: 16.3% Age at Migration: 26.6
Naturalized: 39.3%
Hispanic (non-Mexican) N = 194,423 Male: 46.5% Mean Age: 54.8 Over 65: 20.1% Age at Migration:
27.9 Naturalized:
43.1% Mexican
N = 299,509 Male: 51.6% Mean Age: 51.9 Over 65: 12.9% Age at Migration:
25.5 Naturalized:
36.1% US-born
N = 6,173,601 Male: 48.3% Mean Age: 56.8 Over 65: 25.1%
Hispanic (non-Mexican) N = 82,222 Male: 48.0% Mean Age: 52.1 Over 65: 12.4% Mexican
N = 185,051 Male: 48.4% Mean Age: 53.8 Over 65: 17.1% Non-Hispanic
black N = 648,383 Male: 45.4% Mean Age: 55.2 Over 65: 19.9% Non-Hispanic
white N = 5,257,945
wide range of activities and health-related difficulties. We constructed a binary measure of overall disability based on individuals’ responses to the six disability questions on the ACS survey (coded 1 if the individual answered affirmative to at least one of these six questions).
To estimate age-specific rates of disability for various groups (by gender), the individual-level data was aggregated by one-year age groups, using ACS provided
person weights,perwt,normalized using Stata’s analytic weight function. In addition to
overall disability prevalence rates (“any disability”), we report results from separate analyses of the six underlying disability domains. We also analyzed total disability rates, calculated using the total number of disabilities reported across the six domains.
Focusing on age-specific prevalence allows us to study disability patterns adjusted for differences in age structure across the underlying populations. Such differences do exist (see next section), and they have been shown to meaningfully affect aggregate disability patterns based on crude rates (Sheftel 2017).
For evidence of an immigrant health advantage in disability that reverses, we look for crossovers in age-specific rates. Our sample sizes are generally large, but since we are reporting rates for single-year age groups (by gender) statistical precision may still be a concern. We report 95% confidence intervals in all graphs and comment on the statistical significance of rates.
3. Results
3.1 Sample descriptive statistics
3.2 Mexican-born vs. US-born
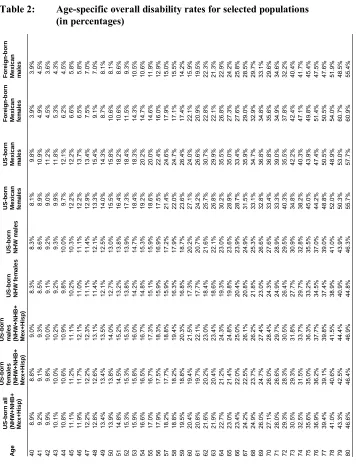
Table 2 shows age-specific prevalence rates of overall disability for selected subpopulations. We illustrate these results in a series of graphs. Figure 1 shows the overall disability rate for Mexican-born males and females respectively, using all US-born males and females for comparison (including US-US-born of Mexican origin).
As is evident from this first illustration of disability rates, both male and female foreign-born Mexicans start off with an overall disability advantage. In their 40s, they have the lowest rates of overall disability among the subpopulations investigated here. However, that advantage starts to decline with age, and it is reversed at old age. For example, at age 45, the overall disability rates for foreign-born Mexican males and females are 5.8% and 6.3%, respectively. This is compared to 11.1% for the US-born population. In contrast, 45.5% of Mexican-born males report having a disability at age 75 compared to 36.3% for US-born males. For Mexican-born females at this age, the rate is even greater at 49.8%, which compares to 36.3% for US-born females. These differences by gender are statistically significant, as indicated by the 95% confidence interval ranges.
Figure 1: Disability rates: Mexican-born vs. US-born by gender
Source:ACS 2010–2014.
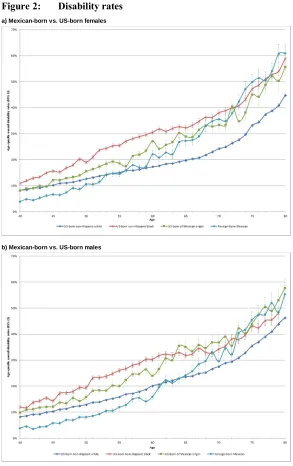
Figure 2: Disability rates
a) Mexican-born vs. US-born females
b) Mexican-born vs. US-born males
In addition, Figures 2a and 2b compare foreign-born Mexicans to US-born non-Hispanic blacks. Of note is the fact that disability rates for both male and female foreign-born Mexicans also cross over those of blacks, albeit at older ages than they do for non-Hispanic whites. This crossover is noticeable despite the fact that blacks are consistently found to have significantly lower life expectancies than foreign-born Hispanics (Lariscy, Hummer, and Hayward 2015), but it is consistent with previous findings that Mexican Americans (including foreign and US-born) have higher rates of functional limitations than blacks (Warner and Brown 2011).
Finally, Figures 2a and 2b also show the contrast between foreign-born Mexicans and American-born Mexicans. Compared to US-born whites, US-born of Mexican origin display greater disability prevalence across the entire age span (age 40 to 80), and this health disadvantage tends to widen significantly up to approximately age 65, after which it remains fairly stable. This pattern is in stark contrast to foreign-born Mexicans, whose disability rates are much below those of either American-born group at younger ages. At older ages, the disability rates of foreign-born Mexicans converge to the levels of those of Mexican origin born in the United States and, among foreign-born Mexican females, the levels even exceed those at some ages. Like the American-born of Mexican origin, foreign-American-born Mexicans display a more rapid increase in disability prevalence during working ages compared to US-born whites. However, while the gap between US-born of Mexican origin and whites is fairly stable at older ages, the rate rises faster for foreign-born Mexicans between ages 60 and 80, resulting in rate convergence.
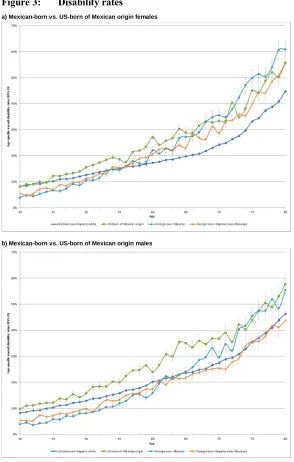
3.3 Mexican-born vs. other foreign-born Hispanics
Figure 3: Disability rates
a) Mexican-born vs. US-born of Mexican origin females
b) Mexican-born vs. US-born of Mexican origin males
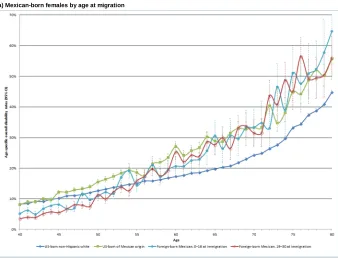
3.4 Mexican-born by age at migration
Figures 4a and 4b show the overall disability rates for Mexican-born Hispanic males and females by age at migration to the United States: immigrated by age 18 compared to immigrated between age 19 and 30. These groups were constructed to examine the potential role of (negative) acculturation. Previous studies have found that length of time in the United States and immigration at young ages have been found to be associated with poorer health outcomes consistent with an acculturation hypothesis (Markides and Rote 2015; Riosmena et al. 2015; Garcia et al. 2017; Garcia and Reyes 2017). The immigration literature traditionally distinguishes between those who immigrated as children and those who immigrated as adults because of their different acculturation trajectories (Oropesa and Landale 1997; Rumbaut 2004) and their impact on health and disability outcomes (Garcia et al. 2017; Garcia and Reyes 2017; Gubernskaya 2015; Gubernskaya, Bean, and Van Hook 2013).
Figure 4: Disability rates
Figure 4: (Continued)
b) Mexican-born males by age at migration
Source: ACS 2010–2014.
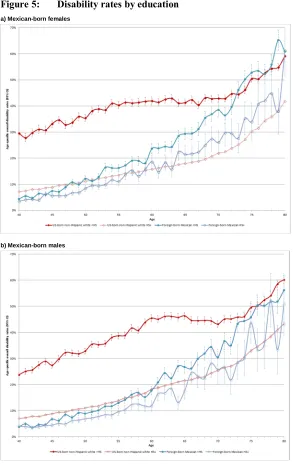
3.5 Mexican-born by education level
An alternative to the acculturation hypothesis is the idea that Hispanic immigrants are subject to disproportionate exposure to occupational risk (Kochhar 2005; Toussaint-Comeau 2006; Dong and Platner 2004; Smith et al. 2005). Unfortunately, occupation data is only available in the ACS for those individuals currently working and therefore not for those who have retired from the work force. We use educational attainment as a proxy for occupational (risk) environment. Specifically, to evaluate the possibility that the over-representation of foreign-born Mexicans in high-risk occupations contributes to higher disability rates at older ages, we divide our subgroups of interest by education level: those who have not completed a high school degree and those who graduated high school or completed a GED or have a higher level of education. Not having a high school degree tends to reduce the options in the labor market to more physically demanding occupations. If this is particularly true for foreign-born populations whose options are more limited to begin with, we would expect to see a more pronounced reversal pattern.
Figure 5: Disability rates by education
a) Mexican-born females
b) Mexican-born males
3.6 Specific disabilities
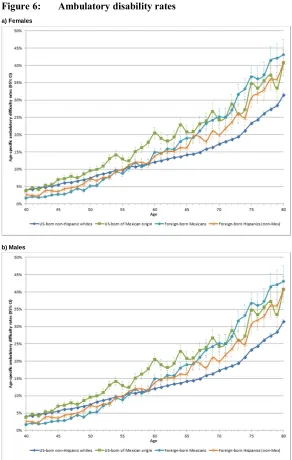
This section looks at the six components underlying the overall disability measure used above. Domain-specific analysis allows us to parse out the contribution of each component to the overall pattern and can help distinguish between different mechanisms and explanations for crossovers. The six disability domains are (1) ambulatory (Figures 6a–b), (2) cognitive (Figures 7a–b), (3) independent living (Figures 8a–b), (4) self-care (Figures 9a–b), (5) vision (Figures 10a–b), and (6) hearing (Figures 11a–b).
Across domains, with the exception of hearing and vision disabilities, there are three distinct features. First, the disability rates are greater for women than men. Second, foreign-born Mexicans consistently have the lowest rates at younger ages and the highest at old age. Third, the crossover in prevalence rates between whites and foreign-born Mexicans occurs around age 60. These patterns are consistent with the findings for overall disability prevalence shown above. There is some interesting variation in crossover ages for the different measures that we will now discuss in turn.
3.6.1 Ambulatory disability
Figure 6: Ambulatory disability rates
a) Females
b) Males
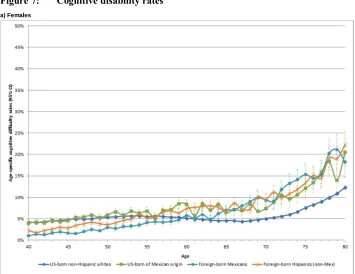
3.6.2 Cognitive disability
For foreign-born Mexican females, the cognitive disability rates cross over whites at about age 60, and although they fluctuate they can be as much as 10 percentage points higher. Among foreign-born Mexican men, cognitive disability is consistently more prevalent than among whites by age 65: rates fluctuate but tend to be about double those of white males (14% vs. 7%, 16% vs. 8%). (See Figures 7a and 7b.)
Figure 7: Cognitive disability rates
Figure 7: (Continued)
b) Males
Source: ACS 2010–2014.
3.6.3 Difficulty with independent living
Figure 8: Independent living difficulty rates
a) Females
b) Males
3.6.4 Difficulty with self-care
Difficulties in self-care are consistently more prevalent among female foreign-born Mexicans than whites by age 61 and are among the highest by age 73. For males, foreign-born Mexican self-care difficulty rates cross over whites at age 60 and then fluctuate but are up to 7% higher than whites at old age. (See Figures 9a and 9b.)
Figure 9: Self-care difficulty rates
Figure 9: (Continued)
b) Males
Source: ACS 2010–2014.
3.6.5 Visual disability
Figure 10: Visual disability rates
a) Females
b) Males
3.6.6 Auditory disability
Rates for auditory disabilities fluctuate but are consistently higher for foreign-born Mexican females than whites by age 65. However, the differences are not as great as for the other disabilities. For foreign-born Mexican males, hearing difficulties fluctuate but are mostly below whites, so this dimension is not a driver behind the pattern of disadvantage in overall disability. (See Figures 11a and 11b.)
Figure 11: Auditory disability rates
Figure 11: (Continued)
b) Males
Source: ACS 2010–2014.
4. Discussion and conclusion
and significantly greater after age 59 (66). Within these ages, disability rates for foreign-born Mexicans cross over those for non-Hispanic whites (of their respective gender). These “disability crossover” patterns are confirmed by additional analyses of specific disability domains and total number of disabilities (see Appendix Figure A-1).
The gender-stratified results reported here are consistent with the broader research on aging of the general population, which generally finds worse health outcomes for females as compared to males (e.g., Arber and Cooper 1999; Warner and Brown 2011). We document greater rates of disability prevalence among older foreign-born Mexican females, in aggregate as well as for specific disability domains, as compared to older foreign-born Mexican males. Coupled with findings of lower mortality rates and longer life expectancies, this points to an especially protracted period of disability for female Mexican immigrants and potentially a doubly disadvantaged population.
Potential explanations for this reversal in old age are ongoing and fall into three categories. First are those explanations that attribute the findings to the specific composition of immigrant populations. Specifically, there may be bias from nonrandom selection at work here. Young Mexicans with disabilities may not migrate in the first place for fear that disability may reduce employment opportunities and, for the same reason, those who become disabled at young ages after migrating may be more likely to return to their country of origin – processes that reduce the share of disabled migrants at young ages. This “healthy migrant hypothesis” or “salmon bias” in the Hispanic health paradox literature has been found to partially explain the lower mortality rates of immigrant populations. The fact that this analysis is based on cross-sectional data further implicates compositional differences driven by cohort variation over time. To substantiate this explanation, for Mexican immigrants born before 1960, educational attainment in Mexico was substantially lower and work conditions in the United States were harsher (Massey, Durand, and Malone 2002), both factors pointing to higher risk of disability. Given use of cross-sectional data, we cannot rule out these cohort-specific trends. Future research using longitudinal data is needed to investigate individual age– health trajectories and test specific explanations regarding immigrant disability.
United States. Healthier behavior among Hispanic immigrants and acculturation is consistent with a health advantage in disability at younger ages that subsequently narrows (to the extent that age proxies for time in the United States). However, our analysis by age at migration (see Figures 4a and 4b) finds similar disability rates between the two groups, contrary to what one would expect in the presence of important acculturation effects.
Finally, behavioral and environmental exposure factors make up the third category of explanations. Hayward et al. (2014) suggest that the apparent contradiction between low mortality rates but high disability rates among the (older) Hispanic immigrant population points to a decoupling of the typical connection between chronic disease and disability. Verbrugge and Jette’s (1994) sociomedical model of the disablement process, which describes the pathway from pathology to disability, highlights personal and environmental factors that may exacerbate the disablement process. The concentration of Mexicans in physically arduous and high-risk occupations (Kochhar 2005; Toussaint-Comeau 2006) with high rates of workplace injury (Dong and Platner 2004; Smith et al. 2005) is one such risk factor, and heightened disability rates among foreign-born Hispanics at older ages (Hayward et al. 2014; Melvin et al. 2014) may also reflect a cumulative effect of this risk factor.
Socioeconomic and residential disadvantage, and disparities in access to health care and health insurance (Derose, Escarce, and Lurie 2007) are additional environmental risk factors leading to a cumulative health disadvantage for low socioeconomic status immigrants like Mexicans (Warner and Brown 2011). Low levels of health insurance coverage, especially among the large undocumented Mexican population, are associated with lower rates of health care utilization (Ortega et al. 2007), which may exacerbate the disablement process over time. While these causal mechanisms remain in the realm of hypothesis here, they point to important directions for future research that would use longitudinal data to address change over time.
Taken as a whole, these potential explanatory mechanisms point to processes that heighten the risk for disability among the Mexican immigrant population but do not necessarily contribute to mortality. Thus, our findings are consistent with previous research concluding that low mortality rates together with high disability rates mean that Mexican immigrants are living a protracted period with disability at older ages (Markides et al. 2007). Further research modeling these processes is necessary beyond these largely descriptive findings.
The evidence presented here of a reversal in the Hispanic immigrant health advantage based on disability is subject to several caveats. Mortality differentials between the US-born and foreign-born populations may affect our results. If mortality is lower among older foreign-born Hispanics than natives, the most severely disabled US-born non-Hispanic whites may die earlier, leaving a positively selected (i.e., lower disability) comparison group. We cannot rule out that mortality selection is a contributing factor but note that disability rates cross at relatively young ages when mortality rates are relatively low and are similar between the two populations. Further, there is evidence that Hispanics are more health pessimistic than other demographics (Angel and Guarnaccia 1989; Bzostek, Goldman, and Pebley 2007; Hummer, Benjamins, Rogers 2004; Markides et al. 2007; Shetterly et al. 1996; Viruell-Fuentes et al. 2011). There may also be differences in self-reports based on language (Spanish vs. English) of the interview (Tirodkar et al. 2008). We note that our group comparisons within the Hispanic population would presumably remain valid, even in the presence of these types of measurement error (Chandola and Jenkinson 2000).
comparatively larger disablement risks during their working years, even among the more highly educated sector of the population. For policy makers and service providers, this implies that measures to reduce health disparities should be focused at even younger ages.
5. Acknowledgements
References
Abraido-Lanza, A.F., Chao, M.T., and Florez, K.R. (2005). Do healthy behaviors decline with greater acculturation? Implications for the Latino mortality paradox.
Social Science and Medicine 61(6): 1243–1255. doi:10.1016/j.socscimed.2005. 01.016.
Abraido-Lanza, A.F., Dohrenwend, B.P., Ng-Mak, D.S., and Turner, J.B. (1999). The Latino mortality paradox: A test of the ‘salmon bias’ and healthy migrant
hypotheses. American Journal of Public Health 89(10): 1543–1548.
doi:10.2105/AJPH.89.10.1543.
Akresh, I.R. (2007). Dietary assimilation and health among Hispanic immigrants to the
United States. Journal of Health and Social Behavior 48(4): 404–417.
doi:10.1177/002214650704800405.
Akresh, I.R. and Frank, R. (2008). Health selection among new immigrants.American
Journal of Public Health 98(11): 2058–2064.doi:10.2105/AJPH.2006.100974.
Alba, R. and Foner, N. (2015).Strangers no more: Immigration and the challenges of
integration in North America and Western Europe. Princeton: Princeton
University Press.doi:10.1515/9781400865901.
Angel, R.J. and Guarnaccia, P.J. (1989). Mind, body, and culture: Somatization among
Hispanics. Social Science and Medicine 28(12): 1229–1238.
doi:10.1016/0277-9536(89)90341-9.
Angel, R.J., Angel, J.L., and Hill, T.D. (2014). Longer lives, sicker lives? Increased
longevity and extended disability among Mexican-origin elders. Journals of
Gerontology Series B: Psychological Sciences and Social Sciences 70(4): 639– 649.doi:10.1093/geronb/gbu158.
Angel, R.J., Angel, J.L., Venegas, C.D., and Bonazzo, C. (2010). Shorter stay, longer life: Age-at-migration and mortality among the older Mexican-origin population.
Journal of Aging and Health 20(5): 1–18.doi:10.1177/0898264310376540. Antecol, H. and Bedard, K. (2006). Unhealthy assimilation: Why do immigrants
converge to American health status levels? Demography 43(2): 337–360.
doi:10.1353/dem.2006.0011.
Arber, S. and Cooper, H. (1999). Gender differences in health in later life: The new
paradox? Social Science and Medicine 48(1): 61–76. doi:10.1016/S0277-9536
Arias, E. (2010). United States life tables by Hispanic origin. Washington, D.C.: National Center for Health Statistics, Vital and Health Statistics.
Brault, M.W. (2009). Review of changes to the measurement of disability in the 2008
American Community Survey.Washington, D.C.: US Bureau of the Census. Bzostek, S., Goldman, N., and Pebley, A. (2007). Why do Hispanics in the USA report
poor health? Social Science and Medicine 65(5): 990–1003. doi:10.1016/j.
socscimed.2007.04.028.
Chandola, T. and Jenkinson, C. (2000). Validating self-rated health in different ethnic
groups.Ethnicity and Health 5(2): 151–159.doi:10.1080/713667451.
Cho, Y., Frisbie, W.P., Hummer, R.A., and Rogers, R.G. (2004). Nativity, duration of
residence, and the health of Hispanic adults in the United States. International
Migration Review 38(1): 184–211.doi:10.1111/j.1747-7379.2004.tb00193.x. Crimmins, E.M., Hayward, M.D. and Seeman, T.E. (2004). Race/ethnicity,
socioeconomic status, and health. In: Anderson, N.B., Bulatao, R.A., and Cohen,
B. (eds.).Critical perspectives on racial and ethnic differences in health in late
life. Washington, D.C.: National Academies Press: 310–352.
Crimmins, E.M., Soldo, B.J., Kim, J.K., and Alley, D.E. (2005). Using anthropometric indicators for Mexicans in the United States and Mexico to understand the
selection of migrants and the ‘Hispanic paradox.’ Social Biology 52(3–4): 164–
177.doi:10.1080/19485565.2005.9989107.
Dannefer, D. (2003). Cumulative advantage/disadvantage and the life course:
Cross-fertilizing age and social science theory. The Journals of Gerontology Series B:
Psychological Sciences and Social Sciences 58(6): S327–S337. doi:10.1093/ geronb/58.6.S327.
Derose, K.P., Escarce, J.J., and Lurie, N. (2007). Immigrants and health care: Sources
of vulnerability. Health Affairs 26(5): 1258–1268. doi:10.1377/hlthaff.26.5.
1258.
Dong, X. and Platner, J.W. (2004). Occupational fatalities of Hispanic construction
workers from 1992 to 2000.American Journal of Industrial Medicine 45(1): 45–
54.doi:10.1002/ajim.10322.
Elo, I.T., Mehta, N.K., and Huang, C. (2011). Disability among native-born and
foreign-born blacks in the United States. Demography 48(1): 241–265.
Elo, I.T., Turra, C.M., Kestenbaum, B., and Ferguson, B.R. (2004). Mortality among elderly Hispanics in the United States: Past evidence and new results.
Demography 41(1): 109–128.doi:10.1353/dem.2004.0001.
Erikson, W. (2012). A guide to disability statistics from the American Community
Survey (2008 forward). Ithaca: Cornell University Employment and Disability Institute.
Eschbach, K., Al-Snih, S., Markides, K.S., and Goodwin, J.S. (2007). Disability and active life expectancy of older US- and foreign-born Mexican Americans. In:
Angel, J.L. and Whitfield, K.E. (eds.). The health of aging Hispanics. New
York: Springer: 40–49.doi:10.1007/978-0-387-47208-9_4.
Eschbach, K., Kuo, Y., and Goodwin, J.S. (2006). Ascertainment of Hispanic ethnicity on California death certificates: Implications for the explanation of the Hispanic
mortality advantage. American Journal of Public Health 96(12): 2209–2215.
doi:10.2105/AJPH.2005.080721.
Fenelon, A. (2013). Revisiting the Hispanic mortality advantage in the United States:
The role of smoking. Social Science and Medicine 82: 1–9. doi:10.1016/j.
socscimed.2012.12.028.
Finch, B.K., Do, D.P., Frank, R., and Seeman, T. (2009). Could ‘acculturation’ effects be explained by latent health disadvantages among Mexican immigrants?
International Migration Review 43(3): 471–495.doi:10.1111/j.1747-7379.2009. 00774.x.
Franzini, L., Ribble, J.C., and Keddie, A.M. (2001). Understanding the Hispanic
paradox.Ethnicity and Disease 11(3): 496–518.
Garcia, M.A., Saenz, J.L., Downer, B., Chiu, C., Rote, S., and Wong, R. (2017). Age of migration differentials in life expectancy with cognitive impairment: 20-year
findings from the Hispanic-EPESE. The Gerontologist: gnx062. doi:10.1093/
geront/gnx062.
Garcia, M.A., Angel, J.L., Angel, R.J., Chiu, C., and Melvin, J. (2015). Acculturation,
gender, and active life expectancy in the Mexican-origin population.Journal of
Aging and Health 27(7): 1247–1265.doi:10.1177/0898264315577880.
Garcia, M.A. and Reyes, A.M. (2017). Physical functioning and disability trajectories
by age of migration among Mexican elders in the United States.The Journals of
Gubernskaya, Z. (2015). Age-at-migration and self-rated health trajectories after age
50: Understanding the older immigrant health paradox. The Journals of
Gerontology: Series B 70(2): 279–290.
Gubernskaya, Z., Bean, F.D., and Van Hook, J. (2013). (Un)healthy immigrant citizens
naturalization and activity limitations in older age. Journal of Health and Social
Behavior 54(4): 427–443.doi:10.1177/0022146513504760.
Hayward, M.D. and Gorman, B.K. (2004). The long arm of childhood: The influence of
early-life social conditions on men’s mortality. Demography 41(1): 87–107.
doi:10.1353/dem.2004.0005.
Hayward, M.D., Hummer, R.A., Chiu, C., González-González, C., and Wong, R. (2014). Does the Hispanic paradox in US adult mortality extend to disability?
Population Research and Policy Review 33(1): 81–96. doi:10.1007/s11113-013-9312-7.
Hummer, R.A., Benjamins, M.R., and Rogers, R.G. (2004). Racial and ethnic disparities in health and mortality among the US elderly population. In: National Research Council Panel on Race, Ethnicity and Health in Later Life (ed.).
Critical perspectives on racial and ethnic differences in late life. Washington, D.C.: National Academy Press: 53–94.
Hummer, R.A. and Hayward, M.D. (2015). Hispanic older adult health and longevity in
the United States: Current patterns and concerns for the future.Daedalus 144(2):
20–30.doi:10.1162/DAED_a_00327.
Hummer, R.A., Rogers, R.G., Amir, S.H., Forbes, D., and Frisbie, W.P. (2000). Adult mortality differentials among Hispanic subgroups and non-Hispanic whites.
Social Science Quarterly 81(1): 459–476.
Jasso, G., Massey, D.S., Rosenzweig, M.R., and Smith, J.P. (2000). The New Immigrant Survey Pilot (NIS-P): Overview and new findings about US legal
immigrants at admission.Demography 37(1): 127–138.doi:10.2307/2648101.
Judson, D.H. and Swanson, D.A. (2011).Estimating characteristics of the foreign born
by legal status: An evaluation of data and methods. New York: Springer. Kimbro, R.T. (2009). Acculturation in context: Gender, age-at-migration, neighborhood
ethnicity, and health behaviors. Social Science Quarterly 90(5): 1145–1166.
doi:10.1111/j.1540-6237.2009.00651.x.
Kochhar, R. (2005). The occupational status and mobility of Hispanics. Washington,
Landale, N.S., Oropesa, R.S., and Gorman, B.K. (2000). Migration and infant death:
Assimilation or selective migration among Puerto Ricans? American
Sociological Review65(6): 888–909.doi:10.2307/2657518.
Lariscy, J.T. (2011). Differential record linkage by Hispanic ethnicity and age in linked
mortality studies: Implications for the epidemiologic paradox.Journal of Aging
and Health 23(8): 1263–1284.doi:10.1177/0898264311421369.
Lariscy, J.T. (2017). Black–white disparities in adult mortality: Implications of
differential record linkage for understanding the mortality crossover.Population
Research and Policy Review 36(1): 137–156.doi:10.1007/s11113-016-9415-z. Lariscy, J.T., Hummer, R.A., and Hayward, M.D. (2015). Hispanic older adult
mortality in the United States: New estimates and an assessment of factors
shaping the Hispanic paradox. Demography 52(1): 1–14.
doi:10.1007/s13524-014-0357-y.
Lowenthal, T.A. (2006). American Community Survey: Evaluating accuracy.
Washington, D.C.: Population Reference Bureau.
Markides, K.S. and Coreil, J. (1986). The health of southwestern Hispanics: An
epidemiologic paradox.Public Health Reports 101(3): 253–265.
Markides, K.S. and Eschbach, K. (2005). Aging, migration, and mortality: Current
status of research on the Hispanic paradox. Journals of Gerontology:
Psychological and Social Sciences 60(S2): 68–72. doi:10.1093/geronb/60. Special_Issue_2.S68.
Markides, K.S. and Eschbach, K. (2011). Hispanic paradox in adult mortality in the
United States. In: Rogers, R.G. and Crimmins, E.M. (eds.). International
handbook of adult mortality. New York: Springer: 227–240. doi:10.1007/978-90-481-9996-9_11.
Markides, K.S., Eschbach, K., Ray, L.A., and Peek, M.K. (2007). Census disability rates among older people by race/ethnicity and type of Hispanic origin. In:
Whitfield, K.E. and Angel, J.L. (eds.). The health of aging Hispanics. New
York: Springer: 26–39.doi:10.1007/978-0-387-47208-9_3.
Markides, K.S. and Rote, S. (2015). Immigrant health paradox. In: Scott, R. and
Kosslyn, S. (eds.).Emerging trends in the social and behavioral sciences. New
Massey, D.S., Durand, J., and Malone, N.J. (2002). Beyond smoke and mirrors: Mexican immigration in an era of economic integration. New York: Russell Sage Foundation.
Masters, R.K., Hummer, R.A., and Powers, D.A. (2012). Educational differences in US
adult mortality: A cohort perspective. American Sociological Review 77(4):
548–572.doi:10.1177/0003122412451019.
Mehta, N.K., Sudharsanan, N., and Elo, I.T. (2013). Race/ethnicity and disability
among older Americans. In: Whitfield, K.E. and Baker, T. (eds.). Handbook of
minority aging. New York: Springer: 111–129. doi:10.1891/9780826109644. 0008.
Melvin, J., Hummer, R.A., Elo, I.T., and Mehta, N. (2014). Age patterns of racial/ethnic/nativity differences in disability and physical functioning in the
United States. Demographic Research 31(17): 497–510. doi:10.4054/DemRes.
2014.31.17.
Munnell, A.H. (2015). The average retirement age: An update. Center for Retirement
Research at Boston College: Issue in Brief15(4): 1–6.
Nam, S., Al-Snih, S., and Markides, K.S. (2015). Sex, nativity, and disability in older
Mexican Americans. Journal of the American Geriatrics Society 63(12): 2596–
2600.doi:10.1111/jgs.13827.
Oropesa, R.S. and Landale, N.S. (1997). In search of the new second generation: Alternative strategies for identifying second generation children and
understanding their acquisition of English. Sociological Perspectives 40(3):
429–455.doi:10.2307/1389451.
Ortega, A.N., Fang, H., Perez, V.H., Rizzo, J.A., Carter-Pokras, O., Wallace, S.P., and Gelberg, L. (2007). Health care access, use of services, and experiences among
undocumented Mexicans and other Latinos. Archives of Internal Medicine
167(21): 2354–2360.doi:10.1001/archinte.167.21.2354.
Palloni, A. and Arias, E. (2004). Paradox lost: Explaining the Hispanic adult mortality
advantage.Demography 41(3): 385–415.doi:10.1353/dem.2004.0024.
Passel, J.S. and Cohn, D. (2016). Overall number of US unauthorized immigrants holds steady since 2009 [electronic resource]. Washinton, D.C.: Pew Research Center.
Riosmena, F., Everett, B.G., Rogers, R.G., and Dennis, J.A. (2015). Negative acculturation and nothing more? Cumulative disadvantage and mortality during the immigrant adaptation process among Latinos in the United States.
International Migration Review 49(2): 443–478.doi:10.1111/imre.12102. Riosmena, F., Wong, R., and Palloni, A. (2013). Migration selection, protection, and
acculturation in health: A binational perspective on older adults. Demography
50(3): 1039–1064.doi:10.1007/s13524-012-0178-9.
Ruggles, S., Genadek, K., Goeken, R., Grover, J., and Sobek, M. (2015). Integrated public use microdata series: Version 6.0 [machine-readable database]. Minneapolis: University of Minnesota.
Rumbaut, R.G. (2004). Ages, life stages, and generational cohorts: Decomposing the
immigrant first and second generations in the United States. International
Migration Review 38(3): 1160–1205.doi:10.1111/j.1747-7379.2004.tb00232.x. Schwatka, N.V., Butler, L.M., and Rosecrance, J.R. (2012). An aging workforce and
injury in the construction industry. Epidemiologic Reviews 34(1): 156–167.
doi:10.1093/epirev/mxr020.
Sheftel, M.G. (2017). Prevalence of disability among Hispanic immigrant populations:
New evidence from the American Community Survey.Population Review 56(1).
doi:10.1353/prv.2017.0000.
Shetterly, S.M., Baxter, J., Mason L.D., and Hamman, R.F. (1996). Self-rated health among Hispanic vs non-Hispanic white adults: The San Luis Valley Health and
Aging Study. American Journal of Public Health 86(12): 1798–1801.
doi:10.2105/AJPH.86.12.1798.
Shor, E., Roelfs, D., and Vang, Z.M. (2017). The ‘Hispanic mortality paradox’ revisited: Meta-analysis and meta-regression of life-course differentials in Latin
American and Caribbean immigrants’ mortality. Social Science and Medicine
186: 20–33.doi:10.1016/j.socscimed.2017.05.049.
Singh, G.K. and Siahpush, M. (2002). Ethnic-immigrant differentials in health behaviors, morbidity, and cause-specific mortality in the United States: An
analysis of two national data bases. Human Biology 74(1): 83–109.doi:10.1353/
hub.2002.0011.
Siordia, C. (2016). Self-care and mobility disability at mid-life in lucky few, early-, and
late-baby boom birth-cohorts. Journal of Health Disparities Research and
Siordia, C. and Ramos, A.K. (2015). Evidence of the ‘Hispanic paradox’ from the poverty and disability nexus in the Latino farmworker population of the United
States. Global Journal of Biology, Agriculture and Health Sciences 4(3): 118–
124.
Siordia, C. and Young, R. (2013). Methodological note: Allocation of disability items
in the American Community Survey. Disability and Health Journal 6(2): 149–
153.doi:10.1016/j.dhjo.2012.11.007.
Smith, G.S., Wellman, H.M., Sorock, G.S., Warner, M., Courtney, T.K., Pransky, G.S., and Fingerhut, L.A. (2005). Injuries at work in the US adult population:
Contributions to the total injury burden. American Journal of Public Health
95(7): 1213–1219.doi:10.2105/AJPH.2004.049338.
Stern, S.M. (2004). Counting people with disabilities: How survey methodology
estimates influence estimates in Census 2000 and the Census 2000 Supplementary Survey. Washington, D.C.: Bureau of the Census.
Tirodkar, M.A., Song, J., Chang, R.W., Dunlop, D.D., and Chang, H.J. (2008). Racial and ethnic differences in activities of daily living disability among the elderly:
The case of Spanish speakers.Archives of Physical Medicine and Rehabilitation
89(7): 1262–1266.doi:10.1016/j.apmr.2007.11.042.
Toussaint-Comeau, M. (2006). The occupational assimilation of Hispanic immigrants
in the US: Evidence from panel data. International Migration Review 40(3):
508–536.doi:10.1111/j.1747-7379.2006.00034.x.
Turra, C.M. and Elo, I. (2008). The impact of salmon bias on the Hispanic mortality
advantage. Population Research and Policy Review 27(5): 515–530.
doi:10.1007/s11113-008-9087-4.
Van Hook, J., Bachmeier, J.D., Coffman, D.L., and Harel, O. (2015). Can we spin straw into gold? An evaluation of immigrant legal status imputation approaches.
Demography 52(1): 329–354.doi:10.1007/s13524-014-0358-x.
Verbrugge, L.M. and Jette, A.M. (1994). The disablement process.Social Science and
Medicine 38(1): 1–14.doi:10.1016/0277-9536(94)90294-1.
Verbrugge, L.M. (2016). Disability experience and measurement.Journal of Aging and
Viruell-Fuentes, E.A., Morenoff, J.D., Williams, D.R., and House, J.S. (2011). Language of interview, self-rated health, and the other Latino health puzzle.
American Journal of Public Health 101(7): 1306–1313. doi:10.2105/AJPH. 2009.175455.
Warner, D.F. and Brown, T.H. (2011). Understanding how race/ethnicity and gender
define age-trajectories of disability: An intersectionality approach. Social
Science and Medicine 72(8): 1236–1248.doi:10.1016/j.socscimed.2011.02.034. Weigel, M.M., Armijos, R.X., and Beltran, O. (2014). Musculoskeletal injury,
functional disability, and health-related quality of life in aging Mexican
immigrant farmworkers.Journal of Immigrant and Minority Health 16(5): 904–
913.doi:10.1007/s10903-013-9788-6.
Woodrow-Lafield, K.A. (2012). A sociology of official unauthorized statistics: Estimation or guesstimation? In: Hoque, N. and Swanson, D.A. (eds.).
Opportunities and challenges for applied demography in the 21st century. New
York: Springer: 49–80.doi:10.1007/978-94-007-2297-2_5.
Zsembik, B.A. and Fennell, D. (2005). Ethnic variation in health and the determinants
of health among Latinos. Social Science and Medicine 61(1): 53–63.
Appendix
This appendix provides greater detail specific to the use of American Community Survey (ACS) data in this paper:
1. ACS measures of disability
The six disability-related instruments measuring hearing, vision, cognitive, ambulatory, self-care, and independent living difficulty in the ACS and (comparable instruments from the Census long form) are commonly used in disability research (e.g., Elo, Mehta, and Huang 2011; Gubernskaya, Bean, and Van Hook 2013; Markides et al. 2007; Siordia and Ramos 2015; Stern 2004). They are similar to questions found in other surveys and censuses worldwide (Verbrugge 2016). In particular, self-care and
independent living difficulty measures mirror the widely usedActivities of Daily Living
(ADL) andInstrumental Activities of Daily Living(IADL) measures (Brault 2009). The
ACS hearing, vision, cognitive, ambulatory, and self-care disability instruments have been shown to provide reliable measures; the independent living instrument has been found to be somewhat less reliable (Stern 2004).
Following is the wording for each of the six survey questions related to disability:
∂ Hearing Difficulty: “Is this person deaf or does he/she have serious difficulty
hearing?”
∂ Vision Difficulty: “Is this person blind or does he/she have serious difficulty
seeing even when wearing glasses?”
∂ Cognitive Difficulty: Because of a physical, mental, or emotional condition,
does this person have serious difficulty concentrating, remembering, or making decisions?”
∂ Ambulatory Difficulty: “Does this person have serious difficulty walking or
climbing stairs?”
∂ Self-Care Difficulty: “Does this person have difficulty dressing or bathing?”
∂ Independent Living Difficulty: “Because of a physical, mental, or emotional
2. Site of ACS data collection
Data collection for the ACS takes place in individual households; institutional group quarters, which include nursing homes, correctional facilities, and mental hospitals; and in noninstitutional group quarters, which include college dormitories, military barracks, group homes, missions, and shelters. While a separate analysis of those in nursing home facilities specifically would be valuable for this age group, the public-use data does not allow disaggregation by individual type of institutional group quarters, precluding a
separate analysis of nursing home residents. See https://www.census.gov/topics/ income-poverty/poverty/guidance/group-quarters.html for more details.
3. Underreporting of Hispanics in the ACS
Figure A-1: Total count of age-specific overall disability rates by gender, race/ethnicity, and nativity