Iranian Chemical Society
Anal. Bioanal. Chem. Res., Vol. 7, No. 1, 49-60, January 2020.
A Green Enrichment Method of Copper, Manganese and Nickel in Water Samples
via Cloud Point Extraction
Ragaa El Sheikh, Mohammed Shaltout, Kamal El Nabawy and Ayman A. Gouda*
Department of Chemistry, Faculty of Science, Zagazig University, Zagazig, Egypt (Received 18 March 2019 Accepted 8 July 2019)
A new, cost-effective, and environmental-friendly cloud point extraction methodology was described for enrichment of water samples containing copper, manganese and nickel. The method involves the complexation of copper, manganese or nickel with 2-amino-6-(1,3-thiazol-2-diazeyl)-phenol at pH 7.0, then extraction into Triton X-114. After dilution of the surfactant-rich phase with acidified methanol, the enriched analytes concentration was estimated by flame atomic absorption spectrometry. Parameters that influenced cloud point extraction, such as pH, reagent, surfactant and nitric acid concentrations, centrifuge rate and time, temperature, incubation time, as well as interferences were evaluated and optimized. The preconcentration factor was 100, enrichment factors were 14, 11.10 and 11.30 and the detection limits were 0.37, 1.20 and 1.30 µg l-1 for copper, manganese, and nickel, respectively. The method presented relative standard deviation as precision was found to be 2.20%, 2.50 and 3.20% for copper, manganese, and nickel, respectively. The accuracy of the new preconcentration procedure was evaluated by the analysis of the standard reference materials (SRM 1570a Spinach Leaves and SRM 1515 Apple Leaves), and successfully applied to determine Cu2+, Mn2+ and Ni2+ in real water samples with relative recovery values in the range
of 95.0%-99.0% for the spiked samples. .
Keywords: Cloud point extraction, Copper, Manganese, Nickel, FAAS,Water
INTRODUCTION
Heavy metals Cu2+, Mn2+ and Ni2+ are very abundant natural elements having a harmful effect on public health. High contents of copper cause vomiting or diarrhea in the human. Liver or kidney damage may be caused by long-term exposure. Nickel is a toxic element which can rise pathological lung lesions, skin disorders and may be carcinogenic. Manganese is an important micronutrient for human beings [1,2].
The continuous monitoring of heavy metals (Cu2+, Mn2+ and Ni2+) in environmental samples is quite duty to appreciate environmental contamination of these samples. Due to the faint concentrations of these analytes in these samples, new and sensitive instrumental techniques are
*Corresponding author. E-mail: aymangouda77@gmail. com
needed and developed to detect them in these samples after a preconcentration and extraction steps [3-5]. The estimation of Cu2+, Mn2+ and Ni2+ contents in various samples is generally executed by FAAS [6,7], inductively coupled optical emission spectrometry [8], spectrophotometry [9-12] and electrochemical [13] techniques.
coprecipitation [4,14], solid-phase extraction [5,15-17], liquid-liquid extraction [18], membrane filtration [19,20] and cloud-point extraction (CPE) [21-24].
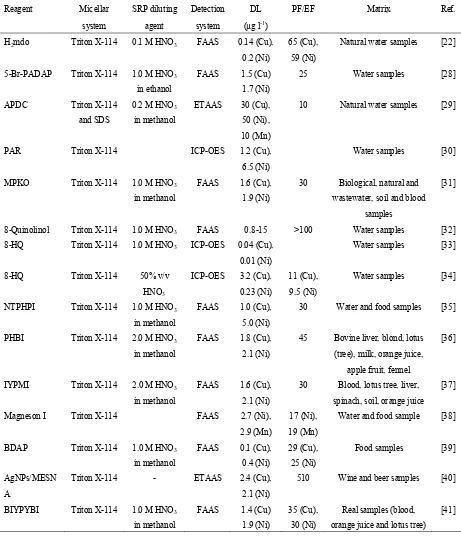
For separation and enrichment of trace levels of heavy metals, the green CPE procedure was used, because it uses inexpensive and non-toxic non-ionic surfactants with the reduced extraction time [25-27]. CPE is based on the distribution of the analyte between two phases at the cloud point temperature. One phase includes a surfactant at a concentration lower than the critical micelle concentration, and the other phase extracting the metal ions of the solution as metal complexes. Table 1 describes the previous CPE methods for enrichment and quantification of Cu2+, Mn2+
and Ni2+ in different samples [28-41].
In the present work, ecofriendly, selective and sensitive CPE extraction method for enrichment and quantification of trace levels of Cu2+, Mn2+ and Ni2+ in real water samples is described. The factors influencing the efficiency of CPE procedure are optimized. 2-Amino-6-(1,3-thiazol-2-diazeyl)-phenol (ATDP) synthesized as a selective chelating agent by our group is used for preconcentration of the studied analytes by CPE in the presence of Triton X-114 (Fig. 1).
EXPERIMENTAL
Apparatus
A Varian AA 240FS FAAS (Varian, Australia) was equipped with D2 background corrector and a flame burner. A 10 cm long slot-burner head, a hollow cathode lamp and an air-acetylene flame was used for all absorption measurements. The wavelength for Cu, Mn and Ni, were at 324.8, 279.5 and 232 nm, respectively. The pH-meter (Thermo scientific, USA) was utilized for pH measurements. A thermostated water bath (Memmert WNB7-45 WNB 22, Germany) was used. Centrifuge (Isolab, Germany) was used to centrifuge the samples.
Chemicals and Reagents
All chemicals used in this work were of analytical grade and were obtained from Merck (Darmstadt, Germany) or Fluka (Bunch., Switzerland).The Ultra-pure deionized water was used in all experiments. All the plastic and laboratory glass wares were cleaned by soaking in 5.0% (v/v) HNO3
solution for 24 h and then rinsed and cleaned with deionized water at least three times prior to use.
The standard stock solutions of Cu2+, Mn2+ and Ni2+ ions (1000 mg l-1) were prepared by dissolving the
appropriate weight of high purity Cu(NO3)2.3H2O,
Mn(NO3)2.4H2O and Ni(NO3)2.6H2O in 1.0 l HNO3.
Working solutions were prepared by an appropriate dilution of stock solutions.
Buffer solutions were prepared to adjust the pH values; acetate buffer (3.0-6.0), phosphate buffer (pH 7.0), and ammoniacal buffer (8.0-10) [42].
Triton X-114 (Fluka, Buches, Switzerland) was used without further purification. Aqueous 1.0% (v/v) solution of Triton X-114 was prepared by dissolving 1.0 ml of Triton X-114 in 100 ml of deionized water in 100 ml volumetric flask with stirring.
Nitric acid solutions were prepared by direct dilution with deionized water from the concentrated solutions. Methanol, acetone, and ethanol (Merck) were used to decrease the viscosity of surfactant-rich phase. The solutions of various cations and anions used for the interference study were obtained from the respective high purity inorganic salts (Sigma-Aldrich, USA) by proper dilution in bi-distilled water.
A stock solution (1.0 × 10⁻³ M) of ATDP was prepared by dissolving an appropriate amount of the reagent in a minimum amount of absolute ethanol and diluting the mixture to 100 ml with ethanol in a 100 ml measuring flask. The working solution was prepared by its appropriate dilution with the same solvent.
The accuracy of the proposed method was assessed by analyzing the certified reference material SRM 1570a Spinach Leaves and SRM 1515 Apple Leaves from the National Institute of Standards and Technology (Gaithersburg, MD, USA).
Procedure for CPE
To 25 ml of the standard or sample solution containing Cu2+, Mn2+ and Ni2+, 4.0 ml of phosphate buffer solution was added for adjustment of pH 7.0. A 2.5 ml of ATDP (1.0 × 10⁻³ M) and 1.0 ml of Triton X-114 (1.0%, v/v)
Table 1. Comparison of the Previously Published CPE Methods with the Proposed Method for Preconcentration of Cu2+, Mn2+ and Ni2+
Reagent Micellar
system
SRP diluting
agent
Detection
system
DL
(µg l-1)
PF/EF Matrix Ref.
H2mdo Triton X-114 0.1 M HNO3 FAAS 0.14 (Cu),
0.2 (Ni)
65 (Cu),
59 (Ni)
Natural water samples [22]
5-Br-PADAP Triton X-114 1.0 M HNO3
in ethanol
FAAS 1.5 (Cu)
1.7 (Ni)
25 Water samples [28]
APDC Triton X-114
and SDS
0.2 M HNO3
in methanol
ETAAS 30 (Cu),
50 (Ni),
10 (Mn)
10 Natural water samples [29]
PAR Triton X-114 ICP-OES 1.2 (Cu),
6.5 (Ni)
Water samples [30]
MPKO Triton X-114 1.0 M HNO3
in methanol
FAAS 1.6 (Cu),
1.9 (Ni)
30 Biological, natural and
wastewater, soil and blood
samples
[31]
8-Quinolinol Triton X-114 1.0 M HNO3 FAAS 0.8-15 >100 Water samples [32]
8-HQ Triton X-114 1.0 M HNO3 ICP-OES 0.04 (Cu),
0.01 (Ni)
Water samples [33]
8-HQ Triton X-114 50% v/v
HNO3
ICP-OES 3.2 (Cu),
0.23 (Ni)
11 (Cu),
9.5 (Ni)
Water samples [34]
NTPHPI Triton X-114 1.0 M HNO3
in methanol
FAAS 1.0 (Cu),
5.0 (Ni)
30 Water and food samples [35]
PHBI Triton X-114 2.0 M HNO3
in methanol
FAAS 1.8 (Cu),
2.1 (Ni)
45 Bovine liver, blond, lotus
(tree), milk, orange juice,
apple fruit, fennel
[36]
IYPMI Triton X-114 2.0 MHNO3
in methanol
FAAS 1.6 (Cu),
2.1 (Ni)
30 Blood, lotus tree, liver,
spinach, soil, orange juice [37]
Magneson I Triton X-114 FAAS 2.7 (Ni),
2.9 (Mn)
17 (Ni),
19 (Mn)
Water and food sample [38]
BDAP Triton X-114 1.0 MHNO3
in methanol
FAAS 0.1 (Cu),
0.4 (Ni)
29 (Cu),
25 (Ni)
Food samples [39]
AgNPs/MESN
A
Triton X-114 - ETAAS 2.4 (Cu),
2.1 (Ni)
510 Wine and beer samples [40]
BIYPYBI Triton X-114 1.0 M HNO3
in methanol
FAAS 1.4 (Cu)
1.9 (Ni)
35 (Cu),
30 (Ni)
Real samples (blood,
40 °C cloud point temperature. To settle the produced micelles, the mixture was centrifuged for 10 min at 4000 rpm and afterwards it was cooled down in an ice bath for 5.0 min. After cooling, the viscosity of the surfactant-rich phase was increased. The supernatant was then decantated by inverting the tube. The surfactant-rich phase was dissolved with 500 µl of methanol solution containing 1.0 M HNO3 to decrease the viscosity and facilitate
introduction in FAAS nebulizer. The content of Cu2+, Mn2+ and Ni2+ in the solution was then measured by flame atomic absorption spectrometry (FAAS) under the operating conditions.
Applications in Real Water Samples
The proposed method was applied to different water
samples, including tap, mineral, well and sea water samples.
The tap, mineral and well water samples were collected from Zagazig city, Egypt and sea water samples from Red
Sea, Egypt, and the samples stored in polyethylene bottles.
The samples were filtered through a cellulose membrane
filter (Millipore) of 0.45 μm pore size and acidified with
1.0% (v/v) HNO3 and were subsequently stored at 4.0°C in
a refrigerator. The organic content of the water samples was
oxidized in the presence of 1.0% H2O2 and by the addition
of concentrated nitric acid. The pH of the samples was
adjusted to 7.0 with a buffer solution. Then the
preconcentration CPE procedure given above was applied to
understudy water samples. The analyte concentrations in the
samples were determined by FAAS [43-45]. Table 1. Continued
ATDP
Cu(II) 0.37 100
Mn(II) 1.20 100
Ni(II)
Triton X-114 1.0 MHNO3
in methanol
FAAS
1.30 100
Water samples Propo
sed
work
NH2
OH
N N
S N
Fig. 1. The chemical structure of 2-amino-6-(1,3-thiazol-2-diazeyl)-phenol (ATDP).
Abbreviations: DL: detection limit; SRP: surfactant rich phase; PF: preconcentration factor; EF: enrichment factor; SDS: sodium dodecyl sulfate; H2mdo: 3-[(8-{[(E)-2-hydroxyimino-1-methylpropylidene]amino}-1-naphthyl)
imino]‐2‐butanone oxime; 5-Br-PADAP: 2-(5-bromo-2-pyridylazo)-5-diethylaminophenol; APDC: ammonium pyrrolidine dithiocarbamate; PAR: 4-(2-pyridylazo)-resorcinol; MPKO: methyl-2-pyridylketone oxime; HQ: 8-hydroxyquinoline; NTPHPI: N-(2-thiophenyl)-1-(2-hydoxyphenyl)imine; PHBI: 2-phenyl-1H-benzo[d]imidazole; IYPMI: 3-((indolin-3-yl)(phenyl)methyl)indoline; Magneson I: p-nitrophenylazoresorcinol; BDAP: 2-(2'-benzothiazolylazo)-5-(N,N-diethyl)aminophenol; AgNPs: silver nanoparticles; MESNA: 2-mercaptoethanesulfonic acid; BIYPYBI: 2-(6-(1H-benzo[d]imidazol-2-yl)pyridin-2-yl)-1H-benzo[d]Imidazole; ETAAS; Electrothermal atomic absorption spectrometry; ICP-OES: inductively coupled plasma optic emission spectrometry; FAAS: flame atomic absorption spectrometry.
Applications in Certified Reference Materials
Another application of the presented procedure was performed using certified reference materials [SRM 1570A Spinach leaves and SRM 1515 Apple leaves (0.25 g)]. Afterward, they were placed in small mesh and dried in an oven at 90 °C to constant weights. The samples were digested with 5.0 ml of HNO3 (1:1 v/v) in the microwave
digestion system and evaporated to near dryness. After evaporation, 10 ml of deionized water was added, and the sample was mixed. The appropriate buffer solution was used to adjust the pH 7.0. The resulting mixture was filtered through filter paper and then diluted to 50 ml with deionized water. The preconcentration procedure given above was applied to the sample. The analytes in the final solution were determined by FAAS.
RESULTS AND DISCUSSION
The analytical variables such as pH, reagent and surfactant concentrations, temperature and centrifugation times were optimized using the cloud point extraction procedure described above for Cu2+, Mn2+ and Ni2+ solution.
Effect of pH
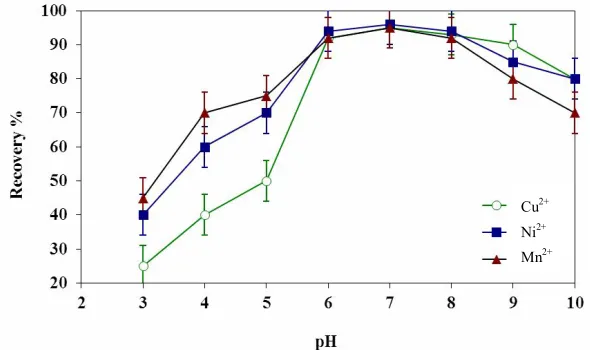
The pH value has a critical role in formation of metal-chelate complex, so, the influence of pH on CPE of Cu2+, Mn2+ and Ni2+ was investigated by changing the pH values of buffer solutions in the range of 3.0-10. As seen in Fig. 2, pH 7.0 (phosphate buffer) found to be the optimum pH value to achieve maximum metal extraction as well as the high efficiency and good selectivity. Accordingly, pH 7.0 was employed in subsequent experiments. In addition, the effect of the buffer volume was assessed. Based on the results 4.0 ml of phosphate buffer solution was chosen as the optimum volume.
Effect of ATDP Concentration
In order to study the influence of ATDP concentration on the extraction efficiency and analytical response for Cu2+, Mn2+ and Ni2+, different concentrations of the reagent ranging between 1.0 10-5-1.0 10-4 M were used, and the
general procedure was applied. The results in Fig. 3 showed that the extraction efficiency is increased with increasing the concentration of ATDP up to 5.0 × 10⁻⁵ for Cu2+, Mn2+
and Ni2+, and no significant change in the absorbance was observed after that. Therefore, for all further experiments 5.0 × 10⁻⁵ M ATDP solution was selected as the optimum concentration for the CPE of three metals.
Effect of Triton X-114 Concentration
The effect of non-ionic surfactant concentration on CPE efficiency for preconcentration and separation of Cu2+, Mn2+ and Ni2+ was investigated within the Triton X-114 concentration range of 0.2-2.0% (v/v). Triton X-114 was selected due to its high-density surfactant-rich phase and low cloud point temperature which encourage phase separation by centrifugation. The results were recorded in Fig. 4. The extraction efficiency was increased by increasing the concentration of Triton X-114 up to 1.0% (v/v). After that, with increasing the surfactant amounts to more than 1.0% (v/v), a considerable decrease in the extraction efficiency was observed. Thus, Triton X-114 concentration of 1.0% (v/v) was chosen for the subsequent experiments to achieve the highest extraction efficiency.
Effects of Incubation Time and Temperature
In order to achieve the efficient and easy phase separation in CPE processes, the incubation time and equilibrium temperature should be optimized. The influence of the incubation time and temperature was investigated in the range of 5.0-30 min and at 25-70 °C. The results elucidated that extraction efficiency would be optimal at the incubation time of 10 min and an equilibrium temperature of 40 °C for the three analytes. A centrifuge time period of 10 min at 4000 rpm was selected as the optimum time for complete separation.
Effect of Sample Volume
Fig. 2. Influence of the pH on the CPE recovery of Cu2+, Mn2+ and Ni2+ ions.
Fig. 3. Effect of ATDP concentration on the CPE recovery of Cu2+, Mn2+ and Ni2+ ions.
Fig. 4. Effect of Triton X-114 concentration on the CPE recovery of Cu2+, Mn2+ and Ni2+ ions. Cu2+
Ni2+ Mn2+
Cu2+ Ni2+ Mn2+
volumes of a real water (10-200 ml). A volume of 50 ml of water sample showed the best recovery percentages and was chosen for the subsequent studies.
Effects of Diluent
In order to facilitate the introduction of the surfactant-rich phase into the FAAS nebulizer and to obtain a homogeneous solution with compatible viscosity, addition of a diluent was needed. Surfactant-rich phase was found to be freely soluble in methanol. A 1.0 MHNO3 solution to
methanol (1:1) was employed. Hence, 500 μl of acidified methanol was used as the optimal volume of diluent for the surfactant-rich phase. Therefore, the preconcentration factor, defined as the ratio of the initial solution volume to the volume of surfactant rich phase, was found to be 100 using the proposed CPE method.
Interference Studies
The effect of matrix constituents of water samples on the extraction efficiency of Cu2+, Mn2+ and Ni2+ was examined. Various amounts of foreign ions were added to 50 ml portion of sample solution containing 100 µg l-1 Cu2+, 200 µg l-1 Mn2+ and 150 µg l-1 Ni2+ and the developed CPE
procedure was applied. The tolerance limits were determined for a maximum error of ≤ ±5.0% and the results are given in Table 2. These results demonstrate that the commonly present ions in water samples did not affect significantly on the preconcentration and the recoveries of the analyte ions. Therefore, the developed CPE procedures can be applied to determination of Cu2+, Mn2+ and Ni2+ in water samples.
Analytical Figures of Merit
The regression equations for Cu2+, Mn2+ and Ni2+
determination were A = 1.3 × 10⁻³ + 1.4 × 10⁻³C (R2 = 0.9995) (2.0-100 µg ml-1), A = 1.6 × 10⁻³ + 9.0 × 10⁻⁴C (R2 = 0.9997) (5.0-200 µg ml-1) and A = 7.0 × 10⁻⁴ + 1.0 × 10⁻³C (R2 = 0.9996) (5.0-150 µg ml-1), respectively, where A is the absorbance and C is the metal concentration in solution (µg ml-1) under the optimal conditions of the CPE procedure. By using direct aspiration in FAAS without the preconcentration CPE procedure, the linear equations were A = 1.0 × 10⁻³ + 1.0 × 10⁻⁴C (R2 = 0.9996) (200-
4000 µg ml-1), A = -2.1 × 10⁻³ + 8.0 × 10⁻⁵C (R2 = 0.9993)
(300-6000 µg ml-1) and A = 4.9 × 10⁻³ + 9.0 × 10⁻⁵C (R2 = 0.9994) (100-5000 µg ml-1), respectively. The
enhancement factor, calculated as the ratio of the slope of the calibration graph with preconcentration CPE procedure to the slope of the calibration graph without CPE (direct aspiration), was also approximately 14, 11.30 and 11.10 for Cu2+, Mn2+ and Ni2+, respectively. The consumptive index is defined as the sample volume, in milliliters, consumed to reach a unit of enrichment factor (EF): CI = Vs (ml)/EF, where Vs is the sample volume which was 3.57, 3.77 and 4.50 for Cu2+, Mn2+ and Ni2+, respectively. The limit of detection, defined as CL = 3SB/m (where CL, SB and m are
limit of detection, standard deviation of the blank, and the slope of the calibration graph, respectively (n = 10)) was found to be 0.37, 1.20 and 1.20 µg ml-1 for Cu2+, Mn2+ and Ni2+, respectively. The precision of the CPE procedure was determined as the relative standard deviation (RSD) and relative error for nine replicate measurements carried out in solutions containing 100 µg ml-1 of Cu2+, Mn2+ and Ni2+ which was found to be 2.20%, 3.20% and 2.50%, respectively (Table 3).
Analytical Applications
In order to test the reliability and applicability of the proposed CPE method, it was applied to the determination of Cu2+, Mn2+ and Ni2+ in various real water samples. The added spiked analytes (50 or 100 µg l-1) can be quantitatively recovered from the water samples by the proposed CPE procedure. The percentage recovery (R) was calculated using the equation:
R% = {(Cm - C0)/m} × 100
where Cm is a value of the metal in a spiked sample, C0 is a
Table 2. The Tolerance Limit of Co-existing Ions for Preconcentration and Determination of of Cu2+, Mn2+ and Ni2+ (N = 3.0)
Recovery (%) ± SDa
Interfering
ions
Added as Interferent/
analyte ratio Cu2+ Mn2+ Ni2+
K+ KCl 7000:1 96.0 ± 3.0 95.0 ± 1.0 97.0 ± 2.0
Na+ NaCl 7000:1 96.0 ± 2.0 96.0 ± 4.0 97.0 ± 2.0
Al3+ Al (NO3)3 600:1 95.0 ± 1.0 97.0 ± 2.0 96.0 ± 2.0
Cr3+ Cr(NO3)3 6000:1 97.0 ± 2.0 95.0 ± 2.0 96.0 ± 3.0
Fe3+ FeCl3 500:1 96.0 ± 3.0 96.0 ± 1.0 95.0 ± 2.0
Ca2+ CaCl2 2000:1 95.0 ± 2.0 98.0 ± 3.0 96.0 ± 3.0
Mg2+ MgCl2 2000:1 96.0 ± 2.0 95.0 ± 3.0 98.0 ± 2.0
Zn2+ ZnSO
4 300:1 97.0 ± 3.0 96.0 ± 3.0 97.0 ± 3.0
Pb2+ Pb(NO3)2 300:1 98.0 ± 2.0 95.0 ± 2.0 95.0 ± 2.0
Cd2+ Cd(NO3)2 300:1 95.0 ± 2.0 98.0 ± 3.0 97.0 ± 2.0
NO3- KNO3 5000:1 95.0 ± 2.0 95.0 ± 2.0 96.0 ± 2.0
SO42- Na2SO4 5000:1 97.0 ± 3.0 96.0 ± 2.0 98.0 ± 2.0
Cl - NaCl 5000:1 95.0 ± 2.0 95.0 ± 3.0 97.0 ± 3.0
F- NaF 5000:1 96.0 ± 3.0 95.0 ± 1.0 95.0 ± 2.0
aMean ± standard deviation.
Table 3. Analytical Figures of Merit for Determination of Cu2+, Mn2+ and Ni2+
Parameters Cu2+ Mn2+ Ni2+
Calibration range (µg l-1) 2.0-100 5.0-200 5.0-150
Regression equation (n = 6)a
Slope 0.0014 0.0009 0.001
Intercept 0.0013 0.0016 0.0007
Correlation coefficient (r) 0.9995 0.9997 0.9996
Limit of detection (µg l-1) 0.37 1.30 1.20
Limit of quantification (µg l-1) 1.23 4.30 4.0
Precision (RSD%, n = 9) 2.20 3.20 2.50
Preconcentration factor (PF) 100 100 100
Enrichment factor (EF) 14 11.30 11.10
Consumptive index (CI) 3.57 3.77 4.50
RESEARCH Published by the
Iranian Chemical Society
Table 4. Analytical Results for Recoveries and Precisions of the Target Analytes Cu2+, Mn2+ and Ni2+ Ions in Real Water Samples by the Proposed CPE Method (N = 3.0)
Cu2+ Mn2+ Ni2+
Intra-day (n = 5) Inter-day (n = 5) Intra-day (n = 5) Inter-day (n = 5) Intra-day (n = 5) Inter-day (n = 5)
Samples Added
(ng ml-1)
Found ± SD (µg l-1)
Recovery (%)a (RSD%)
Found ± SD (µg l-1)
Recovery (%)a (RSD%)
Found ± SD (µg l-1)
Recovery (%)a (RSD%)
Found ± SD (µg l-1)
Recovery (%)a (RSD%)
Found ± SD (µg l-1)
Recovery (%)a (RSD%)
Found ± SD (µg l-1)
Recovery (%)a (RSD%) Tap
water
0.0 2.40 ±
0.20
- 2.50 ±
0.30
< LOQ - 2.10 ±
0.20
< LOQ - < LOQ -
50 49.80 ±
1.0 95.0 (2.01) 50.40 ± 1.40 96.0 (2.78) 48.0 ± 0.50 96.0 (1.04) 50.50 ± 0.80 97.0 (1.58) 48.50 ± 0.70 97.0 (1.44) 47.50 ± 0.50 95.0 (1.05)
100 98.30 ±
2.0 96.0 (2.03) 99.40 ± 1.80 97.0 (1.81) 98.0 ± 1.20 98.0 (1.22) 98.02 ± 1.60 96.0 (1.63) 99.0 ± 1.10 99.0 (1.11) 98.0 ± 1.40 98.0 (1.43) Mineral water
0.0 < LOQ - < LOQ < LOQ - <
LOQ
- < LOQ - < LOQ -
50 48.50 ±
0.90 97.0 (1.86) 48.0 ± 1.20 96.0 (2.50) 48.0 ± 0.70 98.0 (1.46) 45.60 ± 1.0 95.0 (2.19) 47.50 ± 0.60 95.0 (1.26) 48.0 ± 0.90 96.0 (1.88)
100 95.0 ±
1.50 95.0 (1.58) 97.0 ± 1.90 97.0 (1.96) 96.0 ± 0.80 96.0 (0.83) 98.0 ± 1.80 98.0 (1.84) 97.0 ± 0.90 97.0 (0.93) 97.0 ± 1.90 97.0 (1.96) River water
0.0 5.80 ±
0.50
- 4.50 ±
0.50
- 6.0 ±
0.40
- 5.0 ±
0.70
- 7.50 ±
0.30
- 6.50 ±
0.40
-
50 53.57±
1.20 96.0 (2.24) 53.41± 1.0 98.0 (1.87) 55.50 ± 1.0 99.0 (1.80) 53.35 ± 1.30 97.0 (2.44) 56.35± 0.80 98.0 (1.42) 53.68± 1.20 95.0 (2.24)
100 100.50±
2.30 95.0 (2.29) 99.28± 2.10 95.0 (2.12) 102.80 ±1.50 97.0 (1.46) 104.0± 1.80 99.0 (1.73) 103.20± 1.30 96.0 (1.26) 104.37±1. 70 98.0 (1.63) Well water
0.0 < LOQ - < LOQ - < LOQ - <
LOQ
- 3.0 ±
0.50
- 4.0 ± 0.30 -
50 48.0 ±
0.80 96.0 (1.67) 47.50 ± 0.70 95.0 (1.47) 47.50 ± 0.60 95.0 (1.26) 48.0 ± 0.90 96.0 (1.88) 51.76 ± 0.70 98.0 (1.35) 52.38 ± 1.30 97.0 (2.48)
100 98.0 ±
1.60 98.0 (1.63) 96.0 ± 1.70 96.0 (1.77) 97.0 ± 1.20 97.0 (1.24) 97.0 ± 1.50 97.0 (1.55) 99.80 ± 1.0 97.0 (1.0) 99.84 ± 1.90 96.0 (1.90) Sea water
0.0 8.0 ±
0.40
- 9.0 ±
0.80
- 7.50 ±
0.50
- 8.0 ±
1.10
- 12.0 ±
0.80
- 10.0 ±
1.30
-
50 56.0 ±
0.70 97.0 (1.25) 56.60 ± 1.50 96.0 (2.65) 55.20 ± 0.70 96.0 (1.27) 56.84 ± 1.70 98.0 (2.99) 60.14 ± 1.30 97.0 (2.16) 57.60 ± 1.60 96.0 (2.78)
100 106.0 ±
1.80 98.0 (1.70) 105.7.0 ± 2.20 97.0 (2.08) 104.30 ± 1.10 97.0 (1.05) 102.60 ± 2.40 95.0 (2.34) 106.40 ± 1.70 95.0 (1.60) 107.80 ± 2.70 98.0 (2.50) a
Average of three determinations with 95% confidence level; < LOQ: Below limit of detection.
RESEARCH
Published by the
Iranian Chemical Society
three consecutive days, which were in the range of 1.25%-2.29%, 0.83-1.80% and 0.93%-2.16% and 1.47%-2.78%, 1.55-2.99% and 1.05-2.78% for Cu2+, Mn2+ and Ni2+ ions, respectively. These results indicate the suitability and satisfactory reproducibility of the proposed CPE method for the determination of the target analytes Cu2+, Mn2+ and Ni2+ ions in real water samples.
Accuracy of the Proposed Method
In order to validate the accuracy of the proposed method, Cu2+, Mn2+ and Ni2+ were determined in a certified reference material (SRM 1570a Spinach Leaves and SRM 1515 Apple Leaves). Results are given in Table 5. It was found that there is no significant difference between the results obtained by the proposed method and the certified results for all analytes. These results indicate the applicability of the developed procedure in Cu2+, Mn2+ and Ni2+ determination in real water samples free of
interference.
However, the statistical evaluation involving student's t-test revealed no significant difference between two values (found and certified) at the 95% confidence level where the calculated value of t (2.78) is less than the tabulated t-value (5.63) for five replicate measurements. Therefore, the method submitted in the present work provides a satisfactory accuracy level. Thus, the analytes concentration
in real samples can be analyzed using the proposed procedure.
Comparison of the Proposed Method with the
other Reported Methods
A comparison among the procedures reported in the literature regarding the preconcentration and determination of Cu2+, Mn2+ and Ni2+ in various samples and the proposed CPE method is shown in Table 1. The detection limits obtained, using the proposed CPE method, was better than most of the other reported CPE methods. Based on the results shown in Table 1, the preconcnetration factor of the proposed CPE method was higher than most of the other reported CPE methods. The relative standard deviation values were lower than all other reported CPE methods. Hence, the method developed here could be considered as a simple and novel method for the preconcentration and determination of Cu2+, Mn2+ and Ni2+ in water samples.
CONCLUSIONS
The proposed cloud point extraction was successfully applied for preconcentration and determination of trace amounts of Cu2+, Mn2+ and Ni2+ in water samples using ATDP as a complexing reagent and FAAS detection. This study allowed the development of a new, fast, easy to use, Table 5. The Analysis Results for CRM after Application of the Proposed CPE Methodology (N = 5.0)
SRM 1515 Apple leaves SRM 1570A spinach leaves
Analyte
Certified
value
(g g-1)
Found
(g g-1) a
Recovery
(%)
The calculated
Student’s t- and
F-values
Certified
value
(g g-1)
Found
(g g-1) a
Recovery
(%)
The calculated
Student’s t-
and F-values
Cu2+ 5.64 ±
0.24
5.47 ±
0.17
97.0 t (1.56)
F (1.99)
12.2 ±
0.6
11.7 ±
0.90
96.0 t (0.92)
F (2.25)
Mn2+ 54.0 ±
3.0
52.0 ±
2.40
96.0 t (1.65)
F (1.56)
75.9 ±
1.90
73.24 ±
1.20
96.50 t (2.15)
F (2.51)
Ni2+ 0.91 ±
0.12
< LODb - - 2.14 ±
0.15
2.08 ±
0.17
97.0 t (0.53)
F (1.28)
aMean ± standard deviation. bLOD: limit of detection. cThe tabulated values for t and F at 95% confidence limit are 2.78 and
sensitive, safe, and environmentally friendly methodology which could be an alternative for other separation or preconcentration techniques. The procedure is inexpensive, because it consists of many low equipment and running costs, such as FAAS which is available in most laboratories.
REFERNCES
[1] T.G. Kazi, R. Ansari, N. Jalbani, N. Kazi, M.B. Arain, M.K. Jamali, H.I. Afridi, A.Q. Shah, Biol. Trace Elem. Res. 127 (2009) 16.
[2] T.G. Kazi, H.I. Afridi, N. Kazi, M.K. Jamali, M.B. Arain, N. Jalbani, G.A. Kandhro, Biol. Trace. Elem. Res. 122 (2008) 1.
[3] A.A. Gouda, A.M. Summan, A.H. Amin, RSC Adv. 6 (2016) 94048.
[4] A.A. Gouda, Talanta 146 (2016) 435.
[5] S.S. Abd El-Hay, H. Aldawsari, A.A. Gouda, Curr. Anal. Chem. 14 (2018) 120.
[6] S.L.C. Ferreira, W.N.L. dos Santos, V.A. Lemos, Anal. Chim. Act. 445 (2001) 141.
[7] Ş.D. Zor, G. Alpdoğan, JOTCSA 3 (2016) 145. [8] J. Otero-Romaní, A. Moreda-Piñeiro, P.
Bermejo-Barrera, A. Martin-Esteban, Talanta 79 (2009) 723. [9] F. Shamsa, M.B. Tehrani, H. Mehravar, E.
Mohammadi, Iran. J. Pharm. Res. 12 (2013) 9. [10] T. Wen, F. Qu, N. Bing, L. Hong, Q. Luo, Arab. J.
Chem. 10(S2) (2017) S1680.
[11] B. Natesh Kumar, S. Kanchi, M.I. Sabela, K. Bisetty, N.V.V. Jyothi, Karbala Int. J. Modern Sci. 2 (2016) 239.
[12] R. Gürkan, Bull. Chem. Soc. Ethiop. 25 (2011) 333. [13] G. Woldemichael, T. Tulu, G.-U. Flechsig, Heliyon. 2
(2016) 1.
[14] S.Z. Mohammadi, T. Shamspur, Y.M. Baghelani, Arab. J. Chem. 2014, Article in Press.
[15] A.A. Gouda, Int. J. Environ. Anal. Chem. 94 (2014) 210.
[16] A.A. Gouda, S.M. Al Ghannam, Food Chem. 202 (2016) 409.
[17] S. Tokalioglu, V. Yilmaz, S. Kartal, Environ. Monit. Assess. 152 (2009) 369.
[18] R. Laus, A. dos Anjos, R.E.H.M.B. OsÛrio, A. Neves, M.C.M. Laranjeira, V.T. de, Pak, J. Anal. Environ.
Chem. 9 (2008) 58.
[19] U. Divrikli, A.A. Kartal, M. Soylak, L. Elci, J. Hazard. Mater. 145 (2007) 459.
[20] Z.A. Alothman, Y.E. Unsal, M. Habila, M. Tuzen, M. Soylak, Desalin. Water Treat. 53 (2015) 3457.
[21] J. Borkowska-Burnecka, M. Jakubiel, W. Zyrnicki, Chem. Analityczna. 53 (2008) 335.
[22] F. Shemirani, M.R. Jamali, R.R. Kozani, M.S. Niasari, Sep. Sci. Technol. 41 (2006) 3065.
[23] V.A. Lemos, M.S. Santos, G.T. David, M.V. Maciel, M.A. Bezerra, J. Hazard. Mater. 159 (2008) 245. [24] A.A. Gouda, Spectrochim. Acta A 131 (2014) 138 . [25] H.İ. Ulusoy, R. Gürkan, Ö. Yılmaz, J. Anal. Chem. 67
(2012) 131.
[26] H.İ. Ulusoy, Ö. Yılmaz, R. Gürkan, Food Chem. 139 (2013) 1008.
[27] C.B. Ojeda, F.S. Rojas, Microchim. Acta 177 (2012) 1.
[28] H. Xu, W. Zhang, X. Zhang, J. Wang, J. Wang, Procedia. Environ. Sci. 18 (2013) 258.
[29] N.N. Meeravali, S. Jai Kumar, Anal. Methods 4 (2012) 2435.
[30] E.L. Silva, P. dS. Roldan, M.F. Giné, J. Hazard. Mater. 171 (2009) 1133.
[31] M. Ghaedi, A. Shokrollahi, F. Ahmadi, H.R. Rajabi, M. Soylak, J. Hazard. Mater. 150 (2008) 533. [32] M.A. Farajzadeh, M.R. Fallahi, Anal. Sci. 22 (2006)
635.
[33] L. Zhao, S. Zhong, K. Fang, Z. Qian, J. Chen, J. Hazard. Mater. 239-240 (2012) 206.
[34] F.L.F. Silva, W.O. Matos, G.S. Lopes, Anal. Methods 7 (2015) 9844.
[35] A. Shokrollahi, S. Eslami, A.H. Kianfar, Chem. Sci. Trans. 1 (2012) 217.
[36] M. Ghaedi, A. Shokrollahi, K. Niknam, M. Soylak, Sep. Sci. Technol. 44 (2009) 773.
[37] M. Ghaedi, A. Shokrollahi, K. Niknam, E. Niknam, M. Soylak, Cent. Eur. J. Chem. 7 (2009) 148.
[38] C.A. Sahin, M. Efecinar, N. Satiroglu, J. Hazard. Mater. 176 (2010) 672.
[39] V.A. Lemos, M.S. Santos, G.T. David, M.A. Bezerra, J. Hazard. Mater. 159 (2008) 245.
[41] M. Ghaedi, K. Niknam, E. Niknam, M. Soylak, J. Chin. Chem. Soc. 56 (2009) 981.
[42] H.T.S. Britton, Hydrogen Ions, 4th ed., London: Chapman and Hall, 1952, p. 1168.
[43] H.A. Zadeha, E. Rahimpourb, S. Bahramzadeh, Anal. Bioanal. Chem. Res. 5 (2018) 229.
[44] S.M. Sorouraddin, M.A. Farajzadeh, S. Nouri, M.R. A. Moghaddam, Anal. Bioanal. Chem. Res. 4 (2017) 227.