Prediction and Parametric Optimization on
Mechanical Properties of Friction Stir
Welding Joints of AA 6061 and AA 2014 Using
Genetic Algorithm
P.Hema1, N.Raviteja2, K.Ravindranath3
Assistant Professor, Department of Mechanical Engineering, SVUEC, Tirupathi, AP, India1
P.G. Student, Department of Mechanical Engineering, SVUEC, Tirupathi, AP, India2
Retd. Professor, Ex-Principal, Department of Mechanical Engineering, SVUEC, Tirupati, A.P., India3
ABSTRACT:Friction Stir Welding is a solid state welding technique which heats metal to the temperature below re-crystallization. FSW avoids welding defects like porosity and hot cracking which are common in conventional welding techniques due to alloy’s low re-crystallization temperature and higher heat dissipating nature. It was invented in 1991 by the welding institute. This process combining (the metal is not melted) deformation heating and mechanical work to obtain high defect free joints. In the present study, dissimilar joints of AA6061 and AA2014 aluminum alloys were successfully made by friction stir welding technique. The microstructure and mechanical behaviour of the welded joints were investigated at different welding parameters. A mathematical model was developed to demonstrate a relationship between the friction stir welding parameters and the mechanical properties of the dissimilar joints. The microstructures of various regions were observed and analyzed by means of optical microscopy. The design of experiment has been done with RSM with 15 numbers of experiments and prediction is done through ANOVA. Using ANOVA, the significance of welding parameters on mechanical properties of welded dissimilar joints is determined. And also by using GENETIC ALGORITHM the optimal process parameters of welded joints are determined.
KEYWORDS: Anova, Axial Force (AF), Genetic Algorithm, Tool Rotation Speed (TRS), Welding Speed (WS).
I. INTRODUCTION
A319.Using Anova and Signal to noise ratio of robust design, effect on tensile strength of FSW process parameters is evaluated and optimum welding condition for maximizing tensile strength is determined[4].The authors also developed empirical relationships to predict the grain size and hardness of the weld nugget of the friction stir welded AA7075-T6 Aluminum alloy joints. Six factors, Five levels, central composite, rotatable design matrix is used for optimization of the experimental conditions. The empirical relationships are developed by response surface methodology incorporating tool and process parameters. A linear regression relationship is also established between grain size and hardness of the weld nugget of friction stir welded joints. The welded nugget grain size is related with hardness of the joint. The developed relationships are effectively used to predict the weld nugget grain size of the joint non-destructively by measuring the weld nugget hardness [5]. Investigated joining of two dissimilar aluminum alloys AA2014 and AA6061 using friction stir welding. The experiments were conducted on vertical end milling machine. The FSW has been conducted at range of 760-2000rpm by determining their mechanical properties with 15 no of experiments which is designed in RSM[6].This is followed by the conduct of ANOVA ensuring the statistical significance of the process parameters[7].Then non-traditional optimization technique namely GENETIC ALGORITHM (GA) has been used to derive the optimized process parameters of this welding technique.Thus after conducting all the experiment the testing is done and the optimization is done through using MATLAB 17 [8].
II. EXPERIMENTAL PROCEDURE
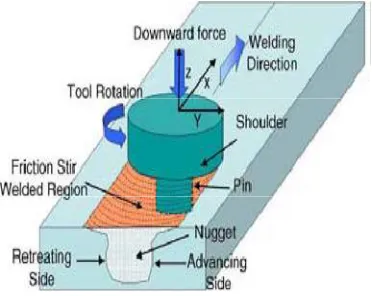
Friction stir welding is a process that produces a weld joint between two work pieces by heating, friction and plastic deformation caused by rapidly rotating tool that traverse the weld joint. A general tool is designed in the tapered type with a pin of diameter smaller than the shoulder. The pin is shorter than the thickness of the plates and its diameter is normally slightly larger than the thickness of the plates. The experiment is designed by using MINITAB 17 software tool in which the RSM technique is used for it. Based on the RSM, 15 numbers of experiments were designed.
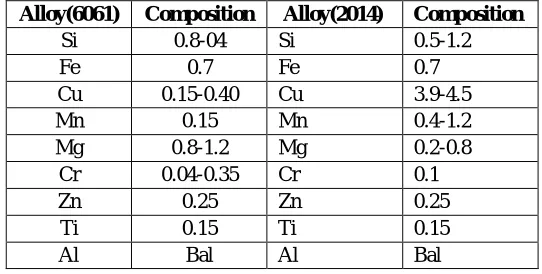
The rolled sheets of AA6061 and AA2014 alloys were applied as base materials, and their chemical compositions are presented in Table 1.The axis of the tool shoulder and pin is co-axial with the axis of rotation. The work piece used are AA2014 &AA6061 and the size of the work piece is 150*75*6 for normal welding & 150*50*6(l*b*t) for I-section and the tool used is Tungsten Carbide tool with Taper pin Profile.
Figure 1: Schematic Diagram of Friction Stir Welding With a Rotating Tool
FSW TOOL PROFILE
Fig 2. Tapered Pin profile
Table 1. Specified chemical composition of alloy AA 6061 (wt %) and AA2014(wt%)
Alloy(6061) Composition Alloy(2014) Composition
Si 0.8-04 Si 0.5-1.2
Fe 0.7 Fe 0.7
Cu 0.15-0.40 Cu 3.9-4.5
Mn 0.15 Mn 0.4-1.2
Mg 0.8-1.2 Mg 0.2-0.8
Cr 0.04-0.35 Cr 0.1
Zn 0.25 Zn 0.25
Ti 0.15 Ti 0.15
Al Bal Al Bal
III. RESULTS AND DISCUSSIONS
FSW technique is employed on 6061 and 2014 Aluminum alloys and tested using different parameters Tool Rotation Speed (N), Welding Speed(S), Axial Force (F).Genetic Algorithm (GA) is employed to optimize the Tensile strength, Impact strength and Hardness of the AA6061&2014 material for Friction Stir Welding. The results and discussion of the above performed Welding Technique. Tables are presented for responses using ANOVA calculations and GA
results.
III.A. STATSTICAL ANALYSIS AND DEVELOPMENT OF MODEL
€To predict the tensile, impact strengths and hardness, Analysis of variance (ANOVA) technique is applied to find out the significance of the parameters for validation. The percentage of contribution of tool rotational speed (N), welding speed (S), and axial force (F) on tensile strength, impact strength and hardness were studied and analyzed by using ANOVA technique.
PROCESS PARAMETERS (FACTORS) AND THEIR LEVELS
Below tables shows the process parameters and their design levels. These values are considered for carrying the project work, such as Tool Rotational Speed (N), Welding Speed(S) and Axial Force (F).
Table 2 . Process Parameters and their design levels using in FSW Technique
Process parameters Range Level 1 Level 2 Level 3
Tool Rotational
Speed (N), rpm 760- 2000 760 1380 2000
Welding Speed(S),
mm/min 11 – 37 11 24 37
Table3. Experimental Values For Tensile & Impact Strength &Hardness
S. No
Tool Rotational Speed (N) in
rpm Welding Speed (S) in mm/min Axial Force (F) in KN Tensile Strength
(TS) in MPa
Impact Strength
(IS) in KN/mm2
Hardness (BHN)
1 760 11 0.50 92.46 3.68 71
2 760 24 0.50 101.62 3.27 72
3 760 37 0.75 112.45 3.41 75
4 760 11 1.0 95.79 2.93 73
5 760 37 1.0 114.12 4.02 75
6 1380 11 0.75 121.61 2.83 85
7 1380 37 0.50 127.44 3.86 78
8 1380 24 0.75 124.12 3.57 84
9 1380 24 0.50 123.28 4.59 79
10 1380 37 1.0 131.61 3.61 77
11 2000 24 0.50 126.61 4.63 74
12 2000 11 0.75 118.86 3.39 82
13 2000 37 0.75 130.78 3.96 80
14 2000 11 1.0 125.73 4.35 83
15 2000 24 1.0 132.91 4.33 81
Table4. ANOVA Results for Tensile Strength
Fig.3. Main Effects plot for Tensile Strength
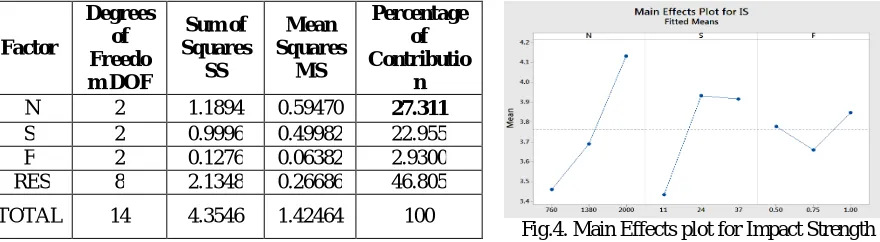
Table 5.ANOVA Results for Impact Strength
Fig.4. Main Effects plot for Impact Strength
Factor Degrees of Freedom DOF Sum of Squares SS Mean Squares MS Percentage of Contribution
N 2 1644.37 822.19 70.6645
S 2 356.64 178.32 15.3274
F 2 75.92 37.96 3.2628
RES 8 81.77 10.22 3.5141
TOTAL 14 2326.83 1048.69 100
Factor Degrees of Freedo m DOF Sum of Squares SS Mean Squares MS Percentage of Contributio n
N 2 1.1894 0.59470 27.311
S 2 0.9996 0.49982 22.955
F 2 0.1276 0.06382 2.9300
RES 8 2.1348 0.26686 46.805
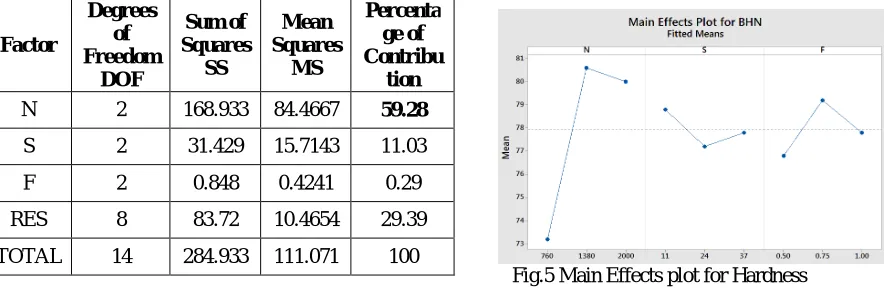
Table 6.ANOVA Results for Hardness
Fig.5 Main Effects plot for Hardness
The above tables and figures are showing that the results and main effect plots for mechanical properties of dissimilar joints of AA6061 and AA2014 using Tapered pin profile. From the Table4, The % Contribution of values for Tool Rotational Speed (70.6645), Welding Speed (15.3274) and Axial Force (3.2628). It is observed that the Tool Rotational Speed have great influence on Tensile Strength. Since this analysis is a parameter based design, from the above values it is clear that Tool Rotational Speed is the Major Factor to be selected effectively to get the good Tensile Strength., From the Table 5, The % Contribution of values for Tool Rotational Speed (27.311), Welding Speed (22.955) and Axial Force (2.9300). It is observed that the Tool Rotational Speed have great influence on Impact Strength. Since this analysis is a parameter based design, from the above values it is clear that Tool Rotational Speed is the Major Factor to be selected effectively to get the good Impact Strength From the Table 6, The % Contribution of values for Tool Rotational Speed (59.28), Welding Speed (11.03) and Axial Force (0.29).It is observed that the Tool Rotational Speed have great influence on Hardness. Since this analysis is a parameter based design, from the above values it is clear that Tool Rotational Speed is the Major Factor to be selected effectively to get the good Hardness.
III.B. ESTIMATION OF OPTIMUM PROCESS PARAMETERS FOR TENSILE, IMPACT STRENGTH AND HARDNESS
The present work is aimed to identify the most influencing significant parameters and percentage contribution of each parameter on responses of FSW joints by conducting minimum number of experiments using ANOVA. Based on the highest values of the Mean Levels for the significant factors N, S and F the overall optimum condition thus obtained were N3, S3 and F2.
The optimum value of Tensile Strength is predicted at the significant levels of Process Parameters. The estimated mean of the response characteristics can be computed as Tensile Strength,
(TS) = N3+S3+F2-2TS --- Equation.
Substituting the values of various terms in the above equation then,
Tensile strength, TS = 152.16 + 152.24 + 157.69 – (2*146.89) = 132.78 MPa [Ref.9]
In the same way for the optimum process parameters for Impact Strength the overall optimum condition is obtained at
N3, S2 and F3.
The estimated mean of the response characteristics can be computed as Impact Strength, (IS) = N3+S2+F3-2IS--- Equation.
Substituting the values of various terms in the above equation then,
Impact strength IS = 4.132 + 3.934+3.843 – (2*3.843) = 4.385 MPa [Ref.9]
Similarly the optimum process parameter for Hardness the overall optimum condition is obtained at N2, S1 and F2.
(BHN) = N2+S1+F2-2HV --- Equation.
The estimated mean of the response characteristics can be computed as Hardness,
Factor
Degrees of Freedom
DOF
Sum of Squares
SS
Mean Squares
MS
Percenta ge of Contribu
tion
N 2 168.933 84.4667 59.28
S 2 31.429 15.7143 11.03
F 2 0.848 0.4241 0.29
RES 8 83.72 10.4654 29.39
III.C. GENETIC ALGORITHM
The GA was used to minimize the objective or fitness function. But it can also be used to maximize the fitness function (f(x)) by minimizing (f(x)) because the point at which the minimum of (f(x)) occurred was the same as the point at which the maximum of (f(x)) occurred. In this article, this technique was used to maximize the tensile strength, impact strength and hardness (UTS) functions. The optimization of process parameters is made using Genetic Algorithm. The optimization technique was performed using MATLAB. The inputs to be given in MATLAB are ranges of variables, no of iterations to be performed and objective function.
GAs are a particular class of evolutionary algorithms. The techniques common to all GAs are: –Inheritance
–Mutation –Selection
–Crossover (also called recombination)
REGRESSION EQUATIONS: A multi response regression equations were generated using MINITAB 17 Software for each set of experiments. These equations resemble the objective function used in GA optimization. Since to get the better tensile strength, impact strength and hardness value, the input parameters has to be maximized. Therefore these equations should be maximized to find optimum parameters. The equations are mentioned below.
For tensile strength:
fn=(0.02004*t+0.572*w+6.53*a+72.34); [1] For impact strength:
fn=(0.000592*t+0.0157*w-0.463*a+2.914); [2] For hardness:
fn=(00.00520*t+0.0444*w+4.71*a+63.29); [3]
These three equations are maximized and the optimum values are obtained.
(a)
(b) (c)
Fig.6. (a,b,c): Optimum Results of tensile strength, impact strength and hardness
Table7: Optimum Results
S. No Tool Rotational Speed(N) in rpm Welding Speed(S ) in mm/min Axial Force (F) in KN Tensile Strengt h (TS) in MPa Impact Strengt h (IS) in KN/mm
2
Hardness (HV)
1 760 11 0.50 97.124
2 760 24 0.50 3.0736
3 760 37 0.75 70.0854
0 10 20 30 40 50 60 70 80 90 100 95 100 105 110 115 120 Generation F it n e s s v a lu e
Best: 97.1274 Mean: 97.1275
Best f itness Mean fitness
0 10 20 30 40 50 60 70 80 90 100 3 3.1 3.2 3.3 3.4 3.5 3.6 3.7 3.8 Generation F it n e s s v a lu e
Best: 3.0736 Mean: 3.0736
Best fitness Mean fitness
0 10 20 30 40 50 60 70 80 90 100 70 70.5 71 71.5 72 72.5 73 73.5 74 74.5 75 Generation F it n e s s v a lu e
Best: 70.0854 Mean: 70.0855
III.D MICRO STRUCTURAL ANALYSIS
Samples of the weld metals are cut to the required sizes and polished using different grades of emery papers, final polishing is done using alumina paste in the disc polishing machine and the polished specimens are etched with the Keller’s reagent:150ml H2O,3ml HNO3,6ml HCL and HF.Microstructure analysis was carried out using a light optical Microscope (Make: NIKON-LV 150) incorporated with an image analysing software (MSQ).The microstructure of welded joints was evaluated by measuring size distribution in weld nugget(WN),thermo mechanically affected zone(TMAZ) and heat affected zone(HAZ).The results are given below.Figure.8 shows the microstructure of the welded joint for the following parameters
1. Tool rotational speed (N) rpm -1380 2. Welding speed(S) mm/min-24 3. Axial force (F) kn-0.75
Fig.7 Optical Micro Structure using Tapered Pin Profile
In unaffected base metal zone [A], there is no change in neither property nor micro structure. This is the area which is far away from the weld zone unaffected by the heat or deformation. In heat affected zone [B], material is influenced by heat (thermal cycle) and leads to micro structural changes. Heat in this zone does not induce any plastic deformation. TMAZ [C] is a transition zone which is unique in FSW. During welding, this region experiences both temperature and deformation, which are not sufficient to induce the recrystalisation in the material. The portion where the actual stirring takes place which leads to micro structural Changes and experienced the high strain is usually referred as Dynamically Recrystallized Zone (DXZ) or nugget zone [D]. The high temperature and severe plastic deformation during welding in the stirred zone results in a new equiaxed fine grain structure.
smaller the TMAZ, because in this zone the tool material will be plastically deformed. The grain size will be lowest in Weld Nugget Zone. It is fully Recrystalized area. And the tool pin is fully occupied the zone.
IV.CONCLUSIONS
Weld joints of AA6061 and AA2014 obtained at tool rotation speed 2000rpm, welding speed 24mm/min, and axial
force 1kn exhibits maximum TENSILE STRENGTH than the joints at other process parameters.
Weld joints of AA6061 and AA2014 obtained at tool rotation speed 2000rpm, welding speed 24mm/min, and axial
force 1KN exhibits maximum IMPACT STRENGTH than the joints at other process parameters.
Weld joints of AA6061 and AA2014 obtained at tool rotation speed 1380rpm, welding speed 11mm/min, and axial
force 0.75KN exhibits maximum HARDNESS than the joints at other process parameters.
From ANOVA results it can be concluded that the Tool Rotational Speed and Axial Welding Speed are the dominant parameters that have influence on the mechanical properties than the Welding Speed acting on the joints.
Genetic Algorithm has been made on single variable and multi response. The analysis shows that the response from algorithm is good and fast.. The tensile, impact strengths and hardness is good at the optimum values. In most of the joints the weld nugget (WN) consists of fine equiaxed grains when compared with thermo mechanically affected zone (TMAZ) and heat affected zone (HAZ).The structure at the nugget is fine and equiaxed with grain size significantly smaller than the parent material grain due to the higher temperature and extensive plastic deformation.
ACKNOWLEDGEMENTS
I would like to thank Sri. S. Venkata Krishna, Asst. Director, CITD (Central Institute Of Tool Design), Vijayawada
for providing Semi-automated Vertical Milling Machine (V 31), Sri. C. Jeyachandran, Ms. Bindu Tools Pvt. Ltd,
Tirupati, for the fabrication of Tool and Prof,K.C.Varaprasad Dept. Of Mechanical engg, Sri
Vidyanikethan,Tirupathi for their co-operation in conducting Microstructure analysis
REFERENCES
1. Neeraj kumar, Ishu Monga, Manoj kumar“An Experimental Investigation To Find Out The Effect Of Different Pin Profile Tools On Aa 6061
2. T6 And Aa 2014 T4 With Friction Stir Welding”.
3. A.Suresh Babu, C.Devanathan ‘An Overview Of Friction Stir Welding’.
4. Krishnan K.N(2002) on the formation of onion rings in friction stir welds,Material Science and Engineering ,Vol.327,pp(246-251)
5. Hema pothur,Gangadhar S.M. and Ravindranath.K (2012) “Influence of Friction Stir welding Parameters on the Micro Structural and
Mechanical Properties of Aliminum Alloy 6061’’,.International Journal of Applied Engineering Research.Vol 7,no.8(2012) PP.(907-916)
6. Er. Jagjeet Singh Chatha ‘Reviews On The Effects Of Friction Stir Welding Parameters On Mechanical Properties Of Dissimilar Metal Weld
Joints’.
7. P Jagadeesh Chandra Prasad1*, P Hema2 and K Ravindranath3- “Optimization Of Process Parameters For Friction Stir Welding Of Aluminum
Alloy Aa6061 Using Square Pin Profile”
8. Vardhaman S Mudakappanavar H M Nanjundaswamy ‘Multi-Objective Optimization Of Process Parameters During Solidification Of
Hypoeutectic Al-Si Alloy Casting Using Genetic Algorithm’.
9. Hema pothur., Prabhu, K.A., Ravindranath,K.(jan 2012)”Optimisation of Process Parameters for Gas tungsten arc welding of Aluminum Alloy