60
_______________________________________________________________
_______________________________________________________________
FORMULATION AND EVALUATION OF CONTROLLED RELEASE
FLOATING MATRIX TABLETS OF THEOPHYLLINE
Sirisha P*, Sreekanth Reddy CP, Umasankar K, Jayachandra Reddy P
Department of Pharmaceutics,
Krishna Teja Pharmacy College, Chadalawada Nagar, Tirupati-517506, Andhra Pradesh, India.
ABSTRACT
Bioadhesive drug delivery systems (BDDS) are used as a delivery device within the lumen toenhance drug absorption in a site specific manner. This approach involves the use of bioadhesivepolymers, which can adhere to the epithelial surface in the stomach. Gastric mucoadhesiondoes not tend to be strong enough to impart to dosage forms the ability to resist the strong propulsion forces of the stomach wall. The continuous production of mucous by the gastric mucosa to replace the mucous that is lost through peristaltic contractions and the dilution of the stomach content also seem to limit the potential of mucoadhesion as a gastroretentive force. Melt granulation is processes by which granules are obtained through the addition of either a molten binder or a solid binder which melts during the process. This process is also called melt agglomeration and thermoplastic granulation. Gastroretentive drug delivery is an approach to prolong gastric residence time, thereby targeting site-specific drug release in the upper gastrointestinal tract (GIT) for local orsystemic effects. Gastroretentive dosage forms can remain in the gastric region for longperiods and hence significantly prolong the gastric retention time (GRT) of drugs.
Key words: Formulation and Evaluation, Floating Matrix Tablets, Theophylline.
INTRODUCTION
Gastro retentive dosage forms have become popular drug delivery systems in the field of site specific orally administrated controlled release drug delivery systems [1]. Floating drug delivery system promises to be a potential approach for gastric retention. A controlled release floating Theophylline formulation may be desired for a number of reasons, such as improving the bioavailability and to minimize the side effects of the drug and to prevent the development of drug resistance therefore to improve patient compliance [2].
Theophylline
Theophylline was chosen as model drug in the study. Theophylline is methylated xanthine, which found naturally in tea and coffee.
Chemical form: 3,7-dihydro-1,3 dimethyl purine-2,6(1H)-dione;1,3-dimethyl xanthine
Appearance: A White crystalline powder
Molecular weight: 180.2 gm/mol
Melting point: between 2700&2740
PKa: 8.77
Structure of Theophylline
Solubility: Slightly soluble in water, more soluble in hot water, sparingly soluble in chloroform & ether, freely soluble in solutions of alkali hydrous & in ammonia
Category: Asthmatic drug
Description: Theophylline has been used to treat airway diseases for over 70 years. It was originally used as a bronchodilator.
Mechanism of action: The main mechanism of action of TPH is the non-specific adenosine receptor antagonism [3]. Antagonizing A1,A2, and A3 receptors almost equally, which explains many of its cardiac effects and some of its asthmatic effects. Another proposed mechanism of action includes a non-specific inhibition of phospho-diesterase enzymes, producing an increase in intracellular cyclic AMP.
*Corresponding Author Sirisha P E mail: [email protected]
International Journal
of
Pharmacy Review & Research
www.ijprr.com
61 Hydroxy Propyl Methyl Cellulose (HPMCK100M)
Non proprietary Names: BP: Hypromellose
phEur: Hypromellosum
USP: Hypromellose
Synonym:Benecel MHPC, Cellulose, hydroxyl propyl methyl ether, Methocel, Methyl cellulose propylene glycol ether, Methyl hydroxyl propyl cellulose, Metolose, pharmacoat, HPMC.
Empirical formula: C12H20O10 Molecular weight: 324.2848
Chemical structure:
Hydroxy propyl methyl cellulose is mixed alkyl hydroxyl alkyl cellulose ether and may be regarded as the propylene glycol ether of methyl cellulose.
Grades: E6, E15, E50, E4M, F50, F4M, K4M, 15M, K100 M
Functional category
Coating agent, film former, rate-controlling polymer for sustained release, stabilizing agent, suspending agent, tablet binder, viscosity-increasing agent.
Carbopol 971P
Nonproprietary Names USP-NF: Carbomer
Synonyms
Acrypol, Acritamer, Acrylic acid polymer, Carbomera; Carbopol; Carboxy polymethylene; Polyacrylic acid; Carboxyvinyl polymer; Pemulen; Tego Carbomer.
Chemical Name and CAS Registry Number
Carbomer (9003-01-4)
Empirical formula and Molecular weight
Carbomers are synthetic high-molecular-weight polymers of acrylic acid that are crosslinked with either allyl sucrose or allyl ethers of pentaerythritol. They contain between 52% and 68% of carboxylic acid (COOH) groups calculated on the dry basis.
The molecular weight of carbomers theoretically estimated at 7X10⁵ to 4 X 10⁹
Structural formula
Functional Category
Bioadhesive material; controlled-release agent; emulsifying agent; emulsion stabilizer; rheology modifier, stabilizing agent; suspending agent; tablet binder.
Applications in Pharmaceutical Formulation and Technology
Carbomers are used in liquid or semisolid pharmaceutical formulations as rheology modifiers. Formulations include creams, gels, lotions and ointments for use in ophthalmic, rectal, topical and vaginal preparations.
Gelucire 50/13
Non-proprietary Names:
Stearoylmacrogol 32 glycerides: EP Stearoylpolyoxyl 32 glycerides: NF
CAS Registry Number:
[9011-21-6]
Description:
Pale yellow waxy solid with light odour and faint odour
Chemical Structure:
Melting Point: 44-500C
Solubility: Dispersible in warm water and in warm liquid paraffin, freely soluble in methylene chloride. Soluble in warm ethanol.
Stability and Storage
It is to be stored in a tightly sealed container, protected from light and moisture. During storage at high temperature (> 350C), there is a risk of pellet agglomeration.
Applications in Pharmaceutical Formulation or Technology
It is used as a dispersible surfactant for self-emulsifying formulations. As an adjuvant in modified-release matrix systems and it is used as an excipient in formulations for solubility and bioavailability enhancement.
Polyethylene Glycol (PEG) 6000 Synonyms:
Carbowax; Carbowax Sentry; Lipoxol; Lutrol E; Macrogola; PEG; Pluriol E; Polyethylene glycol.
Chemical Name and Registry Number:
62 Chemical Structure
Functional Category: Ointment base, plasticizer, solvent, suppository base, tablet and capsule lubricant, binder.
Description: It is a white or off-white colored solid available as free flowing milled powders. It has a faint, sweet odor. It is a solid at ambient temperature and melts at relatively higher temperatures.
Solubility: Soluble in water, acetone, dichloromethane, ethanol (95%), and methanol; slightly soluble in aliphatic hydrocarbons and ether and insoluble in fats, fixed oils, and mineral oil.
Melting Point: 55-630C
Stability and Storage
Polyethylene glycols are chemically stable in air and in solution, do not support microbial growth, and they do not become rancid. Polyethylene glycols should be stored in well-closed containers in a cool, dry place.
Applications in Pharmaceutical Formulation or Technology
It is used as a biodegradable polymeric matrixing agent, used in controlled-release systems. It is widely used in formulations of topical ointments and as suppository bases and also as lubricant.
Sodium Bicarbonate Non-proprietary Names:
Sodium bicarbonate-BP, USPNF, JP
Synonyms:
Baking soda, E500, monosodium carbonate, sodium acid carbonate, sodium hydrogen carbonate.
Chemical Name and CAS Registry Number:
Carbonate acid monosodium salt [144-55-8]
Empirical formula and Molecular weight:
NaHCO3, 84.01
Functional Category: Alkalising agent, therapeutic agent
Applications in Pharmaceutical Formulations or Technology
Sodium bicarbonate is generally used in pharmaceutical formulations as a source of CO2 in
effervescent tablets and granules. It is also widely used to produce or maintain alkaline pH in a preparation.
Dicalcium Phosphate
Chemical Name and CAS Registry Number:
Dibasic calcium phosphate dehydrate; [7789-77-7]
Chemical structure:
Synonyms:
Calcihydrogenophosphasdihydricus; calcium hydrogen orthophosphate dihydrate; calcium monohydrogen
phosphate dihydrate; Di-Cafes‟; dicalcium orthophosphate; DI-TAB; Emcompress; phosphoric acid calcium salt (1:1) dihydrate; secondary calcium phosphate.
Description
Dibasic calcium phosphate dihydrate is a white, odourless, tasteless powder or crystalline solid. It occurs as monoclinic crystals.
Functional Category: Tablet and capsule diluents
Solubility: Practically insoluble in ethanol, ether, and water; soluble in dilute acids.
Stability and Storage conditions
Dibasic calcium phosphate dihydrate is a non-hygroscopic, relatively safe material. However , under certain conditions the dihydrate can lose water of crystallization. Hence the bulk material should be stored in a well-closed container in a cool, dry place.
Applications in Pharmaceutical Formulation or Technology:
Dibasic calcium phosphate dihydrate is widely used in tablet formulation both as an excipient and as a source of calcium and phosphorus in nutritional supplements.
Magnesium Stearate Synonyms:
Dibasic maganesium stearate; magnesium distearate; magnesia stearas; maganesium octadecanoate; octadecanoic acid, magnesium salt; stearic acid, magnesium salt; Synpro 90.
Chemical Name and CAS Registry Number:
Octadecanoic acid magnesium salt; [557-04-0]
Description
Magnesium stearate is a very fine, light white, precipitated or milled, impalpable powder of low bulk density, having a faint odour of stearic acid and a characteristic taste. The powder is greasy to the touch and readily adheres to the skin.
Functional Category: Tablet and capsule lubricant
Solubility
Practically insoluble in ethanol, ethanol(95%), ether and water slightly soluble in warm benzene and warm ethanol(95%).
Stability and Storage conditions
Magnesium stearate is stable and should be stored in a well-closed container in a cool, dry place.
Applications in Pharmaceutical Formulation or Technology:
Magnesium stearate is widely used in cosmetics, foods, and pharmaceutical formulations. It is primarily used as a lubricant in capsule and tablet manufacture at concentrations between 0.25% and 5.0%. It is also used in barrier creams.
TALC Synonyms
63
Magsil Star; Powdered talc; purified French chalk; Purtalc; soapstone; steatite; Superiore; talcum.
Chemical Name and CAS Registry Number:
Talc; [14807-96-6]
Description
Talc is a very fine, white to greyish-white, odourless, impalpable, unctuous, crystalline powder. It adheres readily to the skin and is soft to the touch and free from grittiness.
Functional Category: Anticaking agent, glidant; tablet and capsule diluents; tablet and capsule lubricant.
Solubility: Practically insoluble in dilute acids and alkalis, organic solvents, and water
Stability and Storage conditions
Talc is a stable material and may be sterilized by heating at 160ºC for not less than 1 hour. It may also be sterilized by exposure to ethylene oxide or gamma irradiation. Talc should be stored in a well-closed container in a cool, dry place.
Applications in Pharmaceutical Formulation or Technology
Talc is used as a glidant, tablet lubricant and is also used as a tablet and capsule diluents. Talc is additionally used to clarify liquids and is also used in cosmetics and food products, mainly for its lubricant properties.
MATERIALS AND METHODS
Analytical method for the estimation of theophylline
A few analytical methods such as HPLC, UV/VIS spectrophotometric methods were reported for the estimation of Theophylline.
Method used in the present work
An UV/VIS spectrophotometric method was used for the estimation Theophylline. A stock solution of Theophylline was prepared in distilled water and the absorbance of theophylline was measured at 273nm using Elico UV-VIS spectrophotometer SL 150.As the dissolution studies were carried out in 0.1N HCl buffer, the calibration curve was constructed in this media.
Preparation of Stock solution
10 mg of Theophylline was accurately weighed and transferred in to a 10ml volumetric flask.The drug was dissolved initially in few ml of distilled water and later made volume to produce mg/ml solution.
For the estimation of Theophylline, the stock solution was subsequently diluted with distilled water to get a series of dilutions containing 2,4,6,8,10 µg/ml of solution and measured the absorbance at 273nm(UV-VIS spectrophotometer,SL-150,Elico) against same dilution as blank. The absorbances relating to different concentrations of theophylline.
Drug Excipient Compatibility Studies
Fourier Transform Infrared spectroscopy (FT-IR)
Samples were analyzed using an ATR-FTIR spectrometer (Bruker, Germany). FTIR spectra were
measured over the wave number range of 4000-500 cm-1 at a resolution of 1.0 cm-1. The powder or film sample is simply placed onto the ATR crystal and the sample spectrum is collected. The sample is then cleaned from the crystal surface and the accessory is ready to collect additional spectra. ATR analysis is less complicated than using KBr pellets, it is fast and a very small amount of the sample is needed.
Preformulation Studies Angle of Repose:
The angle of repose has been used to characterize the flow properties of solids. Angle of repose is a characteristic related to inter particulate friction or resistance to movement between particles. This is the maximum angle possible between surface of pile of powder or granules and horizontal plane [4].
The angle of repose was determined by funnel method suggested by Newman. Angle of repose is determined by following formula:
Where, θ = angle of repose, h = height of the cone,
A funnel was fixed at a height of approximately of 2-4 cm over the platform. The sample was slowly passed along the wall of funnel, till the cone of the powder formed. Angle of repose was determined by measuring the height of the cone of powder and radius of the heap of the powder.
Bulk density (Db)
It is the ratio of total mass of powder to the bulk volume of powder [5]. It was measured by pouring the weighed powder into a measuring cylinder and the volume was noted. It is expressed in gm/mL and is given by
Dt= M/V0
Where, M is the mass of powderV0 is the Bulk volume
of the powder.
Tapped density (Dt)
Tapped density was determined by using graduated cylinder. An accurately weighed sample was carefully added to the graduated cylinder with the aid of funnel. The initial volume was noted and the sample was tapped on a horizontal base. Tapping was continued until no further reduction in sample volume was observed. Volume was noted and tapped density is calculated by using the following formula [6].
Dt= M/V0
Where, M is the mass of powder V0 is the Bulk volume
of the powder.
Carr’s Index (I)
It indicates the ease with which a material can be induced to flow and powder compressibility. It is expressed in percentage and is given by
I= (Dt-Db/Dt × 100
Where, Dt is the tapped density of the powder
64 Compressibility Index and Hausner’s ratio (H)
In recent years the compressibility index and the closely related Hausner‟s ratio [7] have become the simple, fast, and popular methods of predicting powder flow characteristics. The compressibility index has been proposed as an indirect measure of the bulk density, size, shape, surface area, moisture content and cohesiveness of the materials. Both the compressibility index and the Hausner‟s ratio were determined by using bulk density and the tapped density of the powder.
Compressibility Index = (1-V/V0) ×100
Where,
V = volume of powder blend before tap V0 = volume of powder blend after 100 tappings.
Hausner‟s ratio (H) is a number that is correlated to the flow ability of a powder. The Hausner‟s ratio is related to the Carr‟s Index by the formula
H = 100/ (100-C)
Hausner‟s ratio also expressed as,
H = Dt / Db (or)
Hausner’s ratio = tapped density/ bulk density
Post Compression Parameters Evaluation Hardness
Six tablets from each batch were selected and hardness was measured using Monsanto hardness tester (M/s Campbell Electronics, MODEL EIC-65 India).
Friability (%F)
Ten tablets from each batch were selected randomly and weighed. These pre weighed tablets were subjected to friability testing using Roche friabilator (M/s Campbell Electronics India) for 100 revolutions. The tablet to combined effect of abrasion and shock in a plastic chamber revolving at 25 rpm and dropping a tablet height of 6 inches in each revolution. Tablets were removed, de-dusted and weighed again [8]. Following formula was used to calculate the friability.
%F = 1-(loss in weight/initial weight)* 100
Weight variation
Weight variation was calculated as per method described in USP 20 tablets were weighed individually and the average weight is calculated. The requirements are met if the weights of not more than 2 of tablets differ by more than the percentage listed in table and no tablets differ in weight than double that percentage [9].
Drug content
Five tablets were weighed and powdered in a mortar. Accurately weighed tablet powder samples equivalent to 20mg of Theophylline was transferred to a 100ml volumetric flask, and the Theophylline was extracted into 75mL distilled water. This solution was filtered and collected in to a 100mL volumetric flask and made up to the volume with methanol. The solution was suitably diluted with distilled water and the absorbance was measured at 273 nm. The estimations were carried out in triplicate and the results are reported.
Preparation of Theophylline Controlled release Floating Matrix Tablets
In the present investigation, Controlled release tablets of Theophylline were prepared by using two techniques melt granulation technique and direct compression using meltable binders and swellable polymers.
Preparation of tablets by Melt granulation technique
Theophylline controlled release matrix tablets were prepared by melt granulation method, as per the formulae. Accurately weighed binder was melted in a porcelain dish on a heating metal, and then accurate quantity of Theophylline, Carbopol971P and di calcium phosphate were taken, mixed thoroughly and was added to the melted mass of binder and stirred well to mix. Then mass was removed from the hot plate and subjected to scrapping until it attained room temperature. The coherent mass was passed through sieve # 22, and the resulting granules were resifted over sieve # 40 to separate granules and fines. The granules were collected and mixed with talc and magnesium stearate. The lubricated blend was compressed using 8mm round flat punch on a single punch tablet machine. Compression was adjusted to obtain tablets with hardness in the range of 4-6 kg/cm2.
Preparation of tablets by direct compression method
Theophylline controlled release tablets were prepared by direct compression method as per the formulae. Accurately weighed polymer mixed with the drug in geometrical dilutions. Then accurately weighed quantities of di calcium phosphate, talc, and magnesium stearate were added to the above drug polymer mixture. The lubricated blend was compressed using 10mm round flat punch on a single punch tablet machine (Cadmach, India) Compression was adjusted to obtain tablets with hardness in the range of 4-6 kg/cm2.
In-vitro dissolution studies
The tablet samples were subjected to in-vitro
dissolution studies using USP type II dissolution apparatus at 37± 0.5ᵒC and 50 rpm speed. To mimic the Gastrointestinal conditions, as per the official recommendation of USFDA, 900 ml of 0.1 N HCL was used in dissolution medium. Aliquot equal to 5mL was withdrawn at specific time intervals and replaced with fresh buffer. The aliquots were filtered through using 0.45µ nylon filters, diluted and drug release was determined spectrophotometrically at a wavelength of 273 nm by comparing with the standard calibration curve. Percent of Theophylline dissolved at different time intervals and various dissolution parameters.
Release kinetics & mechanisms
65
the use of in-vitro drug dissolution data to predict in vivo bio performance can be considered as the rationale development of controlled release formulation.
The methods of approach to investigate the kinetics of drug release from immediate release formulation can be classified into three categories,
1) Statistical methods(multivariate analysis of variance) 2) Model dependent methods (zero order, first order,
Higuchi, Korsmeyer – Peppas model.
3) Model independent method similarity factor(f2)
Model dependent methods
Zero – order model
Drug dissolution [10] from dosage that do not disaggregate and release the drug slowly can be represented by the equation:
Qt= Qo + Ko t
Where
Qt = amount of drug dissolved in time t Qo = initial amount of drug in the solution Ko = zero order release constant
Dosage forms following this profile, release same amount of drug per unit time, and it is the ideal method of release for a sustained release product.
First order model
Gibaldi and Feldman first proposed the application of this model to drug dissolution studies in 1967. The release of the drug which followed First order kinetics can be expressed by the equation:
Where, „Co‟ is the initial concentration of the drug, „K1‟ is the First order rate constant, and „t‟ is the
time. The data obtained are plotted as log cumulative % of drug remaining Vs time which would yield a straight line with a slope of –K/2.303.
Higuchi model
Higuchi first proposed this model to describe dissolution of drug in suspension from ointment bases, but is widely applicable to other types of dosage forms. This model is based on the hypotheses that i) initial drug concentration in the matrix is much higher than drug solubility; ii) drug diffusion takes place only in one dimension iii) drug particles are much smaller than system thickness (iv) matrix swelling and dissolution are negligible (v) drug diffusivity is constant and (vi) perfect sink condition are always attained in the release environment. Accordingly, model expression is given by the equation [11];
Where „Q‟ is the amount of drug released in time „t‟ per unit area „A‟, „C‟ is the drug initial concentration, „Cs‟ is the drug solubility in the matrix media and „D‟ is the diffusivity of the drug molecules in the matrix substances.
In general way it is possible to simply the Higuchi model as
Ft = Q= KH × t 1/2
Where „K‟H is the Higuchi dissolution constant. The
data obtained were plotted as cumulative percentage drug release versus square root of time.
Wo1/3 – Wt1/3 = Kt
Where, „W0‟ is the initial amount of the drug in the
pharmaceutical dosage form, „Wt‟ is the remaining amount
of drug in pharmaceutical dosage form at time „t‟ and k (kappa ) is a constant incorporating the surface- volume relation. To study the release kinetics, data obtained from in-vitro drug release studies were plotted as cube root of drug percentage remaining in matrix Vs time.
Korsmayer –Peppas model
Korsmayer derived a simple relationship which described drug release from a polymeric system. To find out the mechanism of drug release, first 60% drug release data were fitted in Korsmayer –Peppas model [12]
Mt/M∞ =K tn
Where Mt/M∞is a fraction of drug released at time t, k is
the release rate constant and n is the release exponent. In this model, the value of n characterizes the release mechanism of drug. To study the release kinetics studies were plotted as log cumulative percentage drug release
versus log time.Exponent „n‟ of Power law and drug release mechanism from polymeric controlled drug delivery system of different geometry.
In Vitro Buoyancy Studies
The in-vitro buoyancy was determined by floating lag time, as per the method described by Rosa et al. The tablets were placed in a 100 ml beaker containing 0.1N HCL. The media was kept in stagnant condition and the room temperature was maintained at 370C. The time required for the tablet to rise to the surface and float was determined as floating lag time.
Swelling Studies
The extent of swelling was measured in terms of percent weight gain by the tablets. The swelling behaviour of all tablets was studied. One tablet from each formulation was placed in a petridish containing 0.1N HCL buffer solution (pH 1.2). At the end of 1 hr tablet was withdrawn, blotted with a tissue paper and weighed. The process was continued for 24 hours and the percent weight gain by the tablets was calculated by using formula
Swelling index(S.I)={(Mt-Mo)/Mo}×100
Where,
Mt=weight of tablet at time “t”, Mo=weight of tablet at time=0.
Similarity factor, f2 value
66
difference or drug %dissolved between the test and reference products;
Where, n is the number of dissolution time points
„Rt‟ and „Tt‟ are the reference and test dissolution values
(mean of at least 12 dosage units) at time „t‟.
RESULTS AND DISCUSSION
In the present Study Gastro-retentive Theophylline tablets were prepared by using gas generating and non- gas generating method in gas generating method, hydrophilic meltable binders like Gelucire50/30 and PEG6000 were used and the tablets were prepared by using melt granulation technique and in non-gas generating method polymers like HPMCk100M and Carbopol971P were used.
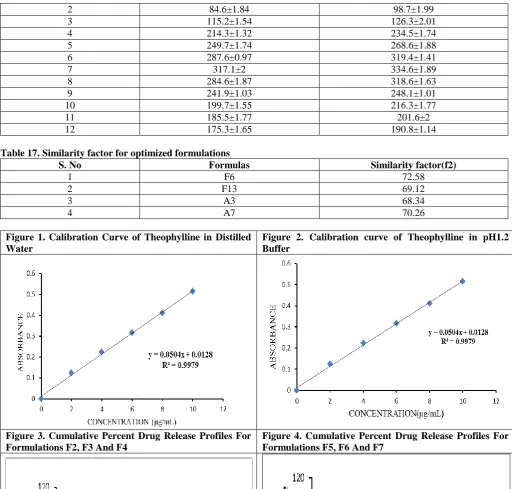
Analytical Method for Determination of Theophylline
Calibration for Theophylline were constructed in distilled water,0.1N Hcl. The method obeyed Beer Lambert‟s law in the concentration range of 2-10µg/mL and plots showed good linearity indicating that the selected UV-spectrophotometric method was found to be suitable in the present investigation for the estimation of Theophylline contents in various products and in-vitro
dissolution studies.
Preformulation Studies
Drug-Excipient Compatibility Studies FTIR spectral Analysis
Fourier transform infrared (FTIR) spectroscopy was employed to characterize any possible interaction between drug and carrier in the solid state on a FTIR spectrophotometer by the conventional KBr pellet method. The spectra were scanned over a frequency range 4000– 400cm-1 with a resolution of 4 cm-1. FTIR spectrum of Theophylline,excipients used in formulations and the optimized formulations A3,A7, F6, F12.
Characteristic peaks of Theophylline from FTIR are N-H stretching 3190.36 cm-1 O-Hstretching 3215 cm-1 cyclic ether C-O stretch 1101.78 cm-1 aryl substituted C=C 1621 cm-1
C-Nstretch 1303.71 cm-1
C-H stretch 2942.72 cm-1
The FT-IR spectrum of Theophylline tablet containing different excipients showed that the major frequencies of functional groups of pure drug remain intact and hence there is no interaction between the drug and the excipients used in the study.
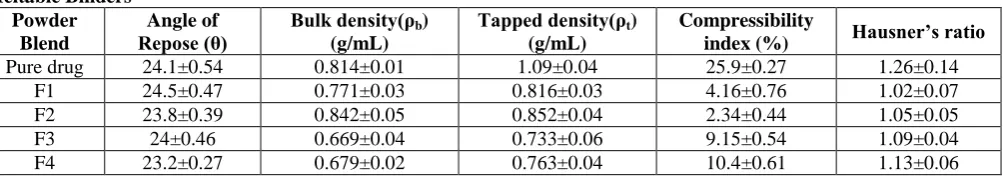
Studies on Pre-Compressional and Post Compressional Parameters for Theophylline Formulations Prepared by Melt Granulation Technique
The pre compressional parameters such as bulk density, tapped density, hausner‟s ratio and angle of repose for the physical mixtures of the formulation were evaluated and the results were within the limits.Bulk density and tapped density for the formulations were within the range of 0.532 ± 0.03 to 0.689 ± 0.09gm/ mL and 0.612 ± 0.01 to 0.776 ± 0.09 gm/mL respectively. Compressibility index and Hausner‟s ratio were in the range of 10.53 ± 0.13% to 13.30 ± 0.14 % and 1.13 ± 0.03 to 1.11 ± 0.05 respectively. The angle of repose of the formulations was found to be in the range of 21º±0.76 to 25º±0.76. Thus, the results obtained confirm that the formulations exhibited good flow properties and good packing characteristics.
The content of the formulations were found to be uniform, since the amount of the active ingredients in each of the 10 units tested are within the range of 98.15±0.02% to 99.24±0.02% including uniform mixing of the drug, binders and other excipients. The mean values for the hardness, weight variation and thickness were found to be in the range of 5.5 ± 0.45 to 5.7 ± 0.63 kg/cm2 , 991 ± 0.67 to 996 ± 0.48 and 6.49 ± 0.03 to 6.57 ± 0.05 and all the formulations exhibited friability less than 0.8% during the friability determination.
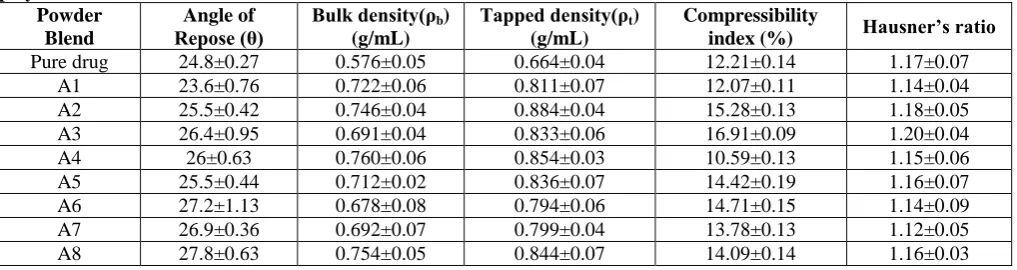
Studies on Pre-Compressional and Post Compressional Parameters for Theophylline Prepared from Hydrophobic Binders
The pre compressional parameters such as bulk density, tapped density, hausner‟s ratio and angle of repose for the physical mixtures of the formulation were evaluated and the results were within the limits.Bulk density and tapped density for the formulations were within the range of 0.592 ± 0.07 to 0.692 ± 0.05 gm/mL and 0.664 ± 0.06 to 0.776 ± 0.09 gm/mL. Compressibility index and Hausner‟s ratio were in the range of 8.68 ± 0.13% to 11.42 ± 0.09% and 0.91 ± 0.12 to 1.21 ± 0.07. The angle of repose of the formulations was found to be in the range of 21º ± 0.74 to 23.5º ±0.38. Thus, the results obtained confirm that all the formulations exhibited good flow properties and good packing characteristics.
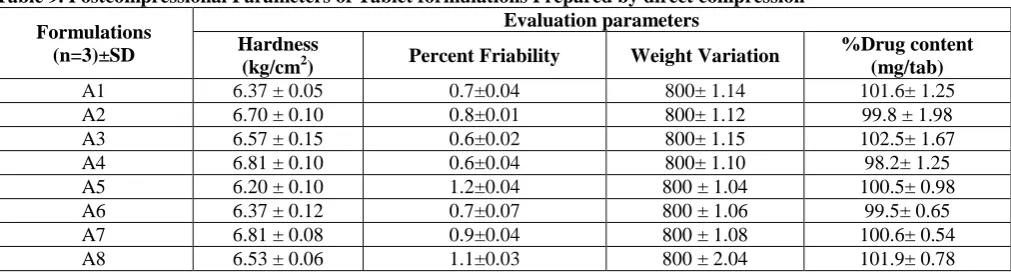
The content of the formulations were found to be uniform, since the amount of the active ingredients in each of the 10 units tested are within the range of 98.34 ± 0.02% to 99.60 ± 0.03% including uniform mixing of the drug, binders and other excipients. The mean values for the hardness, weight variation and thickness were found to be in the range of 5.5 ± 0.51 to 5.7 ± 0.49 kg/cm2 991 ± 0.63 to 998 ± 0.45, 6.49 ± 0.03 to 6.55 ± 0.05 and all the formulations exhibited friability less than 0.8% during the friability determination.
In-Vitro Buoyancy Studies
67
becomes buoyant. The tablet swelled cardially and axially during in-vitro buoyancy studies. All the batches of tablets were found to exhibit short floating lag times due to presence lag times due to presence of the sodium bicarbonate.
Buoyancy studies were performed using pH 1.2buffer at 37oC, the tablets floated and remained buoyant without disintegration. It can be conclude that the F6&F13 showed short buoyancy lag time (BLT).
In Vitro Drug Release Studies Theophylline Floating Tablets (Gas generating systems)
In order to assess drug release profiles, release kinetics and drug release mechanisam‟s from tablets, all the tablet formulations were subjected to in-vitro drug release studies using pH 1.2 as dissolution medium. The cumulative percent drug release for F2, F3, F4, F5, F6, F7, F9, F10,F11,F12,F13,F14. The formulations prepared at 1:1 ratio using Gelucir50/13&PEG6000 F1&F8 are fragile and did not full fill the hardness requirements. The formulations were prepared by using different amounts of gas generating agent and carbopol971P and the formulations F6&F13 show good buoyancy and lag time compared to other formulations. The release of Theophylline from the matrix tablets of F6&F13 was found to be slow and extended up to a period of 12 hrs. It was observed that as the proportion of polymer carbopol971P increased, the release rate of Theophylline decreased.
The controlled release of Theophylline from the tablets can be attributed to presence of release retardant materials Carbopol971P. The polymer swells upon contact with dissolution medium and formed gel layer on surface of tablets. The gel layer had retarded further uptake of fluid and subsequent drug release.
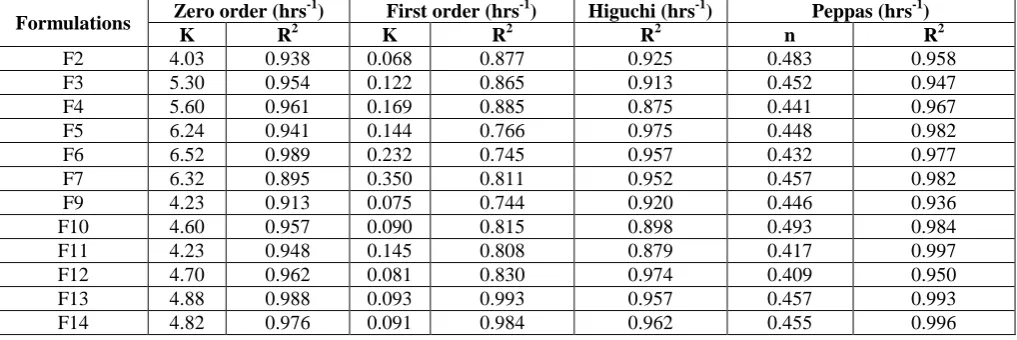
To ascertain the mechanism of drug release, the
in-vitro drug release data was fitted into various release kinetics models such as zero order, first order, Higuchi and Peppas models. For formulation F1-F14 cumulative % drug release values were plotted against time, straight lines were obtained indicating that the drug release from the floating tablets followed first order kinetics. The zero order plots were also calculated. The regression coefficients (R2) obtained for the for the first order kinetics were found to be higher when compared to zero order kinetics indicating that the drug release, from all the formulations followed first order kinetics.
To evaluate the drug release mechanism from the tablets % drug released vs square root of time were plotted.
In all the cases the plots were found to be linear indicating that the drug release mechanism from the floating tablets might be diffusion controlled as proposed by Higuchi for insoluble matrices.
To confirm the diffusion mechanism, the data was fitted into korsmeyer-peppas equationwhich resulted in “n” value between 0.45 and 0.89 thus indicating the mechanism of drug release followed anomalous transport with slow erosion of polymeric matrix followed by diffusion of drug resulting in linear drug release over a prolonged period of time.
The similarity factor (f2) was calculated in order to compare the release profiles of F6, F13& A3,A7 with that of reference formulation. The formulations F6, F13&A3, A7 had a release profiles similar to that of the marketed formulations, with similarity factor f2=72.58,
69.12&68.34, 70.26 respectively, hence these two formulations were comparable to the marketed formulations.
The similarity factor (f2) was calculated in order to compare the release profiles of F6 and F13 with that of reference formulations. The formulations A3 and A7 had a release profiles similar to that of the marketed formulation, with similarity factor f2=68.34 and f2=70.26 respectively, hence these two formulations were comparable to the marketed formulations.
In Vitro Drug Release Studies Theophylline Floating Tablets (Non-gas generating systems)
The cumulative percent drug release for A1,A2,A3,A4,A5,A6,A7,A8 were calculated. The release of Theophylline from the matrix tablets A3&A7was found to be slow and extended up to a period of 12 hrs. It was observed that as the proportion of polymers HPMCK100M, Carbopol971P increased the release rate of Theophylline decreased.
The in-vitro dissolution studies, the prepared Swellable matrix tablets upon contact with the aqueous medium leads to hydration of the hydrophilic matrix system from the peripheral region to the center, forming a gelatinous swollen mass, which controls the diffusion of drug molecules through the polymer matrix system into the aqueous medium and thus releasing the drug in a controlled manner.
To ascertain the mechanism of drug release, the
in vitro drug release data was fitted into various release kinetic models such as Zero order, First order, Higuchi‟s and Peppas models. When log% drug unreleased values were plotted against time, straight lines were obtained indicating that the drug release from the matrix tablets followed first order kinetics. In all the cases the plots were found to be linear between 1-12hrs, indicating that the process of drug release from these matrix tablets followed first order and also the first order plots obtained were linear compared with that of the zero order plots and the regression coefficients (r2) obtained for the first order kinetics were found to be higher when compared with those of zero order kinetics, indicating that drug release from all the formulations followed first-order kinetics During the initial period of up to 2 hours, a higher release rate of drug was observed with most of the prepared matrix tablets. Initially, a small burst effect in the release of drug was observed, which was probably sufficient for the quick build-up of plasma concentration. This burst effect could be due to the highly water soluble drug present in the periphery of the matrix. Subsequently, the release was more uniformly controlled by diffusion from the swelling core of the matrix.
68
time as per Higuchi‟s equation were constructed and the plots were found to be linear in all cases indicating that the drug release mechanism‟s from the matrix tablets might be diffusion controlled as prepared by Higuchi (Higuchi T et al., 1963) for insoluble matrices. Accordingly, drug release from these matrix tablets involves penetration of the dissolution fluid, dissolution of the drug in the dissolution fluid and leaching out of drug through interstitial channels or pores. Thus the overall release rate depends on (i) the rate at which the dissolution fluid penetrates the wall material, (ii) the rate at which the drug dissolves in the dissolution fluid and (iii) the rate at which the dissolved drug can penetrate the wall and disperse from the surface.
To confirm the diffusion mechanism, the data were fit into Korsmeyer peppas equation which resulted in „n‟ value less than 0.45 thus indicating the mechanism of drug release followed Fickian diffusion with slow erosion of polymeric matrix followed by diffusion of drug resulting in linear drug release over a prolonged period of time. The swelling behavior indicated the rate at which tablets absorb the water from dissolution media and swells.
Swelling of matrix tablets increased with respect to time because the weight gain by tablets increased proportionally with the rate of hydration upto 5 hrs and matrix appeared swollen almost from the beginning and a viscous gel layer was created when in contact with water, later on swelling decreased due to dissolution of outermost gelled layer of tablets.
The swelling index of all formulations increased with time as increase the concentration of HPMC K100M&Carbopol in each formulation. It was observed that the drug release decreases with increasing concentration of HPMC K100M&Carbopol971P.
According to compendial requirements of USP, an oral controlled release formulation of Theophylline should provide a release of NLT 25% in 1 hr, 25-50% in 3hr, and NLT 80% in 10 hrs. A comparison of the drug release profiles of controlled release matrix tablets prepared with that of the commercial controlled release tablets of Theophylline revealed that the release profiles for formulation F7 &F9 and A3&A7 were very close to commercial controlled release tablets of Theophylline.
Table 1. Calibration Curve Data of Theophylline in Distilled Water
S. No Concentration
(µg/ml)
Absorbance* ±SD
1 0 0.000±0.000
2 2 0.124±0.003
3 4 0.223±0.001
4 6 0.316±0.002
5 8 0.411±0.004
6 10 0.515±0.001
Table 2. Calibration Curve Data of Theophylline in 1.2pH buffer
S. No Concentration
(µg/ml)
Absorbance* ±SD
1 0 0.000±0.000
2 2 0.101±0.002
3 4 0.195±0.003
4 6 0.319±0.001
5 8 0.408±0.002
6 10 0.507±0.004
Table 3. FTIR spectral Studies data
N-H stretching 3190.36 cm-1
O-Hstretching 3215 cm-1
cyclic ether C-O stretch 1101.78 cm-1
aryl substituted C=C 1621 cm-1
C-Nstretch 1303.71 cm-1
C-H stretch 2942.72 cm-1
Table 4. Precompressional parameters of various tablets prepared by Melt granulation technique using Hydrophilic Meltable Binders
Powder Blend
Angle of
Repose (θ) Bulk density(ρb ) (g/mL)
Tapped density(ρt)
(g/mL)
Compressibility
index (%) Hausner’s ratio
69
F5 25±0.63 0.698±0.06 0.813±0.03 13.93±0.45 1.15±0.01 F6 24.8±0.38 0.576±0.01 0.664±0.02 12.21±0.34 1.17±0.12 F7 23.6±0.36 0.722±0.05 0.811±0.06 12.07±0.62 1.14±0.05 F8 25.5±0.76 0.746±0.01 0.884±0.01 15.28±0.36 1.18±0.07 F9 26.4±0.09 0.691±0.06 0.833±0.04 16.91±0.34 1.20±0.03 F10 26±0.74 0.760±0.04 0.854±0.02 10.59±0.63 1.15±0.02 F11 25.5±0.44 0.712±0.01 0.836±0.03 14.42±0.36 1.16±0.04 F12 27.2±0.95 0.678±0.04 0.794±0.01 14.71±0.48 1.14±0.09 F13 26±0.38 0.692±0.03 0.799±0.09 13.78±0.36 1.12±0.05 F14 26.8±0.63 0.665±0.04 0.854±0.05 14.92±0.38 1.19±0.03
Table 5. Precompressional Parameters of Tablet Formulations Prepared by Direct compression using Swellable polymers
Powder Blend
Angle of
Repose (θ) Bulk density(ρb ) (g/mL)
Tapped density(ρt)
(g/mL)
Compressibility
index (%) Hausner’s ratio
Pure drug 24.8±0.27 0.576±0.05 0.664±0.04 12.21±0.14 1.17±0.07 A1 23.6±0.76 0.722±0.06 0.811±0.07 12.07±0.11 1.14±0.04 A2 25.5±0.42 0.746±0.04 0.884±0.04 15.28±0.13 1.18±0.05 A3 26.4±0.95 0.691±0.04 0.833±0.06 16.91±0.09 1.20±0.04 A4 26±0.63 0.760±0.06 0.854±0.03 10.59±0.13 1.15±0.06 A5 25.5±0.44 0.712±0.02 0.836±0.07 14.42±0.19 1.16±0.07 A6 27.2±1.13 0.678±0.08 0.794±0.06 14.71±0.15 1.14±0.09 A7 26.9±0.36 0.692±0.07 0.799±0.04 13.78±0.13 1.12±0.05 A8 27.8±0.63 0.754±0.05 0.844±0.07 14.09±0.14 1.16±0.03
Table 6. Composition of Controlled Release Formulations of Theophylline Tablets Prepared by Melt granulation technique using Hydrophilic Meltable Binders
S.No Ingredients F1 F2 F3 F4 F5 F6 F7 F8 F9 F10 F11 F12 F13 F14
1 Theophylline 400 400 400 400 400 400 400 400 400 400 400 400 400 400 2 Gelucire-50/13 400 200 150 150 150 150 150 - - - - 3 PEG-6000 - - - 400 200 150 150 150 150 150 4 Carbopol - 25 50 100 150 200 250 - 25 50 100 150 200 250 5 DCP 90 95 50 15 80 10 10 90 95 50 15 80 10 10 6 Sodium
bicarbonate - 20 40 75 80 80 80 - 20 40 75 80 80 80 7 Talc 5 5 5 5 5 5 5 5 5 5 5 5 5 5 8 Magnesium
Stearate 5 5 5 5 5 5 5 5 5 5 5 5 5 5 9 TOTAL (mg) 900 700 700 750 850 850 900 900 700 700 750 850 850 900
Table 7. Composition of Theophylline Formulations Prepared by Direct Compression
S. No Ingredients A1 A2 A3 A4 A5 A6 A7 A8
1 Theophylline 400 400 400 400 400 400 400 400 2 HPMC K100 M 80 160 240 320 - - - -
3 Carbopol 971P - - - - 80 160 240 320 4 DCP 310 230 150 70 310 230 150 70 5 Magnesium Stearate 5 5 5 5 5 5 5 5
6 Talc 5 5 5 5 5 5 5 5
Table 8. Post compression properties of all formulation Prepared by Melt granulation Technique using meltable binders
Formulations (n=3)±SD
Evaluation Parameters Hardness
(kg/cm2) Percent Friability Weight Variation %Drug content
F1 6.37 ± 0.05 0.7±0.05 900± 1.14 101.5 ± 1.25
70
F5 6.20 ± 0.10 1.2±0.04 850 ± 1.04 99.5 ± 0.98 F6 6.37 ± 0.12 0.7±0.08 850 ± 1.06 102.3 ± 0.65 F7 6.81 ± 0.08 0.9±0.06 900 ± 1.08 100.6 ± 0.54 F8 6.53 ± 0.06 1.1±0.01 900 ± 0.94 101.8 ± 0.78 F9 6.66 ± 0.15 0.8±0.02 700 ± 0.81 98.3 ± 0.85 F10 6.71 ± 0.12 0.8±0.04 700 ± 2.02 99.24 ± 0.97 F11 6.72 ± 0.11 0.6±0.02 750 ± 1.03 101.7 ± 0.36 F12 6.50 ± 0.10 0.9±0.01 850 ± 1.05 100.9 ± 0.84 F13 6.62±0.12 0.8±0.06 850±1.07 102.6 ±0.82 F14 6.65±0.11 0.9±0.04 900±1.08 99.2 ±0.88
Table 9. Postcompressional Parameters of Tablet formulations Prepared by direct compression
Formulations (n=3)±SD
Evaluation parameters Hardness
(kg/cm2) Percent Friability Weight Variation
%Drug content (mg/tab)
A1 6.37 ± 0.05 0.7±0.04 800± 1.14 101.6± 1.25
A2 6.70 ± 0.10 0.8±0.01 800± 1.12 99.8 ± 1.98 A3 6.57 ± 0.15 0.6±0.02 800± 1.15 102.5± 1.67 A4 6.81 ± 0.10 0.6±0.04 800± 1.10 98.2± 1.25 A5 6.20 ± 0.10 1.2±0.04 800 ± 1.04 100.5± 0.98 A6 6.37 ± 0.12 0.7±0.07 800 ± 1.06 99.5± 0.65 A7 6.81 ± 0.08 0.9±0.04 800 ± 1.08 100.6± 0.54 A8 6.53 ± 0.06 1.1±0.03 800 ± 2.04 101.9± 0.78
Table 10. Cumulative Percent Drug Release Data of Theophylline Tablet Formulations Prepared by Melt granulation technique Using Hydrophilic Meltable Binder Gelucire 50/13(n=3)
Time (hrs)
Cumulative Percent of Theophylline Drug Release
F1 F2 F3 F4 F5 F6 F7
1 - 69.84±0.56 22.39±1.21 18.23±0.87 17.39±0.64 15.51±1.56 11.96±1.2 2 - 100.31±0.76 65.23±1.02 62.49±1.33 34.76±0.76 26.50±0.47 22.86±0.78 4 - - 100.30±1.36 89.96±1.2 62.33±1.02 36.24±1.10 36.88±1.02 6 - - - 100.7±0.92 84.42±0.62 51.40±0.96 58.31±1.23 8 - - - - 99.78±1.32 69.86±1.33 68.94±0.69 10 - - - - - 90.63±0.88 71.72±1.36 12 - - - - - 100.79±1.23 80.48±1.4
Table 11. Cumulative Percent Drug Release Data of Theophylline Tablet Formulations Prepared by Melt granulation technique Using Hydrophilic Meltable Binder PEG 6000(n=3)
Time (hrs)
Cumulative Percent of Theophylline Drug Release
F8 F9 F10 F11 F12 F13 F14
1 - 64.37±0.32 22.53±1.47 17.35±0.78 19.39±1.34 16.59±0.75 11.96±1.2 2 - 100.76±0.69 66.61±1.10 68.94±1.44 44.36±1.76 25.50±1.49 24.86±0.45 4 - - 100.77±1.36 76.96±1.6 72.63±1.62 44.64±1.35 39.88±1.47 6 - - - 99.36±1.92 86.42±0.82 59.40±0.46 56.36±1.32 8 - - - - 100.78±1.3 71.36±1.37 69.24±1.05 10 - - - - - 89.35±1.08 81.27±1.66 12 - - - - - 100.12±0.63 90.33±1.3
Table 12. Cumulative Percent Drug Release Data of Theophylline Tablet Formulations Prepared by Direct compression Using Swellable Polymers HPMCk100M, Carbopol 971P (n=3)
Time (hrs)
Cumulative Percent of Theophylline Drug Release
A1 A2 A3 A4 A5 A6 A7 A8
1 34.43±1.03 15.93±0.74 16.76±1.56 14.75±1.0 6
34.43±1.0
3 15.91±0.76 18.76±1.58 14.74±1.05 2 79.08±0.89 35.24±1.69 33.10±0.45 31.10±0.7
9
79.08±0.8
9 38.24±1.64 33.10±0.45 32.15±0.71 4 100.78±1.23 61.08±0.99 39.47±0.66 36.47±0.6
3
100.78±1.
71
6 - 71.71±1.25 57.86±1.47 51.86±1.4
1 - 74.79±1.28 57.86±1.47 51.84±1.44 8 - 100.31±0.6
4 65.71±0.59
60.78±1.5
5 - 100.36±0.69 65.71±0.59 62.74±1.55 10 - - 76.33±1.47 72.39±1.7
4 - - 74.35±1.49 72.39±1.71 12 - - 99.76±1.01 87.76±1.6
1 - - 99.32±1.06 86.74±1.64
Table 13. In-vitro Drug release kinetic Data of Theophylline Matrix Tablets prepared by using Meltable binders (Gas generating method)
Formulations Zero order (hrs
-1) First order (hrs-1) Higuchi (hrs-1) Peppas (hrs-1)
K R2 K R2 R2 n R2
F2 4.03 0.938 0.068 0.877 0.925 0.483 0.958 F3 5.30 0.954 0.122 0.865 0.913 0.452 0.947 F4 5.60 0.961 0.169 0.885 0.875 0.441 0.967 F5 6.24 0.941 0.144 0.766 0.975 0.448 0.982 F6 6.52 0.989 0.232 0.745 0.957 0.432 0.977 F7 6.32 0.895 0.350 0.811 0.952 0.457 0.982 F9 4.23 0.913 0.075 0.744 0.920 0.446 0.936 F10 4.60 0.957 0.090 0.815 0.898 0.493 0.984 F11 4.23 0.948 0.145 0.808 0.879 0.417 0.997 F12 4.70 0.962 0.081 0.830 0.974 0.409 0.950 F13 4.88 0.988 0.093 0.993 0.957 0.457 0.993 F14 4.82 0.976 0.091 0.984 0.962 0.455 0.996
Table 14. In-vitro Drug release kinetic Data of Theophylline Matrix Tablets prepared by Direct compression using swellable polymers (non gas generating method)
Formulations Zero order (hrs
-1
) First order (hrs-1) Higuchi (hrs-1) Peppas (hrs-1)
K R2 K R2 R2 n R2
A1 5.30 0.977 0.168 0.868 0.825 0.463 0.978 A2 5.30 0.965 0.122 0.869 0.913 0.452 0.987 A3 5.60 0.985 0.169 0.858 0.875 0.467 0.998 A4 6.24 0.966 0.144 0.761 0.975 0.448 0.984 A5 6.52 0.945 0.232 0.864 0.957 0.432 0.967 A6 6.32 0.911 0.350 0.819 0.952 0.462 0.988 A7 4.23 0.944 0.075 0.744 0.920 0.446 0.996 A8 4.60 0.875 0.090 0.814 0.898 0.493 0.977
Table 15. In-Vitro Buoyancy Studies
Formulations Buoyancy Lag Time(sec) Total Floating Time(hrs)
F2 52 sec 10hrs
F3 47 sec 11hrs
F4 45 sec 12hrs
F5 32 sec 12hrs
F6 27 sec ˃12hrs
F7 34 sec 11hrs
F9 54 sec 10hrs
F10 45 sec 11hrs
F11 38 sec 12hrs
F12 29 sec 12hrs
F13 31 sec >12hrs
Table 16. Swelling behavior of Theophylline matrix formulations % Swelling Index
Time(hrs) A3 A7
72
2 84.6±1.84 98.7±1.99
3 115.2±1.54 126.3±2.01
4 214.3±1.32 234.5±1.74
5 249.7±1.74 268.6±1.88
6 287.6±0.97 319.4±1.41
7 317.1±2 334.6±1.89
8 284.6±1.87 318.6±1.63
9 241.9±1.03 248.1±1.01
10 199.7±1.55 216.3±1.77
11 185.5±1.77 201.6±2
12 175.3±1.65 190.8±1.14
Table 17. Similarity factor for optimized formulations
S. No Formulas Similarity factor(f2)
1 F6 72.58
2 F13 69.12
3 A3 68.34
4 A7 70.26
Figure 1. Calibration Curve of Theophylline in Distilled Water
Figure 2. Calibration curve of Theophylline in pH1.2 Buffer
Figure 3. Cumulative Percent Drug Release Profiles For Formulations F2, F3 And F4
73 Figure 5. FTIR Spectrum of pure drug Theophylline
D:\FTIR DATA\BHARATH.0 B-1 Instrument type and / or accessory 21/04/2015
25
70
.6
9
17
06
.4
7
16
59
.8
9
15
57
.6
0
14
35
.2
1
11
80
.9
7
96
9.
61
84
0.
71
73
5.
53
60
3.
80
51
5.
47
500 1000
1500 2000
2500 3000
3500
Wavenumber cm-1
86
88
90
92
94
96
98
100
Tr
an
sm
itt
an
ce
[%
]
Page 1/1 Figure 6. FTIR Spectrum of GELUCIRE 50/13
Figure 7. FTIR Spectra for PEG 6000
D:\FTIR DATA\BHARATH.2 B-3 Instrument type and / or accessory 21/04/2015
10
96
.6
2
95
0.
95
83
7.
93
500 1000
1500 2000
2500 3000
3500
Wavenumber cm-1
65
70
75
80
85
90
95
Tr
an
sm
itt
an
ce
[%
]
74 Figure 8. FTIR Spectra for Carbopol 971P
D:\FTIR DATA\BHARATH.4 B-4 Instrument type and / or accessory 21/04/2015
16
91
.50
11
61
.12
53
0.4
4
500 1000
1500 2000
2500 3000
3500
W avenumber cm-1
84
86
88
90
92
94
96
98
Tr
an
sm
itta
nc
e [
%
]
Page 1/1
Figure 9. FTIR Spectra for Formulation-F12
D:\FTIR DATA\BHARATH.7 B-7 Instrument type and / or accessory 21/04/2015
16
61
.1
8
96
8.
68
500 1000
1500 2000
2500 3000
3500
Wavenumber cm-1
75
80
85
90
95
Tr
an
sm
itt
an
ce
[%
]
Page 1/1
CONCLUSION
The calibration curve for Theophylline was performed using 0.1N HCL shows good linearity and R2 value. Theophylline and the meltable binders, Swellable polymers selected for this investigation were found to be compatible and it was confirmed by FT-IR studies. Pre-compressional and Post-Pre-compressional parameters were found to be within the satisfactory limits and hence suitable for formulation in to matrix tablets. The formulations F6, F13&A3,A7, were optimized and could provide controlled release action for a prolonged period of time i.e for 12 hrs. The desired drug release rate obtained for A3,A7, F6, F13 was found to be similar with that of the drug release rate of the marketed formulation and this was confirmed using the similarity factor. The formulations A3, A7,F6, F13 were suitable to control the drug release for a period of 12 hours, and the in-vivo drug release data was fitted into various release kinetic models such as Zero order, Higuchi and Peppas kinetic models in order to ascertain the mechanism of drug release, and from the
75 REFERENCES
1. Amit Kumar, Verma Rajesh, Purohit Suresh and Bhandari Anil. Overview of Gastro Retentive Drug Delivery System.
Journal of Natura Conscientia, 2(3), 2011, 423- 436.
2. Anil Kumar J. Shinde, Manoj kumar S. Patel and Harinadh N. More. Formulation and evaluation of an oral floating tablet of cephalexin. Indian J. pharm. Educe. Res., 44(3), 2010, 1-10.
3. Arunachalam A, Stephen rathinaraj B, Rajeer CH, Kumara swamy D and A M Umarunnisha. Design and evaluation of levofloxacine hemi hydrate floating tablets. Int. jour. of Applied Biology and pharmaceutical Technology, 1(2), 2010, 260-268.
4. Bangale GS, Stephen Rathinaraj B, Shinde GV, and Umalkar DG and Rajesh K. Formulation and Evaluation of Natural Gum Based Matrix Tablets for Oral Controlled Delivery of Nimodipine. Ind J Pharm Edu. Res., 45(4), 2011, 375-383. 5. Seethe Sunkara, Deekonda Sravanthi, Karna Male Maheswari, Shaik Salma and Buchi N Nalluri. Development of
modified release tablet dosage formsof capecitabine for better therapeutic efficacy. J. Chem. Pharm. Res., 5(1), 2013, 320-328.
6. Chandra Sekhar Y, Jagannathan K, Senthilselvi R and Perumal P. Floating and sticking tablets of Theophylline. An international journal of advances in pharmaceutical sciences, 2(4), 2011, 378-384.
7. Gande S and Rao YM. Sustained release effervescent floating matrix tablets of baclofen: Development, optimization and
in-vitro – in-vivo evaluation in healthy human volunteers. Daru, 19(3), 2011, 202-209.
8. Huang YB, Tasi YH, Yang WC, Chang JS and Wu pc. Optimization of sustained release propranolol dosage form using factorial design and response surface methodology. Bio pharm. Bull, 27, 2004, 1626-1629.
9. Jitendra Gupta and Ajit Kumar Rajpoot. Formulation development and in-vitro evaluation of floating microspheres of Clopidogrel bisulfate. International journal of biopharmaceutical and toxicological research, 2(1), 2012, 212-218.
10. Kawashima Y, Niwa T, Takeuchi H, Hino T and Itoh Y. Hollow microspheres for use as a floating controlled drug delivery system in the stomach. Journal of Pharma sci., 81(2), 1992, 135-140.
11. Patel U F and Patel NM. Intra gastric floating drug delivery system of cefuroxime Axetil in-vitro evaluation. AAPS. Pharma. Tech., 7(1), 2006, Article 17.