A study of the average flow in open channel
with baffle blocks distributed uniformly
Tien Tran Dung1, Tuan Le Anh1, Nhung Le Hong2, Hung Ho Viet1
1 Thuyloi University, 175 Tay Son, Hanoi, Vietnam 2 Probationer at Thuyloi University, 175 Tay Son, Hanoi, Vietnam
[email protected], [email protected], [email protected], [email protected]
Abstract
A study of average flow in open channel with baffle blocks distributed uniformly has been considered by using channel with varied slopes. In this article, experimental and modelling studies were introduced when the correlation between the water depth and baffle block size is significant. The objective of the work is to give the rudimentary relations between discharge and water level in the channels. When the water depth is large, the effect of bottom channel friction on the flow is relatively small. This paper also gives applications of the software ‘Telemac-2D’ to simulate the flow under different conditions.
Keywords : Telemac-2D, Drag coefficient, Emergent blocks
1
Introduction
Volume 3, 2018, Pages 2088–2095
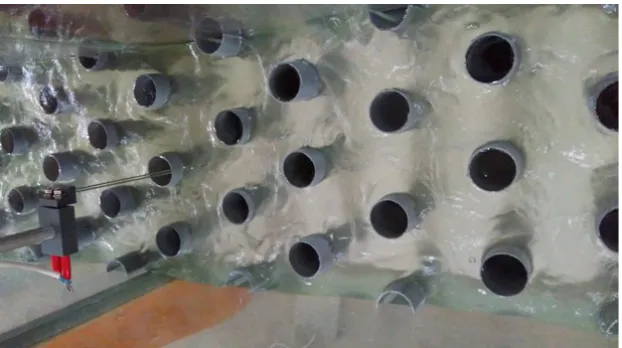
Figure 1: Experimental channel with cylinders
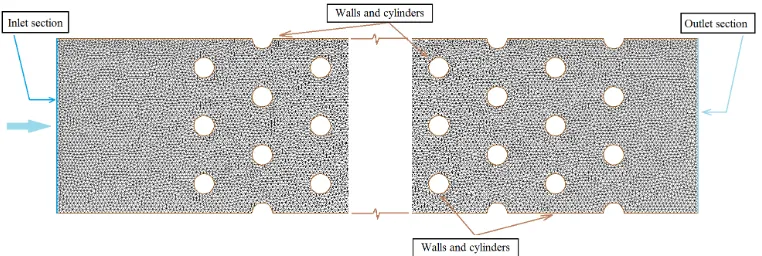
Figure 2: Points of water level measurements
An Delft Mesure - DAQ is used to measure the water level at different points along the flow (Figure 2). For each point, the water level is an average of 400 measured values. An average value of water depth H is obtained from the average water levels of 28 points.
Exp. C Slope (%)
Q (l/s)
H (cm)
F Bed K
(Strickler) E1 17.6 1 2.5-7 9-14.5 0.14-0.27 Smooth 100 E2 17.6 1.3 1.2-7 6-13.5 0.22-0.30 Smooth 100 E3 17.6 2 2.2-8.5 7-14.5 0.17-0.24 Smooth 100 E4 17.6 1 1.8-5.6 7.5-13 0.15-0.23 Rough 30 E5 17.6 1.5 1.8-5.6 7.5-12.5 0.16-0.25 Rough 30 E6 17.6 2 1.2-5.6 6.5-12 0.13-0.27 Rough 30
Table 1: Test channel configurations
3
Mathematical models
4
Initial conditions and boundary conditions
The boundary conditions were a prescribed constant discharge at the model inlet and a depth-discharge relation at the outlet, with values corresponding to the experimental settings. At each time step, the outflow was calculated hereafter from the flow depth values at the outlet nodes using a rating curve relation in experimental study. A free slip condition is applied for boundary conditions for side walls, lateral abutments, cylinders.
5
Results
Water levels were measured on 28 nodes at different cross-sections along the channel. The experiments on the ‘smooth’ bottom were conducted with channel bottom slope of S = 1%, 1.3% and 2%, flow rate of Q = 2.2 l/s, 3.4 l/s; 4.4 l/s, 5.6 l/s and 7 l/s, corresponding to the average water level in the channel varying from 6.9 cm to 14.5 cm; In the case of “rough” channel bottom, the experiment was conducted with bottom slope of S = 1%, 1.5% and 2%, flow rate of Q = 1.2 l/s, 2.5 l/s, 3.4 l/s; 4.4
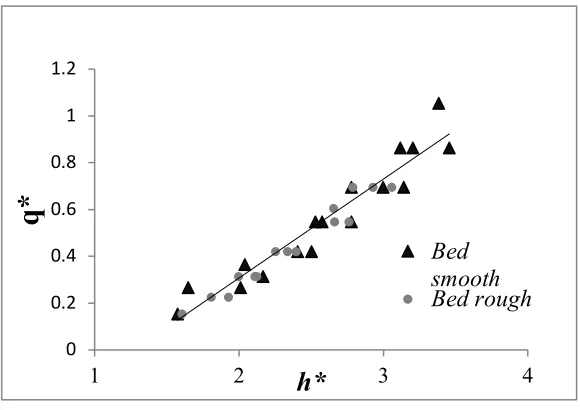
Figure 4: The Stage – discharge relationship for all experiments
Figure 4 illustrates the relationship between flow rate and the water level, which represents two dimensionless quantities: h* = h/D and q* = Q/(b*g0.5*D1.5), with b is the channel width, g is the
gravitational acceleration, g = 9.81 m/s2.
According to the Figure 4 the discharge - water level correlation coincides with two different channel bottoms. There with 1.5 ≤ h* ≤ 3.5, the influence of the channel bottom on the flow is insignificant. From figure 4, a simple linear relationship can be given to represent the discharge – water level relationship:
(R2 = 0.929) (1)
Equation (1) shows a scenario of block density in the channel of C = 17.62, which requires further experiments with other densities to calibrate this equation. This relationship is also used to make the boundary condition in the Telemac-2D model.
A big attention was paid to the drag coefficient, when the coefficient h* was large, the influence of the frictional force was insignificant and has been neglected in this study. For uniform flow regime,
0 0.2 0.4 0.6 0.8 1 1.2
1 2 3 4
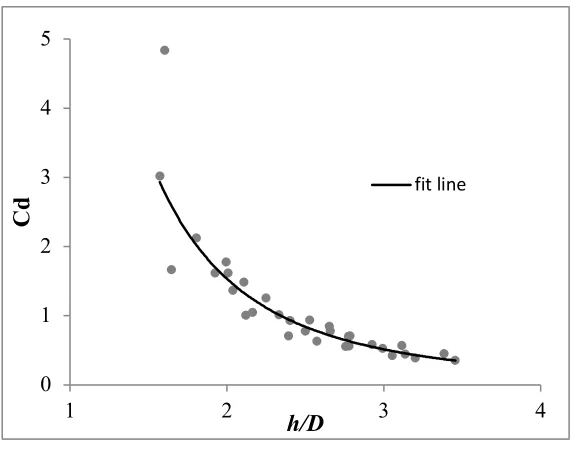
Figure 5: Drag coefficient as a function of h* = h/D
Figure 5 shows the relationship between Cd and h/D for both smooth and rough bottoms. The fit
line was built according to power equation to describe this correlation:
(R2 = 0.91) (5)
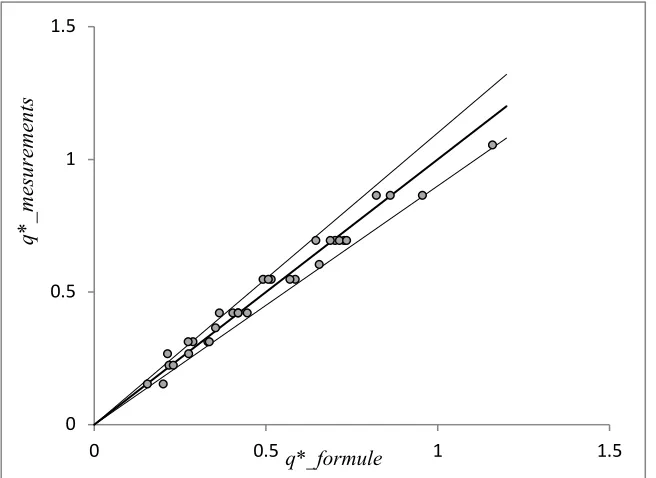
Figure 6 shows the relationship between the actual discharge and the discharge calculated from formula (5). Equation (5) agrees sufficiently well with the results of the experiment, the error between calculated flow rate and the measured flow rate is less than 10%.
Telemac-2D was used to simulate the flow with C = 17.62% and C = 24.01%, and the bottom slope of S = 1%, 2%, 3%, 4%. According to [7], the Telemac-2D model is consistent with stage-discharge relationship of [3], where Fr <0.7 and h/D <1.2.
0 1 2 3
1 2 3 4
Figure 6: Comparison of dimensionless discharge between measured and calculated by formule (4)
Figure 7 shows the error between the measured discharge and calculated discharge using Telemac-2D. When h/D≤ 1.2, Telemac-2D agrees sufficiently well with stage-discharge of [3]. As h* increases the error increases rapidly, both field data and Telemac-2D’s results show that the error tends to decrease rapidly as h* approaches 3.
0 0.5 1 1.5
0 0.5 1 1.5
q*_mes
ur
ement
s
q*_formule
0.2 0.3 0.4 0.5 0.6
o
Chorda J, M. M. (2010). Two-dimensional free surface flow numerical model for vertical slot fishways. J Hydraul Res, 48(2), 141-151.
Galland JC, G. N.-M. (1991). TELEMAC-a new numerical-model for solving shallowwater equations. Adv Water Resour, 14(3), 138-148.
JM, H. (2000). The TELEMAC modelling system: an overview. Hydrol Process, 14(13), 2209–2210. Tran DT, C. J. (2016). Modelling nature-like fishway flow around unsubmerged obstacles using a 2D