Available Online at www.ijpret.com
26
INTERNATIONAL JOURNAL OF PURE AND
APPLIED RESEARCH IN ENGINEERING AND
TECHNOLOGY
A PATH FOR HORIZING YOUR INNOVATIVE WORK
STUDY AND ANALYSIS OF ECG SIGNAL USING LABVIEW AND MULTISIM
DEEPA ANNAMALAI1, S.MUTHUKRISHNAN2
1. PG Scholar, VLSI Design, Dept of ECE, SECE, Coimbatore – 641202.
2. Prof and HOD, Dept of ECE, SECE, Coimbatore – 641202.
Accepted Date: 22/02/2014 ; Published Date: 01/03/2014
\
Abstract: This paper deals with study and analysis of ECG Signal processing by using
LABVIEW and MULTISIM tools. Study of ECG signal includes ECG signal generation, preprocessing and feature extraction in ECG signals. Using simulation and virtual Instrumentation together in the design environment, allows us to work on real-time ECG signals with great accuracy and convenience. Mathematical capabilities of SPICE to accurately model complex circuits and devices, together with measurement capabilities of Virtual Instrumentation such as data collection, automation, testing etc., opens up many engineering circuit and system design possibilities.
Keywords: ECG signal processing, LABVIEW, MULTISIM, Real-time signal
Corresponding Author: Ms. DEEPA ANNAMALAI
Access Online On:
www.ijpret.com
How to Cite This Article:
Available Online at www.ijpret.com
27 analyses how to use LabVIEW's powerful tools in generating, denoising, analyzing, and extracting ECG signals easily and conveniently.
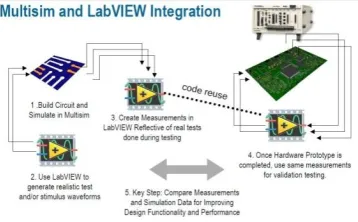
Injection of real-time test signal into circuit simulation using Virtual Instrument and comparing the results of simulation data, with test bench data and automatically optimizing the design for accuracy is possible with LABVIEW and MULTISIM integration.
Figure 1. LABVIEW and MULTISIM Co-simulation
Available Online at www.ijpret.com
28 Figure 2. A Typical one-cycle ECG tracing
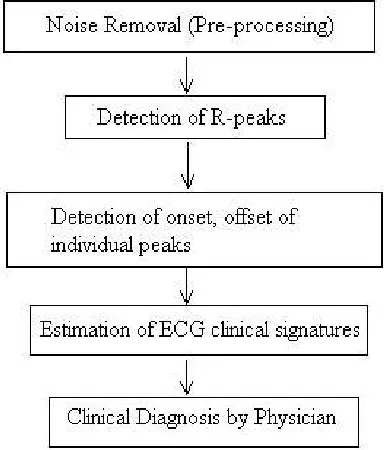
The objective to analyze accurately an ECG signal is especially important, where the feature extraction of the ECG signals is to locate the interested characteristic points that can be used to detect possible cardiovascular abnormalities. The fast and precise detection of QRS complexes is very important in ECG signal analysis, for it is the precondition of the correlative parameters calculation and diagnosis.
ECG signal processing can be roughly divided into two stages by functionality: preprocessing and feature extraction. The preprocessing stage removes or suppresses noise from the raw ECG signal and the feature extraction stage extracts diagnostic information from the ECG signal [1].
Available Online at www.ijpret.com
29 Preprocessing ECG signals helps to remove contaminants from the ECG signals. ECG contaminants are classified into the following categories:
power line interference
electrode pop or contact noise
patient–electrode motion artifacts
electromyographic (EMG) noise
baseline wandering
Among these noises, the power line interference and the baseline wandering are the most significant and can strongly affect ECG signal analysis. The power line interference is narrow-band noise centered at 60 Hz (or 50 Hz) with a narrow-bandwidth of less than 1Hz. Usually the ECG signal acquisition hardware can remove the power line interference. However the baseline wandering and other wideband noises are not easy to be suppressed by hardware equipments. Instead, the software scheme is more powerful and feasible for offline ECG signal processing. The following methods can be used to remove baseline wandering and the other wideband noise [2].
a. Removing Baseline Wandering
Available Online at www.ijpret.com
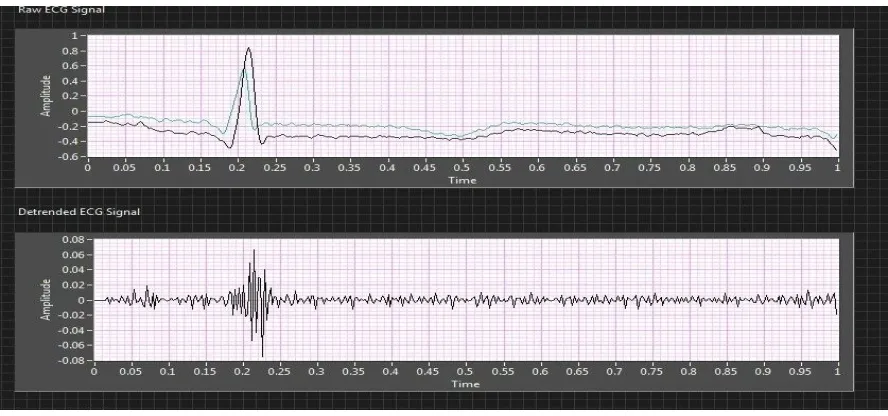
30 Figure 4: Using the WA Detrend VI to remove baseline wandering
This example uses the Daubechies6 (db06) wavelet because this wavelet is similar to the real ECG signal. In the ECG signal used, sampling duration is of 60 seconds, and 12000 sampling points in total, therefore the trend level is 0.5 according to the following equation:
where t is the sampling duration and N is the number of sampling points.
Available Online at www.ijpret.com
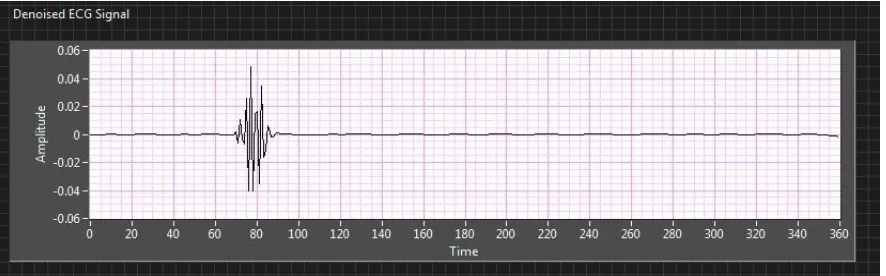
31 applying the wavelet transform, and then modifies each wavelet coefficient by applying a threshold or shrinkage function, and finally reconstructs the denoised signal. The figure 6 shows an example of applying the undecimated wavelet transform (UWT) to the ECG signal.
Figure 6. Removing wideband noise by applying UWT
The UWT has a better balance between smoothness and accuracy than the discrete wavelet transform (DWT). By comparing the denoised ECG signal with the non-denoised ECG signal, as shown in Figure 7, it can be found that the wideband noises are strongly suppressed while almost all the details of the ECG signal are kept invariant.
Available Online at www.ijpret.com
32
B. Feature Extraction
For the purpose of diagnosis, often we need to extract various features from the preprocessed ECG data, including QRS intervals, QRS amplitudes, PR intervals, QT intervals, etc. These features provide information about the heart rate, the conduction velocity, the condition of tissues within the heart as well as various abnormalities. It supplies evidence for the diagnoses of cardiac diseases [3].
For this reason, it has drawn considerable attention in the ECG signal processing field. This section mainly discusses how to perform ECG feature extraction. LabVIEW Biomedical Toolkit provides an ECG Feature Extractor VI for users to extract ECG features conveniently. We can select whether to detect QRS only or to detect all supported ECG features, including R position, R amplitude, iso level, QRS onset, QRS offset, P onset, P offset, T onset and T offset [4].
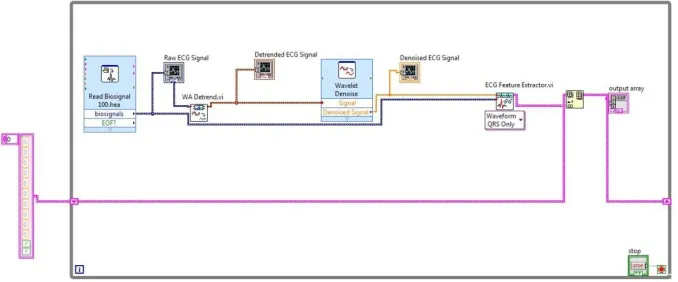
Figure 8. Implementation of QRS Detection
Available Online at www.ijpret.com
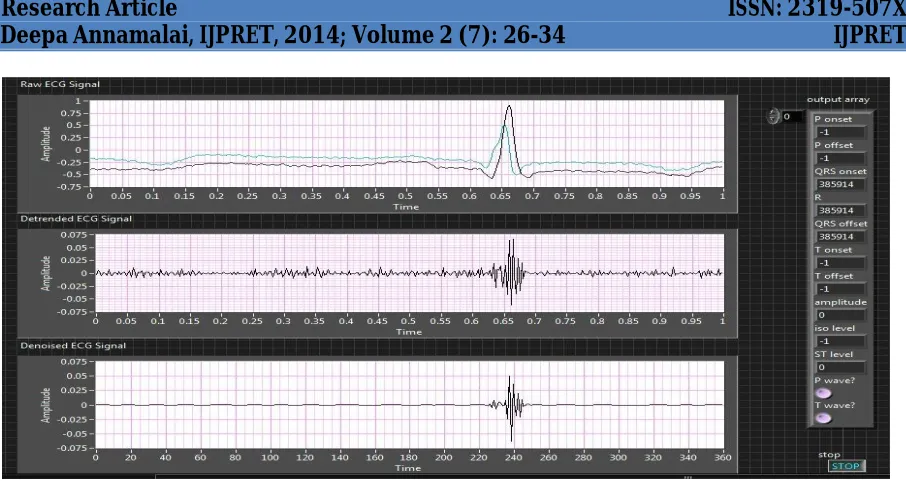
33 Figure 9. Original ECG, ECG after Detrending, Denoising and QRS parameters detection
The preprocessed ECG signal is used to detect position of R waves. After that, all other features will be extracted using original signal, because the signal enhancement may change these features.
Once all the peaks are detected, these are taken as there ferences and an optimum window width is selected and the waves are scanned on both the sides of the peaks to get the zero crossing points for obtaining onsets and offsets. If the signal is not crossing zero line, then the minimum values in that window are considered as onsets and offsets. The peak values detected using LabVIEW are carried to the mathscript node as inputs and zero crossing points or minimum values(onsets and offsets) are taken as outputs from the mathscript node.
III.CONCLUSION
Available Online at www.ijpret.com
34 IV.REFERENCES
1. Rajarshi Gupta, Madhuchhanda Mitra, Jitendranath Bera, ECG Acquisition and Automated Remote Processing, ©Springer India 2014.
2. [Online]. Available: http://www.ni.com/white-paper/6349/en/ LabVIEW for ECG Signal Processing.
3. [Online]. Available: http://www.ni.com/example/30925/en/ Biomedical
Application: Multisim Simulation with an ECG Amplifier.