Organized by G. V. S. E. T., Jaipur. Available Online at www.ijpret.com1
INTERNATIONAL JOURNAL OF PURE AND
APPLIED RESEARCH IN ENGINEERING AND
TECHNOLOGY
A PATH FOR HORIZING YOUR INNOVATIVE WORK
STUDY AND ANALYSIS OF LEAN TOOLS TO IMPROVE AND INCREASE THE
EFFICIENCY OF MANUFACTURING PROCESS
AJAY KUMAR PAGARE1, DR. NEERAJ KUMAR2
1. Research Scholar, Mechanical Engineering Department Suresh Gyan Vihar University Jaipur Rajasthan.
2. Professor & Head of Department, Mechanical Engineering Department Suresh Gyan Vihar University Jaipur Rajasthan.
Accepted Date: 19/03/2018; Published Date: 01/04/2018
Abstract: In this paper we studied and focus to improve cost and efficiency of products, the fundamental philosophy behind lean manufacturing is to provide superior quality products for more customers at a significantly lower price and contribute to a more prosperous society. Each and every multinational company is use this tools in broadly now days because this is effectively and accurate tool. Lean tools are very essential for continuous improvement in any organization. Lean is a philosophy to identify and eliminate waste. It also identifies Non value activities in any organization. In many industries, they face problem in inspecting the part bought from the vendor company, this decreases the overall efficiency of the industry, so to improve this we are using lean tools. This project is done at quality department in Katch Motors Private Limited Indore we use Time study, pareto chart, cause & effect diagram. By using these tools, we have increased the efficiency of incoming verification. This will help other industries to increase their efficiency.
Keywords: Lean Manufacturing, Efficiency, Quality, pareto chart, time study and customer satisfaction.
Corresponding Author: AJAY KUMAR PAGARE
Access Online On:
www.ijpret.com
How to Cite This Article:
Ajay Kumar Pagare, IJPRET, 2018; Volume 6 (8): 1-10 PAPER-QR CODE
SPECIAL ISSUE FOR
NATIONAL LEVEL CONFERENCE
Organized by G. V. S. E. T., Jaipur. Available Online at www.ijpret.com2 INTRODUCTION
As a lean manufacturing is a technique to reduce human efforts and produce defect free product [2] this project is carried out at Katch Motors Private Limited India in quality department. The aim of the project is to improve the efficiency of incoming verification process by lean tools, this problem was improved to a great extent by using parato chart analysis and cause & effect techniques. At quality department in Katch Motors India Private Limited Indore, loaded vehicle parts bought from Vendor Company are inspected to maintain the quality and standard of the company. During this phase, non value added activity and wastage were seen which resulting in decrease in inspection efficiency. In this project we are dealing with reasons behind this reduced efficiency and also how we are going to eliminate this. From the last one decade Lean Tools had been used by many companies and organizations. In these years it has not only affected the manufacturing industry but, had also proved as a productivity improvement tool for services industries like for example, Hospitality, Medical organizations etc.
Lean manufacturing:
It is important to build a company production system based on this philosophy. Lean manufacturing has endeavored to rationalize production by:
1. Complete eliminating waste in the production process. 2. To build quality into the process.
3. To reduce cost-productivity improvements.
4. To develop its own unique approach towards corporate management.
5. To create and develop integrated techniques that will contribute to corporate operation.
Cost reduction by elimination method
Organized by G. V. S. E. T., Jaipur. Available Online at www.ijpret.com3
to major cost reductions by preventing unneeded losses. To produce high a high quality product is the first commandment of any manufacturing company. The high quality of any product in which many component and parts do not fail and are trouble-free, must be built into it at every process.
Scheduling (Production Process):
It is the process of arranging, controlling and optimizing work and workloads in a production process or manufacturing process. Scheduling is used to allocate plant and machinery resources, plan production processes and purchase materials. It is an important tool for manufacturing and engineering, where it can have a major impact on the productivity of a process. In manufacturing, the purpose of scheduling is to minimize the production of time and costs, by telling a production facility when to make, with which staff, and on which equipment. Production scheduling aims to maximize the efficiency of the operation and reduce costs. Companies use backward and forward scheduling to allocate plant machinery resources, plan human resources, plan production process and purchase materials.
1. Forward scheduling is planning the tasks from the date resources become available to determine the shipping date or the due date.
2. Backward scheduling is planning the tasks from the due date or required by date to determine the start date and /or any changes in capacity required.
The benefits of production scheduling include: 1. Process change over reduction.
2. Inventory reduction, leveling. 3. Reduced scheduling effort. 4. Increased production efficiency. 5. Labor load leveling.
6. Accurate delivery dates quotes. 7. Real time information.
Organized by G. V. S. E. T., Jaipur. Available Online at www.ijpret.com4 Literature Review
Many researchers had given different concepts and innovative ideas to use lean tools in organizations and service industries. They have also used varies lean tools like VSM ,MUDA, 5S KANBAN KAIZEN, etc. all this tools are use in organization for continuous improvement. Apply the lean tool by method time measurement and line balance efficiency and reduce the cycle time in a truck body assembly line and improve efficiency in that product line [1]. Apply the value stream mapping on bearing industry and reduce the work in process and inventory and lead time. In this article gives the information about value stream mapping and gives the methodology for the implementation of VSM. In this research paper to apply the 5s and kanban system for the reduction of work in process inventory and lead time. SCORE is the one of best tool and methodology for improve efficiency of incoming verification it is not only identifies the root cause of an existing problem but also provides better way to identity and eliminate wastes. SCORE methodology scans deeply the organization to identify the existing problem and also the opportunity to get change to the redundant technique or practices.
Methodology
SCORE is one of the best methodologies for implementing lean tools in an industry.
In this is the stage at which the Kaizen event leader must select the process or processes in need of improvement. They must also determine who internally will be affected by the change, who should be involved in making it and how changes will affect customers. 'Select' also refers to choosing the tools and methods to address different performance issues. We have select incoming verification process for improve efficiency Fig. 01 shows incoming verification process here, quantify current capability, including performance and waste. This is also the stage at which the Kaizen event team is confirmed and the members agree on what the programmed entails so that they can communicate it to others consistently. The event leader must clarify the problem statement and the project objective. They should measure historical data. Problem statement at quality department in Katch Motors Indore India Private Limited, commercial vehicle parts bought from Vendor Company are inspected to maintain the quality and standard of the company.
During this phase, non-value added activity and wastage were seen which resulting in decrease in inspection efficiency. In this project we are dealing with reasons behind this reduced efficiency and also how we are going to eliminate this.
Objectives:-
Organized by G. V. S. E. T., Jaipur. Available Online at www.ijpret.com5
Find out Value Added Activities & Non Value Added Activities
Identification and elimination of waste (muda), Organize:-
The team members should now be organized and trained on the methods and scope of the project. This is also a phase of preparation in terms of the workplace, its suppliers, customers, facilities and people, and constitutes the final stage before actual implementation. We have done time study all data shows bellow table for identify NVA activity after that use parato diagram for find more time taken NVA activities because parato deal with 80- 20 principle.
Fig.:- 1 Process Flow Diagram for Verification
Organized by G. V. S. E. T., Jaipur. Available Online at www.ijpret.com6 Table 1:-Time study
Sr. No. Activities Time(Min)
1 Inspection 240.39
2 Material handling 66.83
3 Training 52.86
4 Meeting 25
5 Line Supporting 22
6 Segregation/Rework 20
7 Parts Searching time 18.75
8 5s 12.76
9 personal allowance 9.748
10 Cleaning Parts 6.4
11 Waiting for SAP ID 5.266
Table 2:- NVA activities
Sr. No. Activities Avg. Time(Min) Cumulative Frequency Cumulative %
1 Material handling 66.83 66.83 34.69
2 Training 52.86 119.69 62.14
3 Segregation/Rework 20 139.69 72.52
4 Searching time 18.75 158.44 82.26
5 5s 12.76 171.2 88.88
6 personal allowance 9.748 180.94 93.94
7 Cleaning Parts 6.4 187.34 97.26
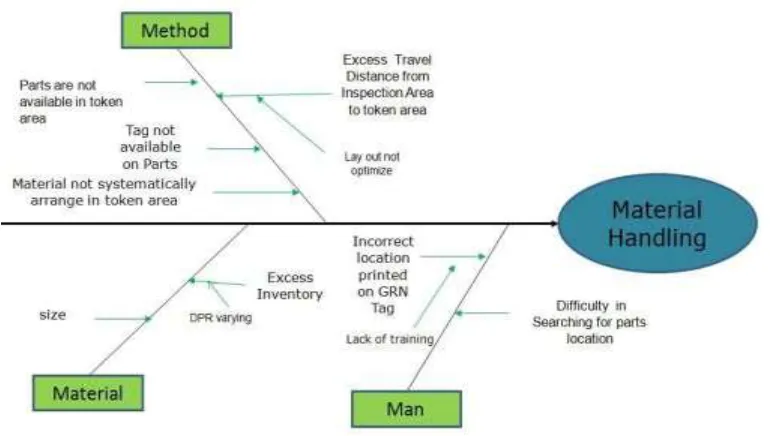
Organized by G. V. S. E. T., Jaipur. Available Online at www.ijpret.com7 Figure No. 01 (Fish bone diagram shows training)
Figure No. 02 (Fish bone diagram shows training)
Run:-
This fourth stage is when the actual improvement event is executed, typically lasting up to five days. This entails making observations, brainstorming and selecting improvements, and testing and implementing them.
Recommended solution
1. 8 Hours training to be provided to new trainees (4 hours theory and 4 hours practical)
2. Training duration should be fixed
3. Training should be provided for the part mounting as per drawing to reduced time for inspection
4. Training should be provided for the inspection equipment for every month
5. Make process flow chart for SAP posting
Organized by G. V. S. E. T., Jaipur. Available Online at www.ijpret.com8
7. Gauge mastering training provide theory as well as practical
8. First check material location then write location on GRN Tag
9. Regular Monitoring of parts in token area
10.Training should be provided to UGC operators
11.Inventory should be controlled
12.Token area should have rack System for different parts
13.DOL/skip parts area should be separate
14.Marking should be done by paint on location in token area
15.Buyer should approach more to local supplier 5S should be followed
Evaluate
As the concluding stage of the methodology, this is the point at which the Kaizen event team can evaluate the results and see the benefits achieved so far. This information is also important as feedback for standardizing new procedures, measuring return on investment and defining future work.
Training duration 15 min per day fixed
GD & T training provided every Saturday
Operator regularly check material on location
Supervisor is regularly monitoring of parts in token area
Marking is done on token area by paint
Organized by G. V. S. E. T., Jaipur. Available Online at www.ijpret.com9 Table 4.51:- Time study after implementation
Sr. No. Activities Time(Min)
1 Inspection 322
2 Material handling 36.83
3 Training 22.5
4 Meeting 25
5 Line Supporting 22
6 Segregation/Rework 20
7 Parts Searching time 6
8 5s 5
9 personal allowance 9.748
10 Cleaning Parts 6.4
11 Waiting for SAP ID 5.266
RESULT AND DISCUSSION
The successfully implementation of the lean tools using SCORE approach was done. This helped the selected industry to improve their Efficiency.
Elimination of non-value added time and performing wrong practices.
Efficiency was increased from 51 % to 67 %.
Inspection time increase 240 minute to 322 minute
Material Handling Time decrease 66.83 minute to 36.83 minute
Training Time decrease 52.86 minute to 22.5 minute
5s time decrees 12.76 minute to 5 minute
CONCLUSION
Organized by G. V. S. E. T., Jaipur. Available Online at www.ijpret.com10
workers. While carrying out the project, it encouraged many other industry owners to implement the same in there industry. This would open new horizons to emerging business for implementing lean tools.
REFERENCE
1. S. santosh kumar, M. pradeep kumar, cycle time of a truck body assembly in an automobile industry by lean principles, Procedia Materials Science 5 ( 2014 ) 1853 – 1862
2. Jafri Mohd Rohania, Seyed Mojib Zahraee, “Production line analysis via value stream mapping: a lean manufacturing process of color industry”, procedia manufacturing 2 (2015, pp6-10.
3. Tomas Rohac, Martin Jenuska. Procedia Engineering 100 (2015) 520 – 529, 25 th DAAAM international symposium on intelligent manufacturing and automation, DAAAM 2014.
4. Praveen Saraswat, Deepak Kumar, and Manoj Kumar Sain, International Journal of Managing
Value and Supply Chains (IJMVSC) Vol. 6, No. 2, June 2015 DOI: 10.5121
5. Taho Yanga, Yiyo Kuob, Chao-Ton Suc, Chia-Lin Houa. Journal of Manufacturing Systems 34
(2015) 66–73
6. K. Venkataramana, Vijaya Ramnath, V.Muthu Kumar, C.Elanchezhiand Procedia Materials Science 6 ( 2014 ) 1187 – 11963rd International Conference on Materials Processing and Characterisation (ICMPC 2014)
7. Ajay Sharma 1 and Dr. Devendra S. Verma2. Department of Mechanical Engineering, Institute
of Engineering & Technology - DAVV, Indore, Madhya Pradesh, India-452017
8. Sanjay T. Purkar1 and A.I.Khandwawala2 1, S.V.C.E.Indore and Research Scholar Bhagwant University, Ajmer) 2,Retired Professor, SGSITS, Indore. Construction of Operating Characteristics Curve for Acceptance Sampling Plan by Using MATLAB Software.