A Study of QSAR Based on Polynomial Modeling in
Matlab
https://doi.org/10.3991/ijoe.v15i15.11566
Fatima Sapundzhi(*)
South-West University "Neofit Rilski", Blagoevgrad, Bulgaria
Tatyana Dzimbova
South-West University "Neofit Rilski", Blagoevgrad, Bulgaria Institute of Molecular Biology “Roumen Tsanev” BAS, Sofia, Bulgaria
Abstract—Mu-opioid receptor (MOR) is an attractive target for in silico
docking experiments. Many potent analgesics currently in use act through the MOR. The main objective of the present work was to find the polynomial func-tion for modelling of the structure-activity relafunc-tionship of a series of MOR ana-logues and the results of the molecular docking with MOR (PDBid:4dkl). The relationship of the biological activity of the ligands with the ChemScore function and with the total energy (MolDock function) was modelled with first- to third-degree polynomials and surface fitted method, assessed by least squares method. The finding, established in the paper, suggests that the third order polynomial could be successfully used for modelling of the relationship between the biolog-ical effect of the MOR analogues and results from docking procedure. Analysis and comparison of the data from in vitro tests and docking studies could help to understand better the relationship between in vitro biological effects and docking studies and to answer whether the models of the biological macromolecules (in our case MOR) correspond to the real 3D structure.
Keywords—computer modelling, polynomial fitting, Matlab, molecular dock-ing, optimization functions, QSAR, 3D modelldock-ing, opioids
1
Introduction
Theopiates are among the oldest drugs for manage a number of medical problems. Morphine is the most active ingredient of opium. It is a widely used painkiller in med-icine, despite side effects such as respiratory depression, constipation, drowsiness, tol-erance, and dependence.
EOP induce analgesia in humans and antinociception in animals [5,6]. They act in several regions of the CNS to mediate pain control, into spinal sites or various regions of the brain. EOP produce physiological effects as preventing diarrhea to inducing eu-phoria, decreasing respiration, stimulating or decreasing cardiovascular function, de-pending on the brain area in which the peptides act, reducing the susceptibility to sei-zures and the mobility of the muscles of gastrointestinal tract [7,8].
EOP can induce decrease respiration, euphoria, reduce susceptibility to seizures, stimulating or decreasing cardiovascular function, depending on the brain area in which the peptides act, reduce the mobility of the muscles of gastrointestinal tract, thereby slowing down transit through food, affect certain behaviors, such as the consumption of food and alcohol [5-10].
Melanocyte-inhibiting factor (MIF-1) (Pro-Leu-Gly-NH2) and Tyr-MIF-1
(Tyr-Pro-Leu-Gly-NH2) are representatives of the endogenous opioid peptides. MIF-1 is an
endogenously derived hypothalamic factor that modulates dopaminergic neurotrans-mission [11]. It’s blocking the effects of opioid receptor activation, while at the same time acting as a positive allosteric modulator of the D2 and D4 dopamine receptor sub-types, potentiating melatonin activity and inhibiting release of other neuropeptides such as alpha-Melanocyte-stimulating hormone [11-18]. Tyr-MIF-1 acts as an opiate agonist [19-22]. It binds selectively and with a high affinity to the mu-opioid receptor (MOR) when compared with the delta-opioid receptor (DOR) and kapa-opioid receptor (KOR) [6,22].
It is known that changes in the structure of the biologically active compounds lead to compounds with a different effect. The analogues that we are used in the current investigation are obtained from a variety of modifications, such as substitution of the tyrosine (Tyr) residue in the first position with a D-isomer of the Tyr, its methylated, brominated and chlorinated analogues having altered amino acid sequences where the leucine residue is replaced by another natural amino acid or its sulfo-analogue, ana-logues of peptides coupled with diamines and cinnamic acid. The results are presented in [22].
The main purpose of this study is to investigate the relationship between the values of the biological activity of MIF-1 and Tyr-MIF-1 analogues previously synthesized and biologically tested and the results of the in silico docking and also calculation of the minimum energy conformation for each obtained ligand-receptor complex after docking procedure. We try to find a function 𝑧 = 𝑓(𝑥, 𝑦) from some class of polyno-mials, that fits given 𝑛 distinct data points {(𝑥+, 𝑦+, 𝑧+)}+-./ in 𝑅2 by the least squares method.
2
Materials and methods
2.1. Receptor-MOR2.2. Ligands
Data for MOR analogues from in vivo test used in the study are presented in Table 1. Table 1. Data for the ligands from in vivo test [22].
Ligands Structures
Paw-pres-sure test,
15 min/g/cm2 1 [D-Tyr(Me) – MIF-1] D-Tyr(Me)-Pro-Leu-Gly-NH2 178,00
2 [MIF-1] Pro-Leu-Gly-NH2 101,00
3 [MIF-1 Arg2] Pro-Arg-Gly-NH
2 110,00
4 [MIF-1Cav2] Pro-Cav-Gly-NH
2 130,00
5 [MIF-1 Eda SA] Pro-Leu-Gly-ethylendiamine-cinnamic acid 206,00 6 [MIF-1Ile2] Pro-Ile-Gly-NH
2 223,00
7 [MIF-1Lys2] Pro-Lys-Gly-NH
2 128,00
8 [MIF-1 Pda SA] Pro-Lys-Gly-propylenediamine-cinnamic acid 230,00 9 [MIF-1sLys2] Pro-sLys-Gly-NH
2 111,00
10 [SA – Tyr - MIF-1 Cav3] Cinnamic acid-Tyr-Pro-Cav-Gly-NH
2 135,00
11 [SA – Tyr - MIF-1 sLys3] Cinnamic acid-Tyr-Pro-sLys-Gly-NH
2 170,00
12 [Tyr (Me) – MIF – 1] Tyr(Me)-Pro-Leu-Gly-NH2 208,00
13 [Tyr – MIF - 1] Tyr-Pro-Leu-Gly-NH2 246,00
2.3. Computational tools
Molecular docking experiments with MOR and the investigated ligands, presented in Table 1 were performed by software GOLD 5.2 (Genetic Optimization for Ligand Docking), run on Scientific LINUX 5.5 operating system. All optimization functions embedded in the program were used (GoldScore, ChemScore, ASP and ChemPLP) [23-26]. The values of the ChemScore function shown in Table 2 indicate that there is a signification correlation between the ability of the ligands to bind to the MOR and its analgesic effect [22].
Ligands preparation were done by the program Molegro Molecular Viewer V 2.5 (MMV), (www.clcbio.com). The prepared structures were used for molecular docking by software GOLD 5.2. The total energies of formed ligand-receptor complex after docking were calculated by MMV 2.5, using MolDock scoring function (Eq.1) [27]. For analyzing the docking results, it was used Ligand Energy Inspector tool of the gram. It allows getting detailed information about the energy interactions for the pro-tein-ligand complex.
𝐸45678= 𝐸+/987+ 𝐸+/97; (1) Where 𝐸45678 is a docking scoring function, 𝐸+/987 is ligand-protein interaction en-ergy, and 𝐸+/97; is internal energy of the ligand [33].
𝑧 = 𝑓(𝑥, 𝑦) = = 𝑎+?𝑥+ @A+B?AC
𝑦? (2)
minimize
(;JJ,…,;JL)𝐹(𝑎@@, … , 𝑎@C) = = N𝑧4− = 𝑎+?𝑥4 +
@A+B?AC
𝑦4?P Q 9
4-.
(3)
Where the values (𝑧., 𝑧Q… , 𝑧9) of the dependent variable 𝑧 represent the values of the biological activity of the investigated ligands; the values (𝑥., 𝑥Q… , 𝑥9) of the inde-pendent variable 𝑥 represent the results from the docking - values of ChemScore opti-mization function (calculated by GOLD); the values (𝑦., 𝑦Q… , 𝑦9) of the independent variable 𝑦 represent the total energies for the ligand-receptor complex formed after docking - the values of MolDock function (calculated by MMV); 𝑎+? are the parameters of the model; 𝑛 is the degree of the polynomial (0 < 𝑖 + 𝑗 < 𝑛); 𝑚 is the number of ligand-receptor complexes (data points). The coefficients of Eq.1 were determined by the least squares method (Eq.3).
The Surface Fitting Toolbox of Matlab was applied for analyzing the behavior of one variable which depended on more independent variables and the individual model could be interpreted as a surface fitting function of the experimental data by least squares method. (http://www.mathworks.com/products/matlab). The following statistic parameters are used to evaluate the goodness of fit:
- SSE (Sum of squares due to error) – it represents the total deviation of the response values from the curve fit to the response values, where the value of SSE near to 0 shows that the model has a smaller random error component and then the fit will be more useful for prediction.
𝑆𝑆𝐸 = = 𝜔+(𝑦+− 𝑦Z+)Q /
+-.
(4)
Where 𝑦+ is the observed data value, 𝑦Z+ is the predicted value from the curve fitting and 𝜔+-the weighting applied to each data point, (𝜔+= 1).
- R-Square (R2) – it measures how successful the fit is in explaining the variation of the data and it is defined as the ratio of the sum of squares of the regression and the total sum of squares about the mean. The values of R-Square closer to 1 indicates that a greater proportion of variance is accounted by the model.
𝑟Q=𝑆𝑆𝑅 𝑆𝑆𝑇= 1 −
𝑆𝑆𝐸
𝑆𝑆𝑇 (5) 𝑆𝑆𝑅 = ∑/ 𝜔+(𝑦Z+− 𝑦`+)Q
- Adjusted R-square – it is the best indicator of the fit quality when two models are compare. It can take on any value less than or equal to 1, with a value closer to 1 indi-cating a better fit.
𝑎𝑑𝑗𝑢𝑠𝑡𝑒𝑑 𝑟Q= 1 −𝑆𝑆𝐸(𝑛 − 1)
𝑆𝑆𝑇(𝑣) (7) - RMSE (Root Mean Squared Error) – it represents the standard error of the regression and an estimate of the standard deviation of the random component in the data. The values of RMSE closer to 0 indicates a fit that is more useful for prediction.
𝑅𝑀𝑆𝐸 = 𝑠 = √𝑀𝑆𝐸 (8) 𝑀𝑆𝐸 - the mean square error (𝑀𝑆𝐸 = 𝑆𝑆𝐸/𝑣).
3
Results and discussion
The neuropeptide hormones are biologically active peptides that affect the CNS. Some investigators reported that after applying the Paw-pressure test to 22 investigated peptides [22], in contrast to the native MIF-1, having a weak analgesic effect, the ana-logues (with the exception of the MIF-1 anaana-logues, modified in a 2-nd position with
arginine, lysine and canavanine) have pronounced antinociceptive effect at 15th min of
the experiment, which is antagonized by Naloxone (1 mg/kg, i.p.). The authors con-cluded that a modified structure of MIF-1 and Tyr-MIF-1 with the non-protein amino acids as well as analogues coupled with cinnamic acid exhibited analgesic effect at the 15th min of the experiment. This effect, in most cases, is significantly stronger than the effect of MIF-1, and in some cases even stronger than the effect of Tyr-MIF-1. Bro-minated analogue of Tyr-MIF-1 and the analogue MIF-1 modified at position 2 with norsulfoleucine exhibit stronger analgesic effect than Tyr-MIF- 1. The effects of other analogues of the MIF-1 and Tyr-MIF-1 are in the range of 101–246 g/cm2. MIF-1 has
the lowest effect of all investigated ligands - 101g/cm2. In the present work, we continue
to investigate the relationship between the chemical structure and the biological activity of 12 selected ligands from all presented in the publication [22]. The structures of the ligands are shown in Table 1.
The values of the scoring function indicate that there is a correlation between the ability of the ligand to bind to the MOR. In order to establish the relationship between the docking results (scoring function) and the values of the biological activity of the investigated analogues, a correlation between these two sets of data is searching for. The correlation analysis is performed by software GraphPad Prism 3.0 (http://www.graphpad.com/scientific-software/prism).
The value of the Pearson’s correlation coefficient is 𝑅 = 0,837. It indicates that the correlation between the experimental data are significant and we can talk about the linear relationship between the values of the scoring function and the values of the in vivo test (the pain tolerance). We can conclude that an increase of the value of the op-timization function increases the affinity of the ligand to the MOR, respectively, and hence increases its biological effects. The values of the ChemScore function shown in Table 1 indicate that there is a correlation between the ability of the ligands to bind to the MOR and their analgesic effect.
In order to establish the relationship between the values of the docking, the values of the minimum energy conformation for each obtained ligand-receptor complex after docking procedure and the data obtained for biological activity it was applied the Sur-face Curve Fitting Toolbox in software Matlab between the three sets of data. The pro-gram provides applications and functions for fitting curves and surfaces to data [28-36].
Table 2. Data for the ligands from in vivo test and docking studies (ChemScore function from GOLD and MolDock function from MMV) [22].
Ligands test, 15 min/g/cmPaw-pressure 2 ChemScore function Values of MolDock function Values of
[D-Tyr(Me) – MIF-1] 178,00 20,6 -99,01
[MIF-1 Arg2] 110,00 5,43 -106,29
[MIF-1Cav2] 130,00 3,27 -84,78
[MIF-1 Eda SA] 206,00 21,1 -128,91
[MIF-1Ile2] 223,00 14,9 -38,11
[MIF-1Lys2] 128,00 10,8 -55,47
[MIF-1 Pda SA] 230,00 16,9 -89,51
[MIF-1sLys2] 111,00 4,18 -73,13
[SA – Tyr - MIF-1 Cav3] 135,00 9,63 -85,44
[SA – Tyr - MIF-1 sLys3] 170,00 13,4 -32,03
[Tyr (Me) – MIF – 1] 208,00 19,6 -106,26
[Tyr – MIF - 1] 246,00 18,7 -69,35
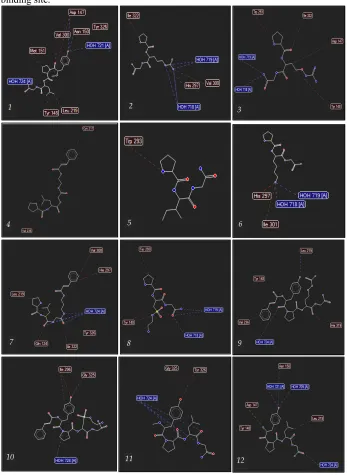
ligands, labeling of amino acids of proteins residues of highest potent one were also performed for better visualization. The modelling results are shown in Figure 1.
The investigated ligands interact with Asp147 which is crucial for the analgesic effect [22]. Moreover, they form multiple hydrogen bonds with residues of the receptor binding site.
Figure 1. Structures of ligands from Table 1. Picture was generated by MMV.
1 2 3
4 5 6
7 8 9
The obtained models were evaluated on how well they fitted the data and how precisely they could predict. The experimental data can be represented as follows:
• the values of 𝑧 represent the values of the biological activity of the ligands [22]; • the values of 𝑥 represent the result from the in silico docking - the values of
ChemScore scoring function [22];
• the values of 𝑦 represent the total energies for ligand-receptor complex – the values of MolDock scoring function in MMV 2.5 [27] for the ligand-receptor complexes forming after the docking in GOLD 5.2.
The values of the main parameters used for surface fitting in Matlab for MOR are presented in Table 2. All polynomial models from first to third degree were evaluated on how well they fitted the data and how precisely they could predict. The models were estimated with the statistical criteria of goodness of fit – SSE, R2, adjusted R2, RMSE. The results obtained for the statistic parameters are presented in Table 3.
As it can be seen from the results in Table 3 the goodness of fit statistics shows that the obtained model for fitting of the data for MOR with the third degree for 𝑥 and the third degree for 𝑦 is a good one. The polynomial model of third degree is with the highest value of 𝑅Q= 1.0 and the value closer to 1 indicating that a greater proportion of variance is explained by the model. The value of 𝑆𝑆𝐸 = 0.6290 for the cubic poly-nomial are close to 0. Therefore, this value shows that the model of third-degree has a smaller random error component and then the fit will be more useful for prediction. The value of 𝑎𝑑𝑗 𝑅Q= 0.9999 for the cubic polynomial are less than 1. This statistic pa-rameter is a good indicator of the fit quality when two models are compared and with a value closer to 1 indicating a better fit. The value of the 𝑅𝑀𝑆𝐸 = 0.5608 for the third degree of polynomial are closer to 0 and indicate a fit that is more useful for prediction. This shows that the obtained polynomial model for the surface fitting data is a good model and it explains a high proportion of the variability in experimental data, and it is able to predict new observations with high certainty [30-37].
Table 3. Goodness of fit for the polynomial models obtained by the least squares method.
Models Poly(x,y) Degree of x Degree of y SSE R2 Adj R2 RMSE
Poly11 1 1 6988 0.7369 0.6784 27.86
Poly12 1 2 5909 0.7775 0.6503 29.05
Poly21 2 1 5464 0.7942 0.6767 27.94
Poly22 2 2 5456 0.7946 0.6234 30.15
Poly23 2 3 2058 0.9225 0.7159 26.19
Poly32 3 2 177.5 0.9933 0.9755 7.692
Poly31 3 1 1818 0.9315 0.8494 19.07
Poly13 1 3 2804 0.8944 0.7677 23.68
Poly14 1 4 2738 0.8969 0.622 30.21
Poly41 4 1 616.6 0.9768 0.9149 14.33
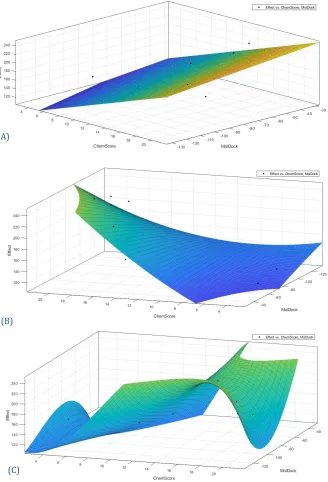
The surface fitting starting from the first-degree to the third-degree polyno-mial of the experimental data (Table 2) is presented in Figure 2 (A, B, C). The biological activity of the ligands as a function of the values of ChemScore function of docking procedure and the values of the total energies was presented in Figure 3 (A, B and C) with a polynomial surface fitting of first to third order in Matlab. As it can be seen from the graphical representation of the experimental data (Table 2) the best polynomial surface fitting is obtained for third order of polynomial model (Figure 3 C).
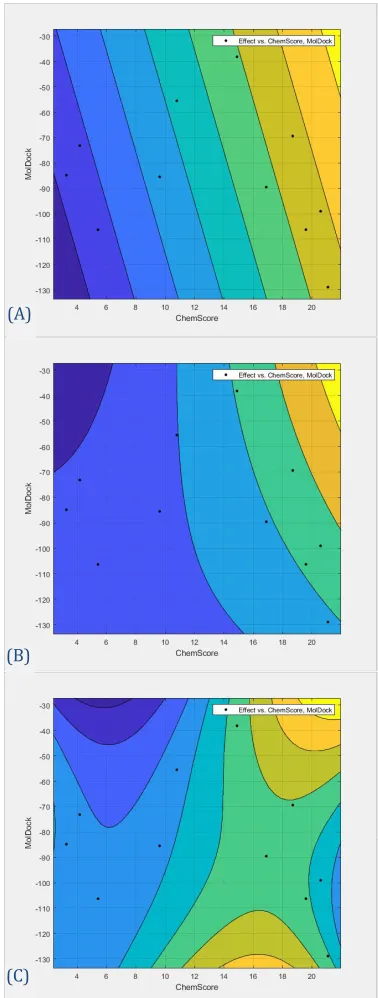
A graphic representation of the relationship between the three numeric varia-bles in 2D is presented in Figure 3 (A, B, C). The values of the ChemScore function and the values of total energies are for 𝑋 and 𝑌 axis for MOR (PDBid:4dkl), where the values of the biological activity are for contour levels. For the fitting by a cubic polynomial in 3D the contour plot (Figure 3 C) makes it easier to see points that have the same height. The contour plots allow precise examination and analysis of the shape of the surface.
The residual plot for obtained polynomial model is presented in Figure 4. It provides visual displays for assessing how well the model fits the data, for evalu-ating the distribution of the residuals, and for identifying influential observations. The top plot of residual diagram shows that the residuals are calculated as the ver-tical distance from the data point to the fitted curve. The bottom plot displays the residuals relative to the fit, which is the zero line. As it can be seen in Figure 4 (C) the obtained model is randomly scattered around zero. This indicates that the pol-ynomial model of third degree describes the experimental data in a good way.
The best results for fitting of experimental data according to the results in Ta-ble 3 were obtained for surface fitting by a cubic polynomial in three-dimensional for determining the relationship between biological activities and docking results of investigated compounds. By using a polynomial least squares surface fitting technique, a third order polynomial was fitted to the data and it is represented as follow:
Figure 2. A three-dimensional surface fitting of experimental data with polynomials of first to third degree, which representing the biological activity as a function of the values of ChemScore scoring function from docking procedure and the values of the total energy for ligand-receptor complex. The surface fitting with the 1-st degree of polynomial model is presented in (A); with
the 2-nd degree in (B) and the 3-rd degree in (C). The diagrams were generated by Matlab. (A)
(B)
Figure 3. A 2D contour plot of 3D surface in the Figure 3 (A, B, C). X axis represents the values of ChemScore function and Y axis represents the values of total energies: (A) the 1-st degree;
(B) the 2-nd degree (C) the 3-rd degree of the polynomial fitting. The diagrams were generated
by Matlab.
(A)
(B)
Figure 3. The Residuals Plot for the obtained polynomial models: (A) the first degree of poly-nomial fitting; (B) the second degree of polypoly-nomial fitting; (C) the third degree of the polypoly-nomial fitting. These diagrams were generated with the Matlab.
(A)
(B)
Table 4. The mean values (confidence bounds) of the coefficients of the third order polyno-mial model chosen as optimal model for MOR.
Coefficients Mean Value (with 95% confidence bounds) 𝑎@@ 190.8 (188.7, 192.9)
𝑎.@ 105.9 (102.5, 109.3) 𝑎@. -13.41 (-17.53, -9.279) 𝑎Q@ -30.69 (-33.29, -28.09) 𝑎.. 33.07 (30.79, 35.35) 𝑎@Q 10.15 (7.014, 13.29) 𝑎2@ -48.38 (-50.96, -45.81) 𝑎Q. 26.7 (21.66, 31.74) 𝑎.Q 20.14 (17.39, 22.88) 𝑎@2 -6.861 (-8.106, -5.617)
Curve fitting of experimental data by polynomial models are commonly used be-cause they have a simple form and they are computationally easy to use. The regression function of the models is linear in terms of the unknown parameters and this allows easy to find the optimal regression coefficients using least squares method.
The obtained polynomial model of third degree for fitting the experimental data showed good fitting properties and significant predictive ability(𝑅Q= 1.0, 𝑆𝑆𝐸 = 0.6290, 𝑎𝑑𝑗 𝑅Q= 0.9999, 𝑅𝑀𝑆𝐸 = 0.5608). Therefore, this model is suitable for de-termination the relationship structure-biological activity. This would be helpful in shortening the drug design process.
The in silico docking experiments were applied to determine the interactions be-tween the studied MIF-1 and Tyr-MIF-1 ligands and the MOR. From the relationship found between the docking results and the in vivo test, we could predict the biological effect of newly synthesized analogues, which is much higher than other compounds in the tested series. For some work along these lines, see [38-48].
4
Conclusion
The best results for fitting of experimental data according to the results in Table 1 were obtained for surface fitting by a cubic polynomial in three-dimensional for deter-mining the relationship between biological activities and docking results of investigated compounds. The surface fitting by polynomial of the third order has the best fit, as-sessed by least squares method. The finding, established in the current study, suggests that: the third order polynomial could be successfully used for modelling the relation-ship between the biological activity of the mu-opioid analogues and the docking results; and the combination of the ligand-based and the structure-based approaches of virtual screening is a reliable search of effective mu-opioid candidates. The polynomial surface fitting model was obtained by Surface Fitting Toolbox in Matlab.
Analysis and comparison of the data from in vivo and docking experiments could help to understand better the relationship between the biological effects of the com-pounds and in silico docking and to answer whether the models of the biological mac-romolecules (MOR) correspond to the real 3D structure. The obtained model is appli-cable for predicting the efficacy of compounds with known score and total energy. This opens the scope for further research.
5
Acknowledgment
This paper is partially supported by SWU “Neofit Rilski”, Bulgaria, Project RPY – B4/19; Project of the National Science Fund of Bulgaria, BNSF Н27/36; National Sci-entific Program "Information and Communication Technologies for a Single Digital Market in Science, Education and Security (ICTinSES)", financed by the Ministry of Education and Science.
6
References
[1]Reinscheid R., Nothacker H., Bourson A., et. al. (1995).Orphanin FQ: a neuropeptide that activates an opioidlike G protein-coupled receptor.Science. 270, 792-794.
https://doi.org/10. 1126/science.270.5237.792
[2]Le Merrer J., Becker, J., Befort K., Kieffer L.(2009).Reward processing by the opioid system in the brain. Physiol Rev.89(4),1379–1412
https://doi.org/10.1152/physrev.00005.2009
[3]Kapitzke D., Vetter I., Cabot P. (2005). Endogenous opioid analgesia in peripheral tissues and the clinical implications for pain control.Ther Clin Risk Manag. 1(4), 279–297. [4]Goodman R., Parfitt D., Evans N., Dahl G., KarschF. (1995). Endogenous opioid peptides
control the amplitude and shape of gonadotropin-releasing hormone pulses in the ewe. Endo-crinology. 136(6), 2412-20. https://doi.org/10.1210/endo.136.6.7750462
[5]Meites J., Bruni J., Van Vugt D., Smith A. (1979). Relation of endogenous opioid peptides and morphine to neuroendocrine functions.Life Sciences. 24 (15), 1325-1336.
https://doi.org/10.1016/0024-3205(79)90001-8
[6]Bloom F., Segal D., Ling N., Guillemin R. (1976). Endorphins: profound behavioral effects in rats suggest new etiological factors in mental illness. Science.194, 630–632.
https://doi.org/10.1126/science.185694
[8]Vaupel D., Lange W., London E. (1993). Effects of verapamil on morphine-induced eupho-ria, analgesia and respiratory depression in humans.J Pharmacol Exp Ther.267(3),1386-94. [9]Ghelardini C., Di Cesare Mannelli L., Bianchi E. (2015). The pharmacological basis of
opi-oids. Clin Cases Miner Bone Metab. 12(3), 219–221.
https://doi.org/10.11138 /ccmbm/2015.12.3.219
[10]Herz A. (1997). Endogenous opioid systems and alcohol addiction. Psychopharmacology. 129, 99–111.
https://doi.org/10.1007/s002130050169
[11]Pert C., Snyder S. (1973). Opiate receptor: Demonstration in nervous tissue. Science. 179, 1011–1014.
https://doi.org/10.1126/science.179.4077.1011
[12]Mishra R., Chiu S., Chiu P., Mishra C. (1983). Pharmacology of L-prolyl-L-leucyl-glycina-mide (PLG): a review.Methods Find Exp Clin Pharmacol.5 (4), 203-33.
[13]Pan W., Kastin A. (2007). From MIF-1 to endomorphin: the Tyr-MIF-1 family of peptides. Peptides.28(12), 2411–2434.
https://doi.org/10.1126/science.179.4077.1011
[14]Chiu S., Mishra R. (1979). Antagonism of morphine-induced catalepsy by L-prolyl-L-leucyl-glycinamide. European Journal of Pharmacology. 53 (2), 119–25.
https://doi.org/10.1016 /0014-2999(79)90156-0
[15]DickinsonS., Slater P.(1980).Opiate receptor antagonism by L-prolyl-L-leucyl-glycinamide, MIF-I. Peptides. 1 (4), 293–299.
https://doi.org/10.1016/0196-9781(80)90006-6
[16]Contreras P., Takemori A. (1984).Effect of prolyl-leucyl-glycinamide and alpha-melano-cyte-stimulating hormone on levorphanol-induced analgesia, tolerance and dependence. Life Sci-ences. 34 (26), 2559–2566.
https://doi.org/10.1016/0024-3205(84)90041-9
[17]Ehrensing R., Kastin A., Michell G. (1984). Antagonism of morphine analgesia by prolyl-leucyl-glycinamide (MIF-1) in humans. Pharmacology Biochemistry and Behavior. 21(6), 975–978.
https://doi.org/10.1016/S0091-3057(84)80083-0
[18]Galina Z., Kastin A. (1986).Existence of antiopiate systems as illustrated by MIF-1/Tyr-MIF-1. Life Sciences. 39 (23),2153–2159.
https://doi.org/10.1016/0024-3205(86)90391-7
[19]Bocheva A., Dzambazova-Maximova E. (2004). Antiopioid properties of the TYR-MIF-1 family. Methods and Findings in Experimental and Clinical Pharmacology. 26 (9), 673–677.
https://doi.org/10.1358/mf.2004.26.9.872564
[20]Nair R., Kastin A., Schally A. (1971). Isolation and structure of hypothalamic MSH release-inhibiting hormone. Biochem Biophys Res Commun.43, 1376–1425.
https://doi.org/10. 1016/S0006-291X(71)80026-8
[21]Kastin A., Hahn K., Zadina J. (2001). Regional differences in peptide degradation by rat cere-bral microvessels: a potential novel regulatory mechanism for communication between blood and brain. Life Sci. 69, 1305–1312.
[22]Kalauzka R., Dzimbova T., Bocheva A., Pajpanova T. (2015).MIF-1 and Tyr-MIF-1 ana-logues containing unnatural amino acids: synthesis, biological activity and docking stud-ies.Med Chem Res.24, 2393–2405.
https://doi.org/10.1007/s00044-014-1302-8
[23]Shim J., Coop A., MacKerell A. (2013). Molecular Details of the Activation of the μ-opioid receptor. J Phys Chem B. 117(26), 7907–7917.
https://doi.org/10.1021/jp404238n
[24]GOLD, version 5.2 UserGuide, CCDC Software Ltd.: Cambridge, UK, 2010.
[25]Jones G., Willett P., Glen R., Leach A, Taylor R. (1997). Development and validation of a genetic algorithm for flexible docking. J. Mol. Biol. 267, 727–748.
https://doi.org/10.1 006/jmbi.1996.0897
[26]Verdonk M., Cole J., Hartshorn M., Murray C., Taylor R. (2003). Improved protein–ligand docking using GOLD. Proteins. 52, 609-623.
https://doi.org/10.1002/prot.10465
[27]Thomsen R., Christensen M. (2006). MolDock: a new technique for high-accuracy molecu-lar docking.J. Med. Chem. 49, 3315-3321.
https://doi.org/10.1021/jm051197e
[28]Lancaster P., Salkauskas K. (1979). Surfaces generated by moving least squares methods. Ser. C:Math. Phys. Sci. 49, 91–102.
[29]Sun D., Whitty A., Papadatos J., Newman M., Donnelly J., Bowes S., Josiah S. (2005). Adopting a practical statistical approach for evaluating assay agreement in drug discovery J. Biomol. Screen.10, 508–516.
https://doi.org/10.1177/1087057105275725
[30]Sapundzhi F. (2015). Mathematical and computer modelling of ligand-target interactions. PhD desertion. South-West University “Neofit Rilski”, Blagoevgrad, Bulgaria.
http://rd.swu.bg/media/40833/avtoreferat.pdf.
[31]Sapundzhi F., Dzimbova T., Pencheva N., Milanov P. (2016). QSAR modelling and molec-ular docking studies of three models of delta opioid receptor. Bulgarian Chemical Commu-nications. 49, Special Issue E, 23-30.
https://bcc.iche.bas.bg/
[32]Sapundzhi F., Dzimbova T., Pencheva N., Milanov P. (2015). Surface fitting of the results of molecular docking and the biological activity of δ-selective enkephalin analogues, Pro-ceedings of the Sixth International Scientific Conference - FMNS2015, 10-14 June, Blagoevgrad, Bulgaria. 1, 104-112.
[33]Sapundzhi F., Dzimbova T., Pencheva N., Milanov P. (2016). QSAR modelling and molec-ular docking studies of three models of delta opioid receptor. Bulgarian Chemical Commu-nications. 49, Special Issue E, 23-30.
https://bcc.iche.bas.bg/
[34]Sapundzhi F., Dzimbova T., Pencheva N., Milanov P. (2015). Surface fitting of the results of molecular docking and the biological activity of δ-selective enkephalin analogues, Pro-ceedings of the Sixth International Scientific Conference-FMNS2015, 10-14 June, Blagoevgrad, Bulgaria. 1, 104-112.
[36]Sapundzhi F., Dzimbova T., Pencheva N., Milanov P. (2015).Exploring the interactions of enkephalin and dalargin analogues with the mu-opioid receptor. Bulgarian Chemical Com-munications. 2, 613-618.
https://bcc.iche.bas.bg/
[37]Sapundzhi F., Dzimbova T., Pencheva N., Milanov P. (2016). Comparative evaluation of four scoring functions with three models of delta opioid receptor using molecular docking. Der Pharma Chemica. 8, 118-124.
https://doi.org/10.14806/ej.18.A.446
[38]Sapundzhi F., Dzimbova T., Pencheva N., Milanov P. (2018). Molecular docking experi-ments of cannabinoid receptor. Bulgarian Chemical Communications. 50, Special Issue B, 2018, 44-48.
https://doi.org/10.14806/ej.18.A.446
[39]Sapundzhi F., Popstoilov M. (2018). Optimization algorithms for finding the shortest paths. Bulgarian Chemical Communications. 50, Special Issue B, 115-120.
[40]Dzimbova T., Sapundzhi F., Pencheva N., Milanov P. (2013). Computer modeling of human delta opioid receptor. Int. J. Bioautomation. 17, 5-16.
http://biomed.bas.bg /bioautomation/2013/vol_17.1/files/17.1_01.pdf
[41]Dzimbova T., Sapundzhi F., Pencheva N., Milanov P. (2012). Computer modeling of human mu-opioid receptor. Journal of Peptide Science. 18, Supplement 1, S84-S84.
https://doi.org/10.14806/ej.18.A.446
[42]Sapundzhi F., Dzimbova T. (2018). Computer modelling of the CB1 receptor by molecular operating environment. Bulgarian Chemical Communications. 50, Special Issue B, 15-19.
https://bcc.iche.bas.bg/
[43]Sapundzhi F., Dzimbova T., Pencheva N., Milanov P. (2014). GOLD scoring functions com-parison to establish the relationship structure-biological action. Journal of Peptide Science, 20 (S1), S294.
[44]Sapundzhi F. (2019). Computer Simulation and Investigations of the Roof Mount Photovol-taic System. International Journal of Online and Biomedical Engineering. 15 (12), 88-96.
https://doi.org/10.3991/ijoe.v15i12.10869
[45]Sapundzhi F. (2019). Scoring Functions and Modeling of Structure-Activity Relationships for Cannabinoid Receptors. International Journal of Online and Biomedical Engineering. 15 (11), 139-145.
https://doi.org/10.3991/ijoe.v15i11.10893
[46]Sapundzhi F. (2019). Моделиране на взаимовръзката структура – биологичн аактивност, Университетско издателство "Неофит Рилски", Благоевград, ISBN 978-954-00-0191-3.
[47]Sapundzhi F. (2019). Матемaтическо и компютърно моделиране на лекарствено-рецепторни взаимодействия, Университетско издателство "Неофит Рилски", Благоевград, ISBN 978-954-00-0190-6.
[48]Sapundzhi F., Prodanova K., Lazarova M. (2019) Survey of the scoring functions for pro-tein-ligand docking. AIP Conference Proceedings, 2172, 100008 1-6,
7
Authors
Fatima Sapundzhi is Chief Assistant Professor in Department of Communication and Computer Engineering and Technologies, Faculty of Engendering, member of Uni-versity Center for Advanced, Bioinformatics Research, in South-West UniUni-versity "Neofit Rilski", Blagoevgrad, Bulgaria. PhD on Informatics. Scientific Interest: com-puter modelling, bioinformatics, programming, biotechnology, drug design. Email: [email protected].
Tatyana Dzimbova is Associate Professor in Department of Anatomy and physiol-ogy, member of University Center for Advanced, Bioinformatics Research in South-West University "Neofit Rilski", Blagoevgrad and Assistant Professor in Department of Molecular design and biochemical pharmacology, Institute of Molecular Biology “Roumen Tsanev”, Bulgarian Academy of Sciences, Bulgaria. Scientific Interest: pep-tide chemistry, biochemistry, computer modeling.
![Table 2. Data for the ligands from in vivo test and docking studies (ChemScore function from GOLD and MolDock function from MMV) [22]](https://thumb-us.123doks.com/thumbv2/123dok_us/556276.2055055/6.595.123.475.449.624/table-ligands-docking-studies-chemscore-function-moldock-function.webp)