Effective moisture diffusivity and mathematical modeling of
drying compost pellet
Ghafour Absalan, Mohammad Hossein Kianmehr
*, Akbar Arabhosseini
(Department of Agrotechnology, College of Abouraihan, University of Tehran, Tehran, Iran)
Abstract: Compost compression processes, such as pelleting, increase bulk density, improve storability, reduce transportation costs and make easier materials handling using existing equipment for handling and storage of grains. It is important to prevent quality deterioration of pellets in long time storage. Therefore, it is necessary to reduce the moisture content of the pellets to less than 20% or less. In this research the drying kinetics of compost pellets were studied at air temperatures of 50°C, 60°C and 70°C, air velocities of 0.5, 1 and 1.5 m/s , particle sizes of 1.18 and 2 mm and pellet diameters of 6 and 8 mm. The maximum effective moisture diffusivity (1.78×10⁻⁹ m2/s ) was obtained at air velocity of 1.5 m/s, air temperature of 70°C, particle size of 1.18 mm and pellet diameter of 8 mm. The activation energy of compost pellets varied from 25.88 to 57.4 kJ/mol under different conditions. The Page model was selected as the most suitable model, based on the statistical analysis.
Keywords: drying kinetics, effective moisture diffusivity, mathematical modeling, pellet
Citation: Absalan Gh, M. H. Kianmehr, and A. Arabhosseini. 2016 Effective moisture diffusivity and mathematical modeling of drying compost pellet. Agricultural Engineering International: CIGR Journal, 18 (2):156-169.
1 Introduction
1Every day a huge amount of organic wastes generate
by municipal, agricultural and agro-industrial activities
and removal of the wastes causes energetic, economic
and environmental problems (Castaldi and Melis 2002).
In recent years, composting has become an interesting
topic of the social demand for waste treatment technology
and for organic agricultural products. Composting is a
relevant method for waste treatment as a high level
efficient method for waste disposal which enables
recycling of organic matter (Greenway and Song 2002).
Biomass materials, such as manures and farmyard
compost from urban waste have high moisture content
and high volume, which are non-uniform materials and
cause limitation in usage of such materials. Densification,
such as pelleting, is a solution for these problems which
increase bulk density, improve storability, reduce
Received date: 2016-01-08 Accepted date: 2016-04-03
*Corresponding author: Mohammad Hossein Kianmehr,
Department of Agrotechnology, College of Abouraihan, University of Tehran, Tehran, Iran. Email: [email protected]
transportation costs, and make these materials easier to
handle. In such conditions, the pellets become better
suited and extremely cost effective to transport over long
distances. In parallel, less storage space is required during
the off season because of the high compactness of the
pellets. The compost pellets can be applied by various
kinds of existing machinery because of the uniform in
size. They are also strong enough to transport and spread
in the field by machine without disintegrating (Zafari and
Kianmehr 2014). Deterioration of pellets during storage
period is important in order to keep quality of the
compost. More molds generate on the surface of compost
pellets than ordinary compost with the same moisture
content (Absalan et al., 2015). Deterioration is very
noticeable, if mature composts are used to make the
pellets. It is advised to reduce the moisture content of the
pellets to less than , because deterioration by
condensation is caused even at moisture content
(Hara, 2001). Produced pellets were dried at ambient
temperature until their moisture content reached about 12%
(Zafari and Kianmehr 2012). Therefore, the compost
June, 2016 Effective moisture diffusivity and mathematical modeling of drying compost pellet Vol. 18, No. 2 157
moisture content. One of the most important aspects in
drying technology is modelling of the drying process
(Khazaei et al., 2008) and there has been some literature
about drying and modeling drying of Biomass (Tumuluru
et al., 2010; Chen et al., 2013; Yancey et al., 2013;
Tumuluru, 2010). Physical and thermal properties of
agricultural products such as heat and mass transfer,
moisture diffusion and energy of activation are also
required for ideal dryer design (Aghbashlo et al., 2008).
The aim of this study was a) determination the effect of
drying air velocity, air temperature, particle size and
pellet diameter on dried compost pellets and b) evaluation
of the fitting of the drying experimental data to five
mathematical models available in the literature.
2 Materials and methods
2.1 Sample preparation for pelleting
Compost was obtained from composting laboratory
in College of Abouraihan, University of Tehran and
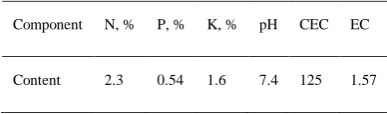
prepared for experiments. A chemical analysis of the
compost was conducted by chemical analytical laboratory,
University of Tehran (Table 1).
Table 1 Chemical analysis of the compost
Component N, % P, % K, % pH CEC EC
Content 2.3 0.54 1.6 7.4 125 1.57
The samples were screened through two sieves with
sizes of 2 and 1.18 mm (meshes of 10 and 16, the
American standard). Single screw extruder was used for
producing the pellets the materials were compressed into
the die installed at the end of the machine. Pellets with
diameters of 6 and 8 mm were produced for each group
of material size, which were sieved by different meshes.
Initial moisture content of compost pellet was 46.21%.
2.2 Drying experiments
The drying experiments were performed at air
temperatures of 50, 60 and and air velocities of
, and 1.5 m s , then the effective moisture
diffusivity, energy of activation of thin-layer drying pellet
of compost were determined at each condition. The
drying experiments were performed by using a laboratory
scale batch dryer, developed at the Department of
Agrotechnology, College of Abouraihan, University of
Tehran (Figure 1).
During the experiments, the ambient relative air
humidity was about – while the ambient air
temperature was about 18-23 . Hot air orientation to the
samples was vertical (upward). In order to achieve a
desirable steady state condition, the dryer turned on about
20 min before each experiment. An inverter was fixed to
control the air velocity through controlling the speed of
was used to regulate the required air velocity. Before each
experiment, the samples were removed from the cold
store and placed in a plastic bag in the laboratory to reach
to the room temperature. Then, the pellets were spread in
a thin layer ( mm) on the tray and placed in the
dryer. The sample weight was measured and recorded
every 10 minutes by using a digital balance with an
accuracy of g. The drying experiments continued
until the mass between the two consecutive weighing was
less than 0.05 g. After drying, the final moisture content
of the samples were determined and considered as the
equilibrium moisture content to calculate the moisture
ratio (MR) quation1.
t e
e (1)
Where is the moisture content (% d.b.), is
the initial moisture content (% d.b.), and is the
equilibrium moisture content (% d.b.), of the sample or
final moisture content in this research.
2.3 Determination of the effective diffusivity
Fick’s second law of diffusion Equation (2) has been
widely used to describe the drying process and interpret
the experimental drying data during the falling rate period
since internal mass transfer controls the drying process
(Crank. 1975). The moisture diffusion is one of the
main parameters that described this drying process so the
Equation (2) can be used to interpret the experimental
drying data (Celma et al., 2008; Chen et al., 2012). In
this model the dependent variable is the moisture ratio
(MR) which relates to the gradient of the sample moisture
content at time t to both initial and equilibrium (final)
moisture content (Vega-Gálvez et al., 2010).
t e
e= ∑n ne p ( n efft
r ) (2)
The Equation (3) can be used at each constant
drying temperature based on a constant moisture
diffusivity assumption, which predicts a linear behavior
between the mentioned variables (Doymaz, 2008; Chen et
al., 2012).
As time increases, the terms other than the first
approach are equal to zero. Neglecting higher terms of the
equation:
e p( efft
r ) (3)
The temperature dependence of the effective
diffusivity can be represented by an Arrhenius
relationship (Akgun and Doymaz, 2005) (See Equation
(4)).
eff= e p(
g s)
(4)
Where is the universal gas constant
k , is the activation energy, k , is the Arrhenius factor, m2/s and is the absolute
temperature, K. Linear regression analyses were used to
fit the equation to the experimental data to obtain
correlation coefficient (R2).
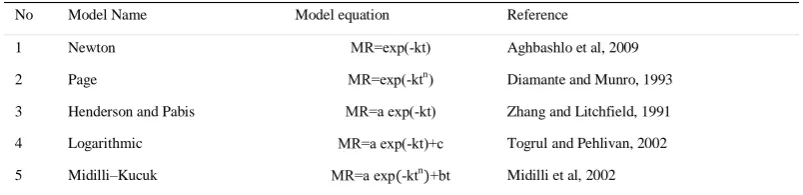
2.4 Mathematical modelling of the drying curves
The drying curves were fitted to five thin layer
drying models, namely, Page, Newton, Henderson and
Pabis, Logarithmic and Midilli-Kucuk (Table 2). The
moisture ratio of compost pellet was calculated using the
mathematical expression of Equation (2).
Table 2 Mathematical models selected to describe the pellet compost drying kinetics
No Model Name Model equation Reference
1 Newton e p( kt) Aghbashlo et al, 2009
2 Page e p( ktn)
Diamante and Munro, 1993
3 Henderson and Pabis e p( kt) Zhang and Litchfield, 1991
4 Logarithmic e p( kt)+c Togrul and Pehlivan, 2002
5 Midilli–Kucuk e p( ktn)+ t
159 June, 2016 AgricEngInt: CIGR Journal Open access at http://www.cigrjournal.org Vol. 18, No. 2
2.4.1 Statistical evaluation of the models
The goodness of fit of the proposed models for
simulating the drying kinetics data was evaluated by
means of statistical tests including determination of
correlation coefficient ( ) Equation (5) chi-square ( )
Equation (6) and root mean square error (RMSE).
Equation (7) (Aghbashlo et al., 2009). Models were fitted
to experimental data by using MATLAB (v. R2013a)
software.
∑ (i e p i pre i)
(6)
√ ∑ (( pre i) ( e p i)) i
(7)
Where is experimental moisture ratio,
is predicted moisture ratio, N is the number of data values
and is the number of parameters.
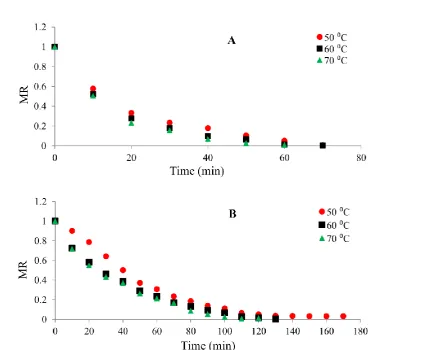
3 Results and discussion
The profiles of experimental moisture ratio as a
function of time during drying of pellet compost samples
at different air-drying temperatures are shown in Figure 2.
The shortest drying time was for the pellets with
particle size 16 and diameter of 6 mm while the longest
drying time was for the pellets with the particle size 10 and
diameter of 8 mm. It can be seen that moisture ratio
decreases continuously with increase temperature. In
addition, drying rate is a function of drying air temperature,
∑ ( pre i e p i) ( e p i e p i) i
(5)
Figure 2 Moisture ratio of compost pellets during drying at different temperatures: a) air velocity of 1.5 m/s,
particle size of 10 (2 mm) and diameter 6mm, b) air velocity of 0.5 m/s, particle size of 16 (1.18 mm), and
diameter of pellet and particle size since at high
temperature ( e g ) lower diameter (6 mm) and
particle size(16 (1.18mm)) leads to shorter time to reach
final moisture content. Similar effects of temperature on
drying kinetics are reported for drying of other materials
(Doymaz et al., 2004; Akgun and Doymaz 2005;
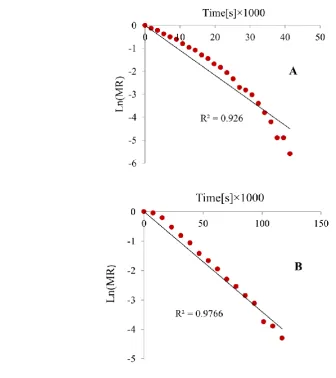
Ghazanfari et al., 2006). Figure 3 shows the Ln (MR)
versus time (s) for drying of compost pellet. The figure
shows that the drying of compost pellet occurred in falling
rate period. The calculated using q ( ) and varied in the range of to m s. The
maximum value of was m s at air
velocity of 1.5 m s, air temperature of , particle size
of 16 (1.18 mm) and pellet diameter of 8 mm (Figure 3a).
The values increased with increasing drying
temperature, air velocity and diameter of pellet due to the
increased surface area. More energy supply would
increase the activity of water molecules when pellet of
compost was dried at higher temperatures, leading to
higher moisture diffusivity. The minimum value of
was m s at air velocity of 1 m/s and, air
temperature of 50 , particle size of 16 (1.18 mm) and
pellet diameter of 6 mm (Figure 3b).
The values obtained in this research were close
to those reported for some other agricultural materials
(Lopez et al., 2000; Montero et al., 2011). The value of
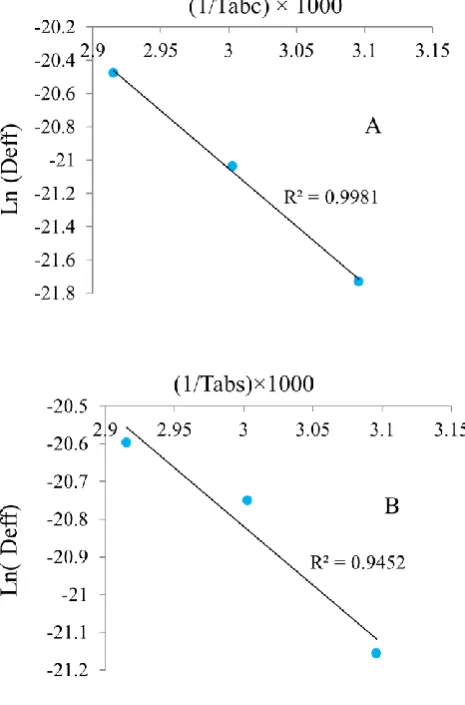
Ln versus 1/Tabs is shown in Figure 4. The energy of
activation ( ) for compost pellet was calculated using Equation 4 which varied from 25.88 to 54.4 kJ/mol for
different level of the examined parameters (air velocity,
June, 2016 Effective moisture diffusivity and mathematical modeling of drying compost pellet Vol. 18, No. 2 161
of was k mol showing a linear relationship due
to the Arrhenius-type dependence ( = 0.9981) at air
velocity of m s, particle size of 10(2 mm) and pellet
diameter of 6 mm (Figure 4a) while the minimum value of
was 25.88 k mol, showing a linear relationship due to
the Arrhenius-type dependence with high ( = 0.9452) at
air velocity of m sand the, particle size of 16(1.18 mm)
and pellet diameter of 8 mm (Figure 4b).
The obtained values of moisture diffusivity for
compost pellets were higher than some agricultural
materials such as poplar sawdust: 12.3 kJ/mol (Chen et al.,
2011), and for dry vegetable waste: 19.82 kJ/mol (Chong
et al., 2008). The experimental data obtained in compost of
pellet drying showed that the drying process occurs mainly
in the falling rate period at all the process temperatures.
The experiential data were fitted to the five mathematical
models in order to evaluate the one which is best for
representing drying kinetics of pellets. The best model was
chosen based on the highest , the least and least
RMSE. Lists the parameter values of the model and
statistical analysis for each condition (from Tables 3 to
Table 8).
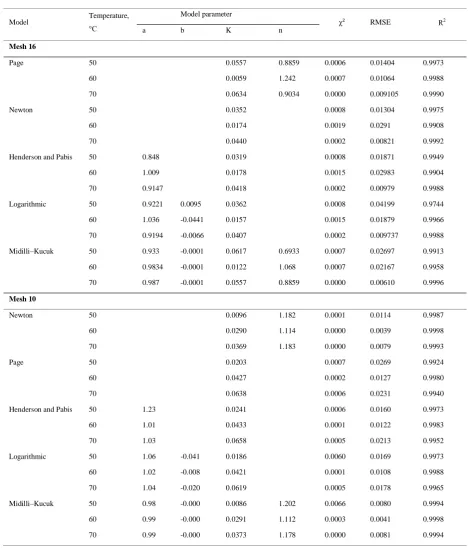
Table 3 Statistical results of five mathematical models at different drying conditions for air velocities of 0.5
m/s and diameter 6 mm
Model Temperature,
Model parameter
χ2 RMSE
a b K n
Mesh 16
Page 50 0.0557 0.8859 0.0006 0.01404 0.9973
60 0.0059 1.242 0.0007 0.01064 0.9988
70 0.0634 0.9034 0.0000 0.009105 0.9990
Newton 50 0.0352 0.0008 0.01304 0.9975
60 0.0174 0.0019 0.0291 0.9908
70 0.0440 0.0002 0.00821 0.9992
Henderson and Pabis 50 0.848 0.0319 0.0008 0.01871 0.9949
60 1.009 0.0178 0.0015 0.02983 0.9904
70 0.9147 0.0418 0.0002 0.00979 0.9988
Logarithmic 50 0.9221 0.0095 0.0362 0.0008 0.04199 0.9744
60 1.036 -0.0441 0.0157 0.0015 0.01879 0.9966
70 0.9194 -0.0066 0.0407 0.0002 0.009737 0.9988
Midilli–Kucuk 50 0.933 -0.0001 0.0617 0.6933 0.0007 0.02697 0.9913
60 0.9834 -0.0001 0.0122 1.068 0.0007 0.02167 0.9958
70 0.987 -0.0001 0.0557 0.8859 0.0000 0.00610 0.9996
Mesh 10
Newton 50 0.0096 1.182 0.0001 0.0114 0.9987
60 0.0290 1.114 0.0000 0.0039 0.9998
70 0.0369 1.183 0.0000 0.0079 0.9993
Page 50 0.0203 0.0007 0.0269 0.9924
60 0.0427 0.0002 0.0127 0.9980
70 0.0638 0.0006 0.0231 0.9940
Henderson and Pabis 50 1.23 0.0241 0.0006 0.0160 0.9973
60 1.01 0.0433 0.0001 0.0122 0.9983
70 1.03 0.0658 0.0005 0.0213 0.9952
Logarithmic 50 1.06 -0.041 0.0186 0.0060 0.0169 0.9973
60 1.02 -0.008 0.0421 0.0001 0.0108 0.9988
70 1.04 -0.020 0.0619 0.0005 0.0178 0.9965
Midilli–Kucuk 50 0.98 -0.000 0.0086 1.202 0.0066 0.0080 0.9994
60 0.99 -0.000 0.0291 1.112 0.0003 0.0041 0.9998
June, 2016 Effective moisture diffusivity and mathematical modeling of drying compost pellet Vol. 18, No. 2 163
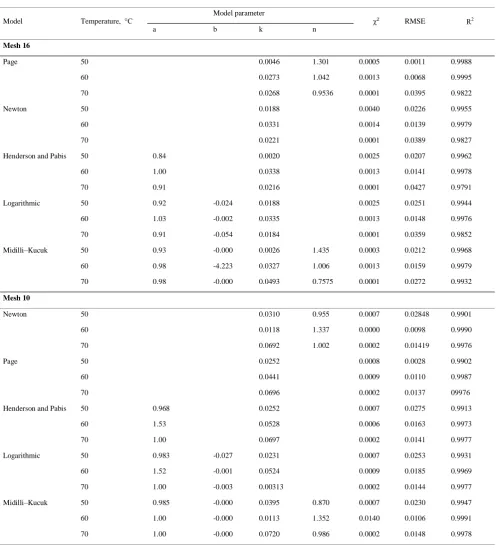
Table 4 Statistical results of five mathematical models at different drying conditions for air velocities of 1 m/s
and diameter 6 mm
Model Temperature,
Model parameter
χ2 RMSE
a b k n
Mesh 16
Page 50 0.0046 1.301 0.0005 0.0011 0.9988
60 0.0273 1.042 0.0013 0.0068 0.9995
70 0.0268 0.9536 0.0001 0.0395 0.9822
Newton 50 0.0188 0.0040 0.0226 0.9955
60 0.0331 0.0014 0.0139 0.9979
70 0.0221 0.0001 0.0389 0.9827
Henderson and Pabis 50 0.84 0.0020 0.0025 0.0207 0.9962
60 1.00 0.0338 0.0013 0.0141 0.9978
70 0.91 0.0216 0.0001 0.0427 0.9791
Logarithmic 50 0.92 -0.024 0.0188 0.0025 0.0251 0.9944
60 1.03 -0.002 0.0335 0.0013 0.0148 0.9976
70 0.91 -0.054 0.0184 0.0001 0.0359 0.9852
Midilli–Kucuk 50 0.93 -0.000 0.0026 1.435 0.0003 0.0212 0.9968
60 0.98 -4.223 0.0327 1.006 0.0013 0.0159 0.9979
70 0.98 -0.000 0.0493 0.7575 0.0001 0.0272 0.9932
Mesh 10
Newton 50 0.0310 0.955 0.0007 0.02848 0.9901
60 0.0118 1.337 0.0000 0.0098 0.9990
70 0.0692 1.002 0.0002 0.01419 0.9976
Page 50 0.0252 0.0008 0.0028 0.9902
60 0.0441 0.0009 0.0110 0.9987
70 0.0696 0.0002 0.0137 09976
Henderson and Pabis 50 0.968 0.0252 0.0007 0.0275 0.9913
60 1.53 0.0528 0.0006 0.0163 0.9973
70 1.00 0.0697 0.0002 0.0141 0.9977
Logarithmic 50 0.983 -0.027 0.0231 0.0007 0.0253 0.9931
60 1.52 -0.001 0.0524 0.0009 0.0185 0.9969
70 1.00 -0.003 0.00313 0.0002 0.0144 0.9977
Midilli–Kucuk 50 0.985 -0.000 0.0395 0.870 0.0007 0.0230 0.9947
60 1.00 -0.000 0.0113 1.352 0.0140 0.0106 0.9991
Table 5 Statistical results of five mathematical models at different drying conditions for air velocities of 1.5 m/s
and diameter 6 mm
Model Temperature,
Model parameter
χ2 RMSE
a b k n
Mesh 16
Page 50 0.0338 0.946 0.0003 0.0181 0.9957
60 0.0926 0.874 0.0002 0.0248 0.9923
70 0.0475 1.091 0.0005 0.0102 0.9988
Newton 50 0.0281 0.0005 0.0214 0.9940
60 0.0631 0.0003 0.0314 0.9870
70 0.0657 0.0009 0.0191 0.9958
Henderson and Pabis 50 0.983 0.0276 0.0004 0.0216 0.9940
60 0.949 0.0599 0.0003 0.0284 0.9900
70 1.07 0.0685 0.0007 0.0169 0.9967
Logarithmic 50 0.983 0.000 0.0276 0.0004 0.0222 0.9936
60 0.952 -0.006 0.0585 0.0003 0.0291 0.9901
70 1.025 -0.009 0.0645 0.0007 0.0181 0.9967
Midilli–Kucuk 50 1.006 -0.000 0.0428 0.884 0.0003 0.0189 0.9962
60 0.997 -0.000 0.1173 0.765 0.0002 0.0169 0.9969
70 1.006 -0.000 0.0550 1.058 0.0005 0.0177 0.9971
Mesh 10
Page 50 0.0606 0.926 0.0007 0.0061 0.999
60 0.0471 1.063 0.0000 0.0081 0.9994
70 0.1619 0.639 0.0000 0.0361 0.9837
Newton 50 0.0469 0.0013 0.0081 0.9992
60 0.0574 0.0001 0.0104 0.9989
70 0.0525 0.0001 0.0688 0.9372
Henderson and Pabis 50 0.988 0.0469 0.0012 0.0103 0.9988
60 1.008 0.0578 0.0001 0.0106 0.9988
70 0.8921 0.4368 0.0001 0.0831 0.9319
Logarithmic 50 0.9208 -0.001 0.0435 0.0011 0.0083 0.9991
60 1.012 -0.006 0.0566 0.0001 0.01003 0.9990
70 0.8889 -0.027 0.0511 0.0001 0.0636 0.9463
Midilli–Kucuk 50 0.9998 -0.000 0.0623 0.916 0.0015 0.0060 0.9996
60 1.001 -0.000 0.0481 1.057 0.0000 0.0090 0.9994
June, 2016 Effective moisture diffusivity and mathematical modeling of drying compost pellet Vol. 18, No. 2 165
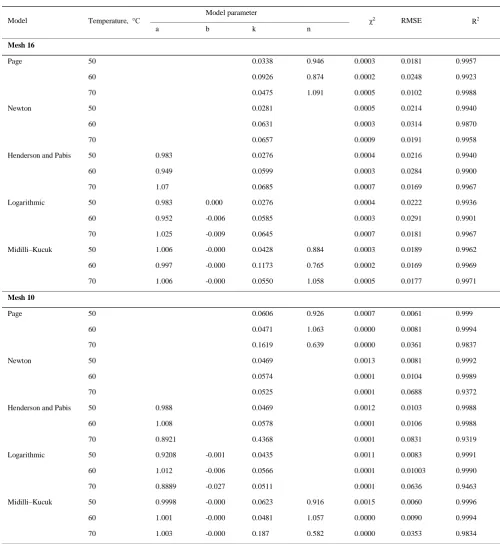
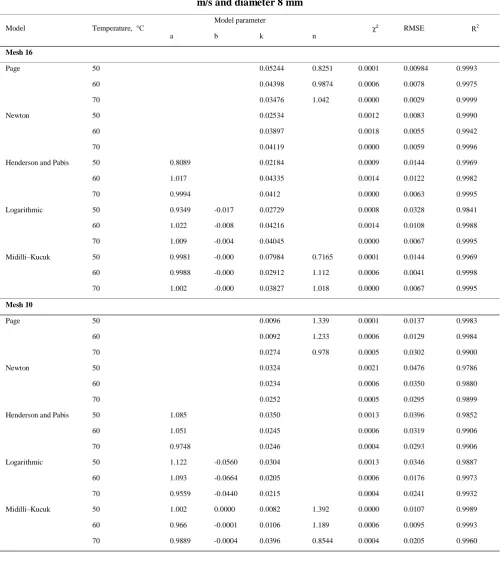
Table 6 Statistical results of five mathematical models at different drying conditions for air velocities of 0.5
m/s and diameter 8 mm
Model Temperature,
Model parameter
χ2 RMSE
a b k n
Mesh 16
Page 50 0.05244 0.8251 0.0001 0.00984 0.9993
60 0.04398 0.9874 0.0006 0.0078 0.9975
70 0.03476 1.042 0.0000 0.0029 0.9999
Newton 50 0.02534 0.0012 0.0083 0.9990
60 0.03897 0.0018 0.0055 0.9942
70 0.04119 0.0000 0.0059 0.9996
Henderson and Pabis 50 0.8089 0.02184 0.0009 0.0144 0.9969
60 1.017 0.04335 0.0014 0.0122 0.9982
70 0.9994 0.0412 0.0000 0.0063 0.9995
Logarithmic 50 0.9349 -0.017 0.02729 0.0008 0.0328 0.9841
60 1.022 -0.008 0.04216 0.0014 0.0108 0.9988
70 1.009 -0.004 0.04045 0.0000 0.0067 0.9995
Midilli–Kucuk 50 0.9981 -0.000 0.07984 0.7165 0.0001 0.0144 0.9969
60 0.9988 -0.000 0.02912 1.112 0.0006 0.0041 0.9998
70 1.002 -0.000 0.03827 1.018 0.0000 0.0067 0.9995
Mesh 10
Page 50 0.0096 1.339 0.0001 0.0137 0.9983
60 0.0092 1.233 0.0006 0.0129 0.9984
70 0.0274 0.978 0.0005 0.0302 0.9900
Newton 50 0.0324 0.0021 0.0476 0.9786
60 0.0234 0.0006 0.0350 0.9880
70 0.0252 0.0005 0.0295 0.9899
Henderson and Pabis 50 1.085 0.0350 0.0013 0.0396 0.9852
60 1.051 0.0245 0.0006 0.0319 0.9906
70 0.9748 0.0246 0.0004 0.0293 0.9906
Logarithmic 50 1.122 -0.0560 0.0304 0.0013 0.0346 0.9887
60 1.093 -0.0664 0.0205 0.0006 0.0176 0.9973
70 0.9559 -0.0440 0.0215 0.0004 0.0241 0.9932
Midilli–Kucuk 50 1.002 0.0000 0.0082 1.392 0.0000 0.0107 0.9989
60 0.966 -0.0001 0.0106 1.189 0.0006 0.0095 0.9993
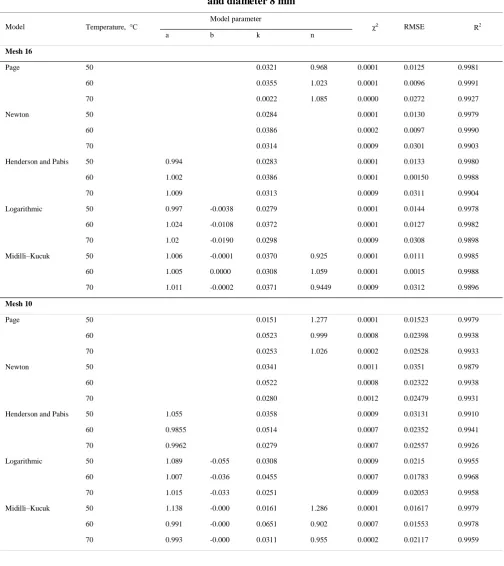
Table 7 Statistical results of five mathematical models at different drying conditions for air velocities of 1 m/s
and diameter 8 mm
Model Temperature,
Model parameter
χ2 RMSE
a b k n
Mesh 16
Page 50 0.0321 0.968 0.0001 0.0125 0.9981
60 0.0355 1.023 0.0001 0.0096 0.9991
70 0.0022 1.085 0.0000 0.0272 0.9927
Newton 50 0.0284 0.0001 0.0130 0.9979
60 0.0386 0.0002 0.0097 0.9990
70 0.0314 0.0009 0.0301 0.9903
Henderson and Pabis 50 0.994 0.0283 0.0001 0.0133 0.9980
60 1.002 0.0386 0.0001 0.00150 0.9988
70 1.009 0.0313 0.0009 0.0311 0.9904
Logarithmic 50 0.997 -0.0038 0.0279 0.0001 0.0144 0.9978
60 1.024 -0.0108 0.0372 0.0001 0.0127 0.9982
70 1.02 -0.0190 0.0298 0.0009 0.0308 0.9898
Midilli–Kucuk 50 1.006 -0.0001 0.0370 0.925 0.0001 0.0111 0.9985
60 1.005 0.0000 0.0308 1.059 0.0001 0.0015 0.9988
70 1.011 -0.0002 0.0371 0.9449 0.0009 0.0312 0.9896
Mesh 10
Page 50 0.0151 1.277 0.0001 0.01523 0.9979
60 0.0523 0.999 0.0008 0.02398 0.9938
70 0.0253 1.026 0.0002 0.02528 0.9933
Newton 50 0.0341 0.0011 0.0351 0.9879
60 0.0522 0.0008 0.02322 0.9938
70 0.0280 0.0012 0.02479 0.9931
Henderson and Pabis 50 1.055 0.0358 0.0009 0.03131 0.9910
60 0.9855 0.0514 0.0007 0.02352 0.9941
70 0.9962 0.0279 0.0007 0.02557 0.9926
Logarithmic 50 1.089 -0.055 0.0308 0.0009 0.0215 0.9955
60 1.007 -0.036 0.0455 0.0007 0.01783 0.9968
70 1.015 -0.033 0.0251 0.0009 0.02053 0.9958
Midilli–Kucuk 50 1.138 -0.000 0.0161 1.286 0.0001 0.01617 0.9979
60 0.991 -0.000 0.0651 0.902 0.0007 0.01553 0.9978
June, 2016 Effective moisture diffusivity and mathematical modeling of drying compost pellet Vol. 18, No. 2 167
The Page models presented very good fits, however,
the Page model contributed the best fitting with the highest
and least and least RMSE. Figure 5 illustrates the
comparison of the experimental and predicted moisture
ratio values using this mathematical expression
(Vega-Gálvez et al., 2010): These results clearly
demonstrated that the Page model fits perfectly the drying
kinetics of pellet of compost.
Table 8 Statistical results of five mathematical models at different drying conditions for air velocities of 1.5 m/s
and diameter 8 mm
Model Temperature,
Model parameter
χ2 RMSE
a b k n
Mesh 16
Page 50 0.0526 0.864 0.0001 0.0098 0.9989
60 0.0759 0.890 0.0001 0.0135 0.9977
70 0.0233 1.226 0.0001 0.0139 0.9980
Newton 50 0.0307 0.0005 0.0052 0.9997
60 0.0522 0.0004 0.0191 0.9952
70 0.0485 0.0012 0.0343 0.9873
Henderson and Pabis 50 1.00 0.0307 0.0004 0.0094 0.9989
60 0.925 0.0504 0.0003 0.0078 0.9992
70 1.054 0.0510 0.0009 0.0307 0.9898
Logarithmic 50 0.970 -0.0092 0.0325 0.0003 0.0202 0.9948
60 0.962 -0.0006 0.0516 0.0003 0.01934 0.9951
70 1.092 -0.0070 0.0427 0.0009 0.01714 0.9968
Midilli–Kucuk 50 0.979 -0.0000 0.0597 0.830 0.0001 0.00974 0.9990
60 0.998 -0.0003 0.0857 0.84 0.0001 0.0087 0.9992
70 0.982 -0.0002 0.0233 1.209 0.0001 0.00988 0.9989
Mesh 10
Page 50 0.0258 1.176 0.0001 0.0181 0.9969
60 0.0092 1.233 0.0002 0.0129 0.9983
70 0.0253 1.026 0.0000 0.0252 0.9933
Newton 50 0.0463 0.0011 0.0311 0.9902
60 0.0234 0.0008 0.0350 0.9880
70 0.0492 0.0001 0.0105 0.9988
Henderson and Pabis 50 1.03 0.0478 0.0009 0.0297 0.9916
60 1.05 0.0245 0.0007 0.0319 0.9906
70 0.977 0.0492 0.0000 0.0109 0.9988
Logarithmic 50 1.081 -0.069 0.0397 0.0009 0.0130 0.9985
60 1.093 -0.066 0.0205 0.0007 0.0176 0.9973
70 1.017 -0.009 0.0479 0.0000 0.0082 0.9993
Midilli–Kucuk 50 1.00 -0.000 0.0342 1.07 0.0001 0.0012 0.9987
60 0.996 -0.000 0.0106 1.189 0.0002 0.0095 0.9993
4 Conclusions
In this paper, the application of Arrhenius equation to
experimental drying data is valid for the operation
conditions employed in this investigation based on an
assumption of diffusive controlling phenomenon allowed
the estimation of moisture diffusivity as well as activation
energy pellet of compost. The values increased with
increasing drying temperature, air velocity and diameter of
pellet due to the increased surface area. More energy
supply would increase the activity of water molecules
when pellet of compost was dried at higher temperatures,
leading to higher moisture diffusivity. The obtained values
of moisture diffusivity for compost pellets were higher
than some agricultural materials such as poplar sawdust
and dry vegetable waste. In order to explain the drying
behavior of compost pellets, the experimental data were
fitted to five different thin layer drying models and the
models were compared according to their , RMSE and
.
References
Absalan Gh., M. H. Kianmehr, A. Arabhosseini, Sh. Kouravand. 2015. Optimization compressive strength biomass pellet from compost using Taguchi method. Agricultural Engineering International: CIGR Journal, 17(1):166-172.
Aghbashlo M., M. H. Kianmehr, S. Khani, and M. Ghasemi. 2009. Mathematical modelling of thin-layer drying of carrot. International Agrophysics, 23(4): 313–317.
Aghbashlo M., M. H. Kianmehr, and H. Samimi-Akhijahani. 2008. Influence of drying conditions on the effective moisture diffusivity, energy of activation and energy consumption during the thin-layer drying of berberis fruit (Berberidaceae). Energy Conversion Management, 49(10): 2865-2871.
Akgun N., and I. Doymaz. 2005. Modelling of olive cake thin-layer drying process. Journal of Food Engineering, 68(4):455-461.
Businelli M., R. Calandra, M. Pagliai, D. Businelli, G. Gigliotti, O. Grasselli, D. Said-Pullicino, and A. Leccese.2007. Transformation of a landfill covering amended with municipal waste compost, Perugia, Italy. Journal of Environment Quality, 36(1):254–261.
Castaldi P., and P. Melis. 2002. Composting of posidoniaoce anica and its use in Agriculture. Microbiology of composting. Springer-Verlag, 425–434.
Celma, A., F. Cuadros, and L. Rodriguez. 2008. Characterisation of industrial tomato by-products from infrared drying process. Food and Bioproducts Processing, 87(4), 282– 291.
Chen D., M. Li, and X. Zhu. 2013. Drying characteristics of powdered wheat straw and Its mathematical modeling. Journal of Agricultural Science Technology, 15(5): 869-877.
Chen, D., Y. Zheng, and X. Zhu. 2012. Determination of effective moisture diffusivity and drying kinetics for poplar sawdust by thermo-gravimetric analysis under isothermal condition . Bioresource Technology, 107(1): 451–455.
June, 2016 Effective moisture diffusivity and mathematical modeling of drying compost pellet Vol. 18, No. 2 169 Chong, C. H., C. L. Law, M. Cloke, C. L. Hii, and L. C. Abdullah.
2008. Drying kinetics and product quality of dried Chempedak. Journal of Food Engineering, 88(4):522– 527.
Crank, J. 1975. Mathematics of diffusion. 2nd ed. London. Oxford University Press.
Diamante, L. M., P. A. Munro.1993. Mathematical modeling of thin layer solar drying of sweet potato slices. Solar Energy, 51(4): 271-276.
Doymaz, I., O. Gorel, and N. A. Akgun. 2004. Drying characteristics of the solid by-product of olive oil extraction. Biosystems Engineering, 88(2): 213–219. Doymaz, I.2005. Influence of pretreatment solution on the drying
of sour-cherry. Journal of Food Engineering, 78(2): 591– 596.
Doymaz, I. 2008. Influence of blanching and slice thickness on drying characteristics of leek slices. Journal of Food Engineering, 47(1): 41–47.
Ghazanfari, A., S. Emami, L. G. Tabil, and S. Panigrahi. 2006. Thin-Layer Drying of Flax Fiber: II. Modeling drying process using semi-theoretical and empirical models. Drying Technology, 24(12): 1637-1642.
Greenway, G. M., and Q. J. Song. 2002. Heavy metal speciation in the composting process. Journal of Environment Monitoring, 4(2): 300–305.
Hara, M. 2001. Fertilizer pellets made from composted livestock manure. Food & Fertilizer Technology Center, 1–12. Khazaei, J., G. R. Chegini, and M. Bakhshiani. 2008. Anovel
alternative method for modeling the effects of air temperature and slice thickness on quality and drying kinetics of tomato slices: superposition technique. Drying Technology, 26(6): 759–775.
Lopez A., A. Iguaz, A. Esnoz, P. Virseda. 2000. Thin layer drying behaviour of vegetable wastes from wholesale market. Drying Technology, 18(4-5): 995–1006.
Midilli, A., H. Kucuk, and Z. Yapar. 2002. A new model for single layer drying. Drying Technology, 20(7): 1503–13. Montero, I. 2011. Thin layer drying kinetics of by-products from
olive oil processing. International Journal of Molecular Science, 12(11): 7885–7897.
Pietsch, W.2002. Agglomeration processes-phenomena, technologies, equipment. Wiley-VCH.
Tumuluru, J. S., L. G.Tabil, A. Opoku, M. R. Mosqueda, and O. Fadeyi. 2010. Effect of process variables on the quality ch r cteristics of pelleted whe t distiller’s dried gr ins with soluble. Biosystems Engineering, 105(4): 466-475. Togrul, I. T., and D. Pehlivan.2002. Mathematical modelling of
solar drying of apricots in thin layers. Journal of Food Engineering, 55(3): 209–216.
Vega-Gálvez, A., M. Miranda,L. P. Díaz, L. Lopez, K. Rodriguez, and K. Di Scala.2010. Effective moisture diffusivity determination and mathematical modelling of the drying curves of the olive-waste cake. Bioresource Technology, 101(19): 7265–7270.
Yancey, N. A., J. S. Tumuluru, C. T. Wright. 2013. Drying, grinding and pelletization studies on raw and formulated iom ss feedstock’s for ioenergy pplic tions Journal of Biobased Materials and Bioenergy, 7(5): 549-558. Zafari, A., M. H. Kianmehr. 2014. Factors affecting mechanical
properties of biomass pellet from compost. Environmental Technology, 35(4): 478-486.
Zafari, A., M. H. Kianmehr. 2012. Effect of raw material properties and die geometry on the density of biomass pellets from composted municipal solid waste. Bioresources, 7(4): 4704-4714.