Evolutionary computation method for pattern
recognition of cis-acting sites
Daniel Howard
∗, Karl Benson
Knowledge and Information Systems Division, QinetiQ Ltd., St. Andrews Road, Malvern, Worcestershire, UK
Abstract
This paper develops an evolutionary method that learns inductively to recognize the makeup and the position of very short consensus sequences, cis-acting sites, which are a typical feature of promoters in genomes. The method combines a Finite State Automata (FSA) and Genetic Programming (GP) to discover candidate promoter sequences in primary sequence data. An experiment measures the success of the method for promoter prediction in the human genome. This class of method can take large base pair jumps and this may enable it to process very long genomic sequences to discover gene specific cis-acting sites, and genes which are regulated together.
© 2003 Elsevier Ireland Ltd. All rights reserved.
Keywords: Genomics; Transcriptomics; Promoter prediction; Eukaryotes; Human DNA; Pattern matching; cis-Acting site; Finite State Automata; Genetic Programming; Evolutionary Computation; Bioinformatics
1. Introduction
Sequencing the complete genome for a variety of organisms is taking place at an unprecedented pace. Meanwhile, computer programs are being developed to scan genomes and to identify likely genes, the trans-acting sites. Yet, genomic sequencing data also presents an opportunity for pattern recognition of cis-acting sites in the genome whose purpose is to attract proteins, the enzymes, which bind DNA to initiate and regulate gene transcription.
By analogy, the trans-acting part of the genome rep-resents the memory of a computer and the cis-acting part of the genome represents a computer program that acts on this memory. Understanding cis-acting sites is essential to providing models of what is the makeup of this computer program and how it operates. Physical and functional differences between two living forms,
∗Corresponding author. Tel.:+44-1684-894480. E-mail address: [email protected] (D. Howard).
such as human and chimpanzee, have much more to do with differences in the execution of this computer pro-gram than with differences in the building blocks (both human and chimp use essentially the same proteins). Another dramatic example is the mutation of the an-tennapedia gene that transforms the antenna into a leg in Drosophila (transcriptional activators are nuclear proteins and are coded by genes that control pattern formation during development). It is also interesting to note that this computer program executes in a sophis-ticated and parallel fashion, as exemplified by poly-merase pausing (e.g. Krum et al., 1995) when tran-scription of a gene halts part way through, and will not resume until a protein, a message, arrives at the scene. Gene regulation is a topic of interest to drug dis-covery research. In order to develop novel anti-viral agents, it becomes necessary to understand how a drug may regulate the expression of genes. An aim of drug discovery, therefore, is to identify the cis-acting sites responsible for co-regulating different genes. Today this process could be assisted by data and findings
from gene chip experiments; results which could in turn be analyzed by software for pattern recognition of cis-acting sites to gain this understanding. Com-puter programs that identify the cis-acting control re-gions have potential for enabling a researcher to use a computer to scan large sequence databases for specific classes of genes which possess a desired program of regulation.
The most immediately recognizable cis-acting re-gion in both prokaryotes and eukaryotes is located just upstream of a gene’s transcription start site (TSS), and is known as the promoter region. The promoter attracts a holoenzyme, also known as the basal tran-scription apparatus which involves a crucial enzyme, RNA polymerase, that catalyzes production of RNA from the DNA template. At the promoter, the com-plex attaches to DNA strands to initiate genetic trans-cription.
The prediction of promoter regions is an important problem in its own right (Handley, 1995; Pedersen et al., 1999; Hannenhalli and Levy, 2001). It has been argued that Huntington’s chorea, a monogenetic dis-ease, occurs when a mutant gene product blocks a promoter region reducing expression of a necessary protein (Cattaneo et al., 2002). And over-expression of an enzyme by a variation in the promoter plays a crucial role in pharmacokinetics, or how a patient’s body handles a particular drug(RGEP, 2002).
As a rule, the promoter region contains short cis-acting sites, elements or nucleotide sequence mo-tifs, that are important to their utility. These are present in all promoters and conserved with some variation. In prokaryotes, consensus sequences are well estab-lished and this is consistent with the simple form of the basal transcription machinery (the overwhelming role of the σ transcription factor). Eukaryotes also have sequence motifs important to the basal apparatus (Table 6). However, a consensus is not clear, and pro-moters can function without many of these elements (without important ones such asTATA).
Gene expression in eukaryotes is far more com-plex than in prokaryotes. In prokaryotes, transcription is regulated by one RNA polymerase, while in eu-karyotes there exist three types of RNA polymerase. Of these, RNA polymerase II (pol-II), is of particu-lar interest because it transcribes the heterogeneous RNA (the precursors of mRNAs) and the small nu-clear RNAs.
Regulation of class II genes is the most complex of the three. The basal transcription machinery responsi-ble for the recruitment of pol-II is also far more com-plicated than for basal transcription in prokaryotes. An important difference being that pol-II genes are recognized principally by separate accessory factors rather than principally by the polymerase enzyme as in prokaryotes.
An “accessory factor” or “transcription factor” is defined to be any protein needed for the initiation of transcription. Important basal general transcription factors for pol-II genes are: TFIID, TFIIA, TFIIB, TFIIF, TFIIE, TFIIH, TFIIJ, and TFIIS. These are all general and responsible for low basal levels of tran-scription(Tsonis, 2003).
By its definition, the promoter region is located in the general vicinity of TSS, but there is also a dis-tinct region known as the enhancer. Known enhancer regions are several kilobases (kb) upstream of TSS and about 100 base pairs (bp) in length. They contain several closely arranged sequences that stimulate ini-tiation, some of which are quite similar to those of the promoter. Proteins bind to enhancer regions and inter-act with proteins bound to promoter regions to form a large protein complex. DNA must be coiled or rear-ranged to allow this interaction. Enhancers assist initi-ation from great distances, functioning in either orien-tation, and from either side of the gene(Lewin, 2000). The higher eukaryotes are multicellular, which in-troduces a further level of complexity to pattern recog-nition of cis-acting sites. Regulation must be selective in different cells and tissues, and is unique for more than 200 different cell types, (seeTsonis, 2003, chap-ter 6). Gene-specific factors recognize specific motifs, bind to DNA, and recruit the general transcription fac-tors. This can affect transcription rates by many orders of magnitude (50 times).
Binding of gene-specific transcriptional factors (activators) and DNA is by no means confined to the promoter region, giving rise to a complex interaction of many factors which causes the cis-acting regions in pol-II genes to contain a complicated distribution of motifs.
1.1. Pol-II promoter prediction
tested on the problem of pol-II promoter prediction in the human genome. The value of promoter prediction software is to propose putative promoter regions in genomes, to prioritize the costly experimental effort. For this reason, promoter prediction software should not aim for zero false positives but rather for zero miss (maximizing sensitivity and negative predictive value).
Commonly accepted definitions for the promoter are the ‘core’ and ‘proximal’ promoter regions of length 50 and 500 bp respectively (Bucher, 1990). A length of 250 bp falls between both of these and is commonly used.
The EC algorithm discussed in the remainder of this paper learns to predict promoter sequences, in-ductively, from a training dataset consisting of known or ‘potential’ promoter regions and of indubitably non-promoter examples such as coding sequences (CDS). It may also learn from intron sequences inside of the gene as examples of non-promoter regions. Even though mutations that result in a promoter that is less identical to the basal transcription apparatus “consensus” should lead to lower levels of transcrip-tion, gene-specific motifs outside of the promoter region may offset this effect markedly. And for this reason training datasets may indicate a positive ex-ample but there may not be enough “pattern” in the promoter region alone by which to recognize it. In the absence of any knowledge about how to remove these information-poor positive examples from the training set, the performance of promoter prediction software may present a more sensitive tradeoff be-tween catching positive examples and raising false alarms.
1.2. Evolutionary Computation and promoter prediction
EC can discover the promoter predictor by learning the classification rule from a number of known pro-moter and non-propro-moter regions. The aim in this case is to predict whether or not the sequence is a promoter (a related problem is to predict TSS, see Pedersen et al., 1995).
A typical feature of promoters is a collection of very short cis-acting sequences or motifs (Lewin, 2000). This is an important promoter characteristic that can be used for recognizing promoters. It seems sensible
to use this knowledge to design the architecture of the solution which is evolved. That is, analyze the problem in advance using human insight to determine that a certain decomposition is likely to be helpful in solving the problem; establishing an advantageous architecture for the yet-to-be evolved computer program (Koza, 1994). One desirable decomposition is to:
1. automatically discover meaningful short se-quences;
2. match them to locations;
3. construct meaningful relationships between the lo-cation of the sequences.
Additionally, it is desirable to maintain algorithmic simplicity and human-readability for interpretation of the resulting prediction algorithm.
2. Algorithm description
Evolutionary Programming (EP) is an EC method that manipulates Finite State Automata (FSA) to solve numerous problems(Fogel, 1964; Fogel et al., 1966). FSA are directed graphs that can execute sequential or parallel tours. FSA can represent powerful grammars (in the Chomsky hierarchy) and Turing machines.
Genetic Programming (GP) is an EC method that is capable of discovering computer programs and innovative solutions to problems (Koza, 1992, 1994, 1999). GP solutions are represented as tree struc-tures and these are probabilistically selected accord-ing to their fitness or ability to solve the candidate problem. These are then modified with genetic op-erators (crossover and mutation) to produce new candidate solutions. A typical GP tree structure has both terminals (leaf nodes) and functions (internal nodes).
Table 1
The GP terminal set also includes the IUPAC nucleotide ambiguity code
M A C
R A G
W A T
S C G
Y C T
K G T
V A C G
H A C T
D A G T
B C G T
N A C G T
The symbol in the leftmost column identifies a match to two or more nucleotides.
2.1. Genetic Programming modules
The objective of the GP tree structure in each state of the GP-Automata is to find motifs within the promoter and non-promoter regions. The function set consists of a single two valued function calledGLUE, which concatenates the terminals to produce a motif, and behaves as a logicalANDreturning true if both input conditions are met.
The terminal set is composed of nucleotides
A, C, G, and T. For example the GP tree(GLUE G
(GLUE A T)) is the motif GAT. This GP tree will
return true if in the genomic sequence there is a G
in the first position, an Ain the second, and a T in the third; else it returns false. To increase flexibility the terminal set was enriched to include terminals which return true for more than one given nucleotide, using the IUPAC ambiguity codes for nucleic acid sequences listed inTable 1. For example, the GP tree
(GLUE Y R)will match the patternsCA CG TA TG.
2.2. Finite State Automata component
The FSA acts as the main program and each state
qi possesses one GP tree or ‘function’Fi which gets called as and when the FSA tour invokes it. Each GP tree returns a Boolean that indicates which of two
Vector index 0 1 . . . 249 250 252 . . . 298 299
TSS position −250 −249 . . . −1 +1 +2 . . . +49 +50
Fig. 1. One of the resulting algorithms from the fivefold cross-validation.
transitions τiT or τiF it should follow to a new state, and consequently deciding what GP tree function to call next. The FSA possesses a start state and an end state and can be halted after a pre-determined number of moves when it cycles.
A logical function, e.g. NAND, is associated with each transitionτi and an integer value that moves a positional pointer over the DNA sequence, e.g.+10, is associated with each stateqiof the FSA. Both undergo genetic modification. As a tour is underway and state visits and transitions between states take place, the main program builds a logical relationship between the Boolean output of state functions. The logical function stored at the forthcoming transition combines: (a) the current cumulative Boolean result with (b) the Boolean output of the function that is executed at the current state (seeTable 4).
The algorithm can be clarified with the aid of Fig. 1. By default, the machine initiates execution at vec-tor index 0 (corresponding to TSS sequence position
−250). Execution commences at the start stateq0. The
positional integer at this state is 0 meaning that the po-sitional pointer need not be moved. PatternSNBHGW
is tested and assuming it does not match, the state re-turns “false” and the machine transits to stateq1 (F
in the arrow joiningq0 toq1). The positional integer
at state q1 is−79 and this means that the pointer is
moved 79 bp to the left (it must now subtract 78 places from vector index 299, periodicity is assumed). This places the pointer at vector index 221 (corresponding to TSS sequence position−29). Next it applies pattern
WWof stateq1. If a match does not occur the machine
transits to stateq2where the pointer is moved 111 bp
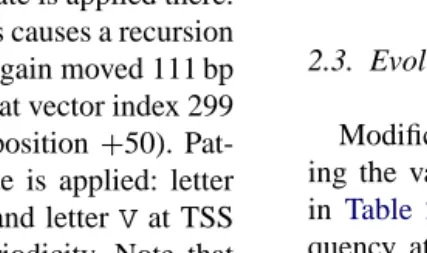
to the left, which places the pointer at vector index 110 (corresponding to TSS sequence position−140). PatternDVcorresponding to this state is applied there. Assume that there is no match. This causes a recursion at stateq2and the pointer is once again moved 111 bp
to the left which places the pointer at vector index 299 (corresponding to TSS sequence position +50). Pat-tern DVcorresponding to this state is applied: letter
Dat TSS sequence position +50 and letterVat TSS position −250 because of the periodicity. Note that this does not correspond to reality because the motif should represent a short sequence capable of attracting a protein, and it is only biologically meaningful for it to occur together (this problem could be overcome by considering the size of the motif and then shifting it accordingly). Assume that a match now occurs, caus-ing the machine to follow the transition to state q3,
where the pointer is moved 41 bp to the left, placing it near TSS at TSS sequence position+9 where pattern
NTRANis applied.
Stateqzis the so-called end state. Each GP-Automata individual carries with it an integer denoting maxi-mum number of transitions. While recursion is not a very serious problem because the pointer gets moved along, this maximum number of states that can be visited limit avoids long tours through the graph.
As the machine executes it ‘writes’ a logical state-ment with the logical functions that are associated with each transition. This follows a particular convention (Table 4) which illustrates possible paths through the GP-Automata. The GP-Automata is capable of estab-lishing quite complex decision rules for classification
of patterns and has several interesting properties:
1. The IUPAC ambiguity symbols produce motifs that can match more than one pattern in promoters and non-promoters. Moreover, the motifs can be of vari-able lengths because they are represented by GP structures.
2. The algorithm also incorporates a decision-type process. In the example,F2did not match the
cur-rent location being inspected so it was looked for upstream. Only after this motif had been found was the next motif (F3) searched for. A given motif
may be looked for in many places accounting for the possibility that it may occur in more than one place.
3. The classification of promoter or non-promoter is not based on only one criterion. Instead, the deci-sion is based on a logical combination of the ap-plied motif responses.
2.3. Evolutionary scheme
Modification of the GP-Automata is achieved us-ing the various genetic modification operators given in Table 2. Since these are many, selecting the fre-quency at which they should be applied is difficult. Self-adaptive rates are used to overcome this difficulty (e.g.Benson, 2000a). The particular results presented in this paper restricted the size of the GP-Automata arbitrarily to a maximum of five states to encourage
Table 2
Examples of genetic modifications Add a state.
Delete a state.
Change the destination of a transition. Replace a logical function with another. Exchange GP trees between two states. Replace a GP tree with one randomly created. Grow a subtree of a GP tree.
Shrink a subtree of a GP tree. Substitute a GP terminal for another. Substitute a GP function for another. Modify the integer (bp jump) at a state. Alter the maximum number of transitions.
a simple solution. An individual’s maximum num-ber of allowed transitions (during evaluation of the GP-Automata individual) was set to a minimum of 3 and not to exceed 30.
Selection followed a (µ+λ)-ES selection strategy, where ES stands for Evolutionary Strategies with ref-erence to Rechenberg and Schwefel (seeBäck, 1996, for a description of ES and selection strategies). For the results presented in this paper,µ=125 andλ= 125 meaning that a population of 250 individuals are retained throughout the evolutionary run. The fitness function isf =sensitivity+specificity, or negative of the sum ofEqs. (1) and (2)(see below). At each gen-eration, each member of the population is entered into four tournaments, and if its fitness is greater than the individual, it is competing against in each of its tourna-ments, its tournament score is incremented. Thus, the maximum tournament score any individual can obtain is 4.
The population is ranked according to tournament scores and the top 125 individuals are selected as the parents of the next generation. Each parent produces 1 child, which replaces 1 of the lower scoring 125 individuals. The 125 parents+125 offspring progress forward into the next generation, hence the (125+ 125)-ES selection strategy.
These choices and restrictions of the evolutionary scheme are arbitrary. Other EC selection schemes are possible, such as the generational GP method. Genetic modifications could also include the GP crossover op-erator (e.g.Koza, 1992). The choices and restrictions listed, however, were effective for the promoter pre-diction experiments, as discussed in the remaining sec-tions of this paper.
3. Application
A dataset of promoters and non-promoters held at fruitfly.org1was used to evaluate the effectiveness of the algorithm at identifying human genome promot-ers. Each sequence was 300 bp long extracted 250 bp upstream and 50 bp downstream of TSS.
The dataset already comes arranged to facilitate fivefold cross-validation, thus allowing algorithms to
1 http://www.fruitfly.org/seq tools/datasets/Human/promoter/.
Table 3
Parameters used in the experimentation
Parameters Values
Number of runs 50
Number of generations 1000 Population size 250
Maximum states 5+HALT state Minimum states 3+HALT state Maximum motif length 16
Minimum motif length 1
Tree terminals A,C,G,T,M,R,W,S,Y,K,V, H,D,B,N
Tree functions GLUE
be trained and tested on five sets of data. Each file consists of 565 promoters and 890 non-promoters.
The non-promoters were taken from the CDS data component of this dataset. Each training dataset file contains 452 promoters and 712 non-promoters, and each test dataset file contains 113 promoters and 178 non-promoters.
The best individual found on each of the five train-ing sets was then applied to its test set, as this is the standard way to evaluate the likely performance of an algorithm.
The evolutionary process, however, produces many such algorithms at different generations but in this in-stance, no attempt was made to generalize (to pre-vent over-training). No attempt was made to carry out a search for the simplest model that fits the data. Such procedure would judge when to stop the evolu-tion of the different parallel independent runs to avoid over-training, a procedure which may have selected more generalist individuals than those used to gener-ate the results reported here.
Table 3 lists parameters used in the experiments, Table 4shows path through the machine and result-ing logical decision formulae, and Table 5 lists the results of the fivefold cross-validation on the five test sets.
Table 4
Paths through the machine and resulting logical decision formulae, i.e. fusion of pattern matches
Path 1 F0(−250)=T→HALT
Path 2 F0(−250)=F→F1(−29)=T→HALT Path 3i, 3ii,. . . F0(−250)=F→F1(−29)=F→
F2(−140)=F→F2(+50)=F or T→ · · · Path 4i, 4ii,. . . F0(−250)=F→F1(−29)=F→
F2(−140)=T→F3(−181)=F or
T→ · · ·
Path 1 T=PROMOTER
Path 2 FNANDT=PROMOTER
Path 3i ((FORF)ORF)ORF=NON-PROMOTER Path 3ii ((FORF)ORF)ORT=PROMOTER Path 4i ((FORF)ORT)NOTF=PROMOTER For simplicity of exposition in this table, the logical formulae presented assumes that four is the maximum number of state visits allowed for any FSA tour. The logical function fusing two states is stored in the next transition. Note that the logical functionNOT is used differently from the other logical functions.NOTnegates the output at stateqiand the running formula thus far is discarded.
Table 5
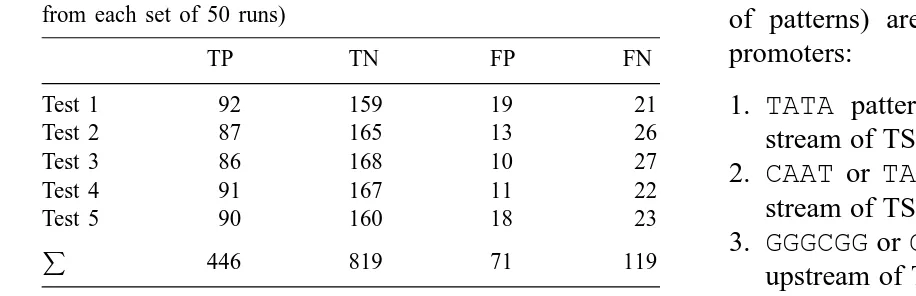
Results of fivefold cross-validation tests (for the best individual from each set of 50 runs)
TP TN FP FN
Test 1 92 159 19 21
Test 2 87 165 13 26
Test 3 86 168 10 27
Test 4 91 167 11 22
Test 5 90 160 18 23
446 819 71 119
TP, TN, FP, FN defined in text.
Table 6
Application of known basal transcription patterns to the dataset
Patterns Location (buffer) TP FP Sensitivity Specificity
Train 1
All of below 260 69 0.58 0.90
TATA −30 (10:10) 203 14 0.45 0.98
CAATorTAAC −75 (10:10) 58 32 0.13 0.95
GGGCGGorGGCGGG −90 (10:10) 20 6 0.04 0.99
Inr 0 (3:3) 45 20 0.10 0.97
Test 1
All of below 66 20 0.59 0.89
TATA −30 (10:10) 50 5 0.45 0.97
CAATorTAAC −75 (10:10) 16 11 0.14 0.94
GGGCGGorGGCGGG −90 (10:10) 9 1 0.08 0.99
Inr 0 (3:3) 6 6 0.05 0.97
promoters; false negatives (FN) are promoters clas-sified as non-promoters; true negatives (TN) are cor-rectly classified non-promoters; and false positives (FP) are non-promoters classified as promoters.
Sensitivity= TP
TP+FN =0.79 (1)
Specificity= TN
TN+FP =0.92 (2)
As already stated the fitness measure that obtained these results combined sensitivity and specificity ob-jectives equally.
4. Discussion
Inductive learning by evolution was used to dis-cover knowledge about promoter classificational identification. This can be compared with the straight-forward application of knowledge about promoters. Several texts and papers(Bucher, 1990; Lewin, 2000) establish that the following patterns (and palindromes of patterns) are useful for recognizing eukaryotic promoters:
1. TATA pattern located approximately 30 bp up-stream of TSS;
2. CAAT or TAAC located approximately 75 bp up-stream of TSS;
3. GGGCGGorGGCGGGlocated approximately 90 bp
upstream of TSS;
Table 6presents TP, FP, specificity, and sensitivity val-ues obtained by applying the patterns listed above in-dividually and together, to the data from one of the fivefolds. It appears that nearly half of the promoters are eitherTATA-less or have variations of the patterns listed, and thus cannot be predicted easily. The low statistical significance of these consensus sequences and the better success rate of the TATA-box among them is a typical finding (see Audic and Claviere, 1997). Moreover, no evidence of the ‘TATA down-stream promoter’ pattern was found in the dataset.
Fig. 1is a successful algorithm arising in one of the fivefold cross-validation experiments. The four dis-covered sequences are very short, quite general, and in themselves cannot be discriminatory. Note from Table 4, however, that pattern WW, which stands for
AA,AT,TA orAA, gets applied at−29 and that this seems plausible as this is the same TSS sequence lo-cation where theTATAbox is expected. Yet, it would seem that the evolved FSA relied on a lot of move-ment to achieve the promoter recognition, most of them evolving to use 30 for the maximum number of transitions.
It is much harder to discriminate promoter regions from non-coding sequences than from CDS. A fu-ture implementation will evolve the GP-Automata using non-CDS (rather than CDS) for examples of non-promoter regions.
5. Conclusions
This paper illustrates an EC method for discover-ing cis-actdiscover-ing sites in the genome based on the idea of combining FSA and GP. Early results show that it dis-covers promoter regions in primary sequence data. The method: (a) automatically discovers motifs of various lengths in automata states; (b) automatically discovers integer values stored at states to position the testing of these motifs onto the DNA string; and (c) automat-ically discovers how to combine the motif matches using logical functions to arrive at a cis-acting region identification decision.
Arguably the scheme is consistent with domain knowledge, as it is known that there exist a number of short cis-acting sequences in promoters (popular ones appear inTable 6) and that these tend to occur at fixed locations. Some occur more than once(Lewin,
2000) and recursion in the FSA can accommodate this, but more commonly they occur only once and at particular locations.
It is submitted that this scheme has the required simplicity to enable analysis of the resulting programs to facilitate discovery of putative and meaningful cis-acting sites. In spite of the small tours imposed (a maximum of five transitions) experimental results demonstrate that the method has the required com-plexity to arrive at context sensitive decisions for classification of sequences.
The more successful GP-Automata detect promot-ers by relying on a great number of visits, building an involved truth table of numerous matches to very small (2 or 3 bp long) patterns. More analysis of results on test cases is needed to determine whether the emerg-ing promoter prediction strategy makes sense biolog-ically, and corresponding changes to the method may be needed.
A property of the GP-Automata is code reuse and the creation of structure (function subprograms at the GP states of the GP-Automata). Both can become im-portant for discovery of subtle mechanisms. The al-gorithm presented applied motifs at precise locations in a sequential testing tour and, if required, a more powerful variant could be less precise when applying its motifs (within a bp tolerance) or work in a more parallel fashion.
Simpler EC schemes than the one presented in this paper can be applied to predict core and proximal promoters. For example, an alternative method is weighed matrices with evolution of the weights by EC; each weight is associated with a nucleotide type at a location in the sequence. However, the method that is presented in this paper can potentially analyze long sequences (including enhancers and promoters upstream, downstream, and inside of the gene) to discover the complex interaction of gene-specific mo-tifs involved in gene expression that is typical of the higher eukaryotes.
Acknowledgements
References
Ashlock, D., 1997. GP-Automata for dividing the dollar. In: Koza, J.R., et al. (Eds.), Genetic Programming: Proceedings of the Second Annual Conference. Stanford University, pp. 18–26. Audic, S., Claviere, J.-M., 1997. Detection of eukaryotic promoters
using Markov transition matrices. Comput. Chem. 21 (4), 223– 227.
Bäck, T., 1996. Evolutionary Algorithms in Theory and Practice. Oxford University Press, Oxford.
Benson, K.A., 2000a. Evolving Finite State Machines with embedded genetic programming for automatic target detection within SAR imagery. In: Proceedings of the Congress on Evolutionary Computation, La Jolla, San Diego, USA, pp. 1543–1549.
Benson, K.A., 2000b. Performing automatic target detection with evolvable Finite State Automata. J. Image. Vision Comput. 20 (9–10).
Bucher, P., 1990. Weight matrix description of four eukaryotic RNA polymerase II promoter elements derived from 502 unrelated promoter sequences. J. Mol. Biol. 212, 563– 578.
Cattaneo, E., Rigamonti, D., Zuccato, C., 2002. The Enigma of Huntington’s Disease. Scientific American, December. Fogel, L.J., 1964. On the Organization of Intellect. Ph.D. thesis,
University of California, Los Angeles, CA.
Fogel, L.J., Owens, A.J., Walsh, M.J., 1966. Artificial Intelligence Through Simulated Evolution. Wiley, New York.
Handley, S., 1995. Predicting whether or not a nucleic acid sequence is an E. coli promoter region using genetic programming. In: Proceedings of First International Symposium
on Intelligence in Neural and Biological Systems (INBS’95). IEEE Comp. Soc. Press, pp. 122–127.
Hannenhalli, S., Levy, S., 2001. Promoter prediction in the human genome. In: Proceedings of the Ninth International Conference on Intelligent Systems for Molecular Biology, vol. 17 (1). Bioinformatics, Copenhagen, Denmark, 21–25 Julys 2001, pp. S90–S96. ISSN: 1367-4803.
Koza, J.R., 1992. Genetic Programming: On the Programming of Computers by Means of Natural Selection. MIT Press, Cambridge, MA.
Koza, J.R., 1994. Genetic Programming II: Automatic Discovery of Reusable Programs. MIT Press, Cambridge, MA. Koza, J.R., Bennett, F.H., Andre, D., Keane, M.A., 1999. Genetic
Programming III: Darwinian Invention and Problem Solving. Morgan Kaufmann.
Krumm, A., Hickey, L.B., Groudine, M., 1995. Promoter-proximal pausing of RNA polymerase II defines a general rate-limiting step after transcription initiation. Genes Dev 9 (5), 559–572. Lewin, B., 2000. Genes, vol. VII. Oxford University Press, Oxford. Tsonis, P.S., 2003. Anatomy of Gene Regulation: A Three-Dimensional Structural Analysis. Cambridge University Press, Cambridge.
Pedersen, A.G., Engelbrecht, J., 1995. Investigations of Escherichia coli promoter sequences with ANN. In: Proceedings of Third International Conference on Intelligent Systems for Molecular Biology, pp. 292–299.
Pedersen, A.G., Baldi, P., Chauvin, Y., Brunak, S., 1999. The biology of eukaryotic promoter prediction—a review. Comput. Chem. 23, 191–207.