Munich Personal RePEc Archive
Do reticent managers lie during firm
surveys?
Clarke, George
Texas AM International University
25 March 2012
Online at
https://mpra.ub.uni-muenchen.de/37634/
1
D
OR
ETICENTM
ANAGERSL
IED
URINGF
IRMS
URVEYS?
George R.G. Clarke
Division of International Banking and Finance Studies A.R. Sanchez, Jr. School of Business
Texas A&M International University
March 2012
Associate Professor, Division of International Banking and Finance Studies, A.R. Sanchez, Jr. School of Business, Texas A&M International University, 5201 University Boulevard, Laredo, Texas 78041. E-mail: [email protected].
2
A
BSTRACTPrevious studies have shown that reticent managers, who are identified through a series
of random-response questions, answer questions about corruption, firm performance and how
honest they are differently from other managers. If reticent managers’ answers are different
because they are lying, estimates of these behaviors will be inaccurate. But it is also possible
that reticent managers answer questions differently because they and their firms are different.
This paper presents evidence consistent with the idea that reticent managers lie. First, it shows
that reticent managers in Nigeria report that their firms pay higher wages than other firms. This
is consistent with previous studies that have found that they also report better performance.
Second, it shows that workers at firms with reticent managers report lower, or similar, wages to
workers at other firms. The different responses of the managers and the workers suggest that
reticent managers are lying. That is, reticent managers in Nigeria report paying higher wages but
3
I.
Introduction
People often lie during surveys. Men report that they spend less time listening to soft
rock and more time listening to classical music than people meters record that they do (Clausen
and others, 2010). Similarly, when people with high-interest rates loans were asked during
face-to-face interviews whether they had one, over half denied it (Karlan and Zinman, 2008). Other
evidence suggests that respondents lie about many other things including whether they have had
abortions, use alcohol, use birth control, have gastrointestinal problems and use illegal drugs
(Tourangeau and Smith, 1996).
If deceitful respondents could be identified, it would be easier to accurately estimate how
common sensitive behaviors are and to understand the causes and effects of these behaviors.
Azfar and Murrell (2009) develop a way of identifying managers who do not answer certain
questions truthfully. They do this using randomized questions. After the interviewer asks a
sensitive question (for example on misuse of their position or tax evasion), the manager tosses a
coin out of sight of the interviewer. If the manager tosses heads, they reply ‘yes’. If they toss
tails, they answer the question. Because managers should toss heads about half the time, they
should answer yes to about half the questions even if they have never done any of the sensitive
acts. In practice, they do not, suggesting that many answer ‘no’ even when the coin shows
heads. Azfar and Murrell (2009) label managers with implausibly many ‘no’ answers as reticent.
Reticent managers who misreport the results of the coin tosses might also lie when
answering other questions. Several studies have shown that reticent managers do answer other
questions differently. They are less likely to report that bribes were requested or given (Azfar
and Murrell, 2009; Clausen and others, 2010; Jensen and Rahman, 2011). They are more likely
to say lying is never justified (Azfar and Murrell, 2009). They are more likely to claim their firm
is ISO certified (Clausen and others, 2010). They are more likely to say their firm has invested
recently (Jensen and Rahman, 2011). And they report that their firms are more productive than
other managers do (Clarke, 2011).
The studies listed above argue that reticent managers answer these questions differently
because they are either deliberately lying or unintentionally misreporting information. But this is
4
managers might answer questions differently because they run their firms differently from other
managers.
For example, several studies have found that reticent managers are less likely to report
paying bribes (Azfar and Murrell, 2009; Clausen and others, 2010; Jensen and Rahman, 2011).
This might be because reticent managers lie about paying bribes. Or it might be that reticent
managers are less likely to bribe government officials. That is, “the reticent might be less
corrupt and more virtuous than average, even though the reticent…give a set of implausible answers on the randomized response questions” (Azfar and Murrell, 2009). Although giving
false responses to the randomized response questions (i.e., not saying ‘yes’ when they toss
heads) seems inconsistent with being virtuous, they might not see answering the sensitive
question truthfully as ‘lying’. That is, if they think the randomized response questions protect
the guilty, they might think that answering the sensitive question truthfully is better than hiding
behind a coin toss.
Similarly reticent managers in Nigeria reported that their firms were more productive
than other managers did (Clarke, 2011). This could be because reticent managers lie about firm
performance. Or it could be because they are better managers and therefore the firms they
manage perform better. For example, if reticent managers are more virtuous—and their
suppliers and customers see this—they might find it easier to negotiate and agree to contracts.
Being virtuous might be especially useful when contracts are incomplete and a weak institutional
environment makes it difficult to enforce them.
This paper uses data from the World Bank’s Enterprise Surveys for Nigeria to try to see whether reticent managers lie or whether they just behave differently than non-reticent managers.
As noted above, Clarke (2011) finds that reticent managers in Nigeria report their firms are more
productive than other managers do and argues that this is because they lie about firm
performance. If reticent managers exaggerate performance, they might also exaggerate wages.
But they might report higher wages because they do pay more. That is, if firms with reticent
managers outperform other firms, they might pay their workers more because their workers are
5
In this paper we show that reticent managers in Nigeria report paying higher wages than
other managers do. We then compare managers’ responses about wages with workers’ responses
at the same firms. If reticent managers report wages truthfully, then workers in firms with
reticent managers should also, on average, report being paid more. If, in contrast, the reticent
managers are lying, workers in firms with reticent managers should not report higher wages.
Although reticent managers report that their firms pay more than other managers do,
workers report lower or similar wages. This strongly suggests that reticent managers are lying
about wages. It also suggests that other differences between firms with reticent managers and
other firms might be because reticent managers lie about these other differences as well.
II.
Data
The data used in this paper comes from the World Bank’s 2007 and 2009 Enterprise Surveys for Nigeria. The surveys covered manufacturing (group D based upon ISIC 3.1), construction (group F); retail and wholesale trade (sub-groups 52 and 51 of group G); hotels and
restaurants (group H); transport, storage, and communications (group I); and computer and
related activities (sub-group 72 of group K).1 The firms are mostly small and medium-sized
formal firms. We use these surveys because they are the only Enterprise Surveys that include reticence data.
As well as interviewing managers, the surveys also asked workers questions on wages,
education and experience, and other worker characteristics. Since the workers reported their
wages independently, we can compare their answers with their managers’ answers. This is
useful because the manager’s reticence should not affect workers’ responses. That is, although
reticent managers might misreport wages levels, the manager’s reticence is less likely to affect
workers’ responses.
1
6
Identifying reticent managers
We identify reticent managers—managers that are reluctant or unwilling to answer
questions—using the method developed by Azfar and Murrell (2009).2 They identify reticent
managers by looking at their responses to a series of random response questions (see Table 1).
The interviewer asks the manager a sensitive question (for example, on tax evasion or misuse of
power) and then asks them to toss a coin out of sight of the interviewer. If the coin shows heads,
the respondent answers ‘yes’. If it shows tails, the manager answers the question.
Random response procedures were developed to encourage people to answer sensitive
questions truthfully.3 If the manager answers ‘yes’ no one other than the manager, not even the
interviewer, knows whether the manager is saying that they committed the sensitive act or just
that the coin showed heads.
Although randomized questions reduce underreporting, it remains a serious problem.4
That is, even when the respondent knows the interviewer will not know whether they are
answering ‘yes’ because the coin showed heads or because they have done the activity, they still underreport sensitive behavior. Azfar and Murrell (2009) note that with randomized responses
no more than half of respondents should answer ‘no’ to the sensitive questions. That is, even if
no one has committed the sensitive act, the coin should show heads half the time. If some people
have committed the act, less than half should answer ‘no’. Azfar and Murrell (2009) and
Clausen and others (2010), however, find an implausible number of ‘no’ answers. They argue
that some people whose coin comes up ‘heads’ must be answering ‘no’ anyway.
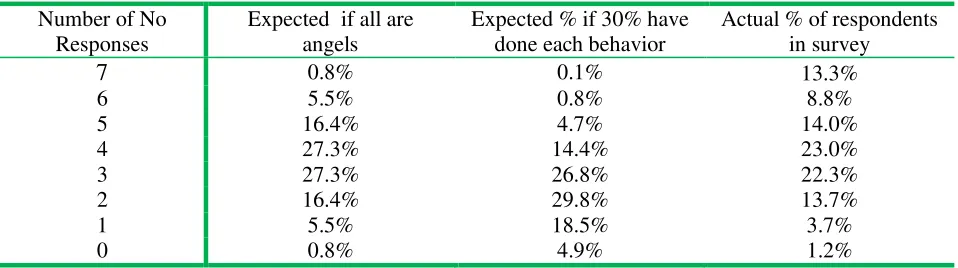
Table 2 shows the expected distribution of ‘no’ responses if no one had done any of the
sensitive behaviors, the expected distribution if 30 percent of respondents had done each
behavior, and the true distribution of ‘no’ answers. Even if no one had committed any of the
2
The same approach has been used by Clarke (2011), Clausen and others (2010), and Jensen and Rahman (2011). The description relies heavily on the descriptions in Azfar and Murrell (2009) and Clausen and others (2010). See those papers for more detail.
3
See Fox and Tracy (1986) for a general discussion or Recanatini and others (2000) for a discussion that is directly linked to the Enterprise Surveys. A related technique is list randomization where survey respondents are asked to report how many sensitive statements in a given list are true. Karlan and Zinman (2012) used list randomization in a study looking at use of loans by microenterprises.
4
7
sensitive behaviors (i.e., everyone is an ‘angel’), too many people answered no six and seven
times and too few people answered no 1 or 2 times.
This assumption, however, is unlikely to hold. Elsewhere on the survey, close to three
quarters of managers said that they thought that typical firms in their sector underreported sales
to the tax authorities. Since one randomized question asks whether the manager ever paid less
business taxes than they should have, it seems unlikely that no one has ever underreported taxes.
If 30 percent of people have done each sensitive behavior, the distribution is even more
skewed. That is, more people who responded ‘no’ four, five, six or seven times and less people who responded ‘no’ zero, one, two or three times than would be expected. The distribution would be more skewed if sensitive behaviors were more common than this.
Reticence does not appear to be an all-or-nothing behavior. That is, we see too many
people responding no five and six times as well as too many responding no seven times.
Because of this, we use a measure that allows for ‘more’ or ‘less’ reticence rather than an simple
measure that assumes the person is reticent if they respond ‘no’ seven times and non-reticent otherwise. The measure we use is the number of no responses, with more no responses
suggesting greater reticence.
III.
Econometric Analysis
Econometric Methodology
For the firm-level regressions, the dependent variables are the log of average monthly
wages for skilled and unskilled workers as reported by the manager of firm j in sector k. The
main variable of interest is the variable representing whether the manager is reticent. As
discussed above, this is the number of no responses to the random response questions. Managers
that respond ‘no’ more frequently are more reticent than other managers.
( )
The regression also includes a series of sector dummies (k), which allows wages to differ
across sectors, and a series of firm- and manager-level control variables (Fjk). The firm-level
controls include: the natural log of the number of workers, representing firm size; the natural log
8
dummy variable indicating whether the firm is foreign-owned; a variable representing the
percent of workers that belong to a union and a dummy variable indicating that the firm is in the
south of Nigeria. The manager-level control include: a dummy variable indicating that the
manager is male; a series of dummy variables indicating the age of the manager; and a series of
dummies indicating the manager’s educational attainment.
For the worker-level regressions, the dependent variable is the log of monthly earnings
for worker i in firm j in sector k.
( )
The main variable of interest is the reticence variable, which represents whether the
manager of firm j in sector k is reticent. We do not have any information on whether the worker
is reticent or not. The regressions also include the firm-level controls (Fjk) and sector dummies
(k) included in the firm-level regressions.5 These are included to control for the possibility that
firm characteristics affect workers’ wages even after controlling for worker characteristics.
Following Mincer (1974), we also include a set of variables representing characteristics
of the worker. These include the years of experience that the worker has, the years of education
the worker has, a dummy variable indicating gender, a dummy variable indicating that the
worker is in a union, a continuous variable representing hours worked, and a series of dummies
indicating whether the worker is a professional, a skilled production worker, an unskilled
production worker, a non-production worker, or a manager. Standard errors are clustered at the
firm-level to allow for unobserved firm characteristics that might affect wages for all workers at
each firm.6
Measurement error is a concern because managers that randomly toss long sequences of
heads will be mistakenly labeled as reticent. Because measurement error biases OLS coefficients
towards zero, it would be useful to use 2SLS. This would also reduce concern about reverse
causation. Although reticent managers might lie about wages, firm performance might also
affect reticence. For example, managers of better performing firms might be concerned about
5
Sector dummies are listed in the footnote to Table 3.
6
9
attracting unwanted attention from the tax authorities of corrupt bureaucrats and so be more
cautious when answering sensitive questions. If better performing firms also pay higher wages,
this could result in a spurious correlation between wages and reticence.
To use 2SLS we need to find something that affects reticence but not performance or
wages. Although some types of manager might be more reticent than others (e.g., better
educated or older managers), these managers might also do other things differently in ways that
affect performance. We therefore focus on characteristics of the interviewer rather than
characteristics of the manager.
When the manager and interviewer interact well, the manager might become less reticent.
Although interview quality depends on the manager, it also depends on the interviewer.7
Because we can identify all firms interviewed by each interviewer, we can make
interviewer-level measures of reticence (that is, average reticence of other managers interviewed by the same
interviewer). The instrument is the average number of ‘no’ responses from other firms
interviewed by the same interviewer omitting the manager’s own responses. If better
interviewers consistently get more truthful answers, the leave-one-out average should be
correlated with the manager’s own reticence. In the first stage regression, the coefficient on the
leave-one-out average is positive and statistically significant suggesting that this is the case.8
Because the leave-one-out average omits the manager’s own responses, it should reflect
characteristics of the interviewer rather than the manager or firm.
Econometric results from firm-level analysis.
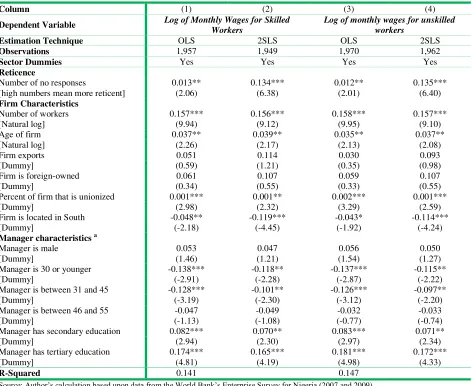
Table 3 shows the results from the firm-level regressions. The main variable of interest is
the variable representing reticence. The coefficients on this variable are positive and statistically
significant in the OLS regressions for skilled and unskilled worker wages. This indicates that
managers who are more reticent (i.e., who answer no to more questions) report paying higher
7
Iarossi (2006, p. 157), for example, notes “respondents are more willing to comply with requests from people who are similar to them, people who praise them, people who are familiar to them, and people with whom they like to be
associated.”
8
10
wages to both skilled and unskilled workers. An additional no increases reported wages by about
1 percent for both types of worker.
The coefficients are larger and more highly statistically significant in the 2SLS
regressions. Based on the coefficients from these regressions, an additional no response increases
reported wages by about 13-14 percent. The large coefficient in the 2SLS regression is
consistent with measurement error biasing the coefficient towards zero. It is also consistent with
the possibility that managers whose firms pay low wages are more reticent than other managers.
If poor firm performance increases reticence and results in low wages, the OLS coefficient might
be biased towards zero.
There are at least two possible explanations for the positive coefficient on reticence. One
is that reticent managers pay their workers more than other managers. If reticent managers are
better managers, for example, then labor productivity and wages might be higher in firms that
they manage. Another possibility is that reticent managers exaggerate, perhaps to make
themselves or their firm look better.
The other coefficients are mostly consistent with expectations and are not affected
significantly when using 2SLS to control for measurement error and the potential for
endogeneity. Large firms pay higher wages than smaller firms. This is consistent with the
observation that labor productivity is higher in large firms in Nigeria than in small firms (Iarossi
and Clarke, 2011). Firms with unionized workers and older firms also pay higher wages. Firms
with better educated and more experienced managers—using age as a proxy for experience—
also pay higher wages than other firms.
Econometric results from worker-level analysis.
As well as interviewing firm managers, workers were interviewed at some firms. This
provides a useful check on the managers’ responses since we would expect the manager’s
reticence to have little effect on the workers’ responses.
We therefore include the reticence variable in worker-level regressions. In the first
regression, we only control for worker characteristics and sector of operations, in the second we
also control for the type of work. In the final regression, we include firm-level characteristics
11
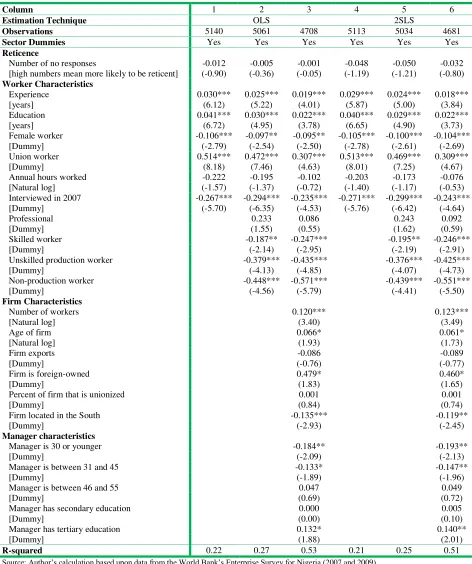
Table 4 shows the main results. The main variable of interest is the variable representing
the manager’s (not the worker’s) reticence. In contrast to the previous results, the coefficient is negative—indicating that workers report lower, not higher, wages when they work for firms with
reticent managers. It is, however, statistically insignificant at conventional significance levels.
The results are similar when we use a 2SLS procedure to control for endogeneity and
measurement error.
The other results are mostly consistent with expectations. Workers with more experience
and education are paid more, women are paid less, and union workers are paid more. Managers
and professional workers are also paid more all else equal. The coefficients on the firm-level
variables are also mostly consistent with the results in Table 3. In particular, larger firms, older
firms and firms with better educated and more experienced managers pay more.
IV.
Conclusions
Reticent managers in Nigeria report they pay their workers more than other managers do.
The results in this paper, however, suggest that they do not. When asked about wages, workers
at firms with reticent managers do not report being paid more. The different responses of
workers and managers suggest that reticent managers over-report wages.
Over thirteen percent of Nigerian managers answered ‘no’ to all seven questions.9
Because many managers who answered ‘no’ five or six times might also be reticent, this suggests that about 20 to 30 percent of Nigerian managers are reticent. Because an extra ‘no’ response
raises reported wages by 14 percent, this suggests the raw data might significantly overstate
wages in Nigeria.
Reticence could also affect estimates of other behaviors. Clausen and others (2010) find
that reticent managers in Nigeria are less likely to report that they pay bribes and more likely to
report that their firms are ISO certified. Clarke (2011) finds that reticent managers in Nigeria
report that their firms are more productive than other managers. Other studies have found that
reticent managers in other countries are more likely to report that they are honest and are that
they have recently invested (Azfar and Murrell, 2009; Jensen and Rahman, 2011). If they lie
9
12
about these behaviors, these will also be mismeasured. If reticence varies across countries,
cross-country comparisons will be difficult. And it will be difficult to assess how these
behaviors affect each other without controlling for reticence.
The results have implications for survey design. First, they suggest that it would be
useful to collect information on reticence more consistently. Measures of reticence will serve as
useful controls in regressions for firm performance, corruption and other sensitive behaviors.
Second, because reticence partly depends on the interviewer it is useful to allow researchers to
13
V.
References
Azfar, Omar, and Peter Murrell. 2009. "Identifying Reticent Respondents: Assessing the Quality of Survey Data on Corruption and Values." Economic Development and Cultural Change
57(2):387–411.Available online at http://dx.doi.org/doi:10.1086/592840.
Clarke, George R. G. 2011. "Lying about Firm Performance: Evidence from a Firm Survey in Nigeria." Texas A&M International University: Laredo, TX. Available on line at http://papers.ssrn.com/sol3/papers.cfm?abstract_id=1971575.
Clausen, Bianca, Aart Kraay, and Peter Murrell. 2010. "Does Respondent Reticence Affect the Results of Corruption Surveys? Evidence from World Bank Enterprise Survey for Nigeria." Policy Research Working Paper 5415. World Bank, Washington DC. Available on line at http://go.worldbank.org/J10YIDC0A0.
Fox, James Alan, and Paul E Tracy. 1986. Randomized Response: A Method for Sensitive Surveys. Newbury Park, CA: Sage Publications.
Iarossi, Giuseppe. 2006. The Power of Survey Design. Washington DC: World Bank.
Iarossi, Giuseppe, and George R. G. Clarke, eds. 2011. Nigeria 2011: An Assessment of the Investment Climate in 26 States. Washington DC: World Bank.
Iarossi, Giuseppe, Peter Mousley, and Ismail Radwan. 2009. An Assessment of the Investment Climate in Nigeria. Washington DC: World Bank.
Jensen, Nathan M., and Aminur Rahman. 2011. "The Silence of Corruption: Identifying Underreporting of Business Corruption through Randomized Response Techniques." Policy Research Working Paper 5696. World Bank, Washington DC.
Karlan, Dean, and Jonathan Zinman. 2008. "Lying About Borrowing." Journal of the European Economic Association 6(2-3):510–521.
Karlan, Dean, and Jonathan Zinman. 2012. "List Randomization for Sensitive Behavior: An Application for Measuring Use of Loan Proceeds." Journal of Development Economics
98(1):71–75.
Lensvelt-Mulders, Gerty J. L. M., Joop J. Hox, Peter G. M. Van Der Heuden, and Cora J. M. Maas. 2005. "Meta-Analysis of Randomized Response Research: Thirty-Five Years of Validation." Sociological Methods and Research 35(3):319–348.
Mincer, Jacob. 1974. Schooling, Experience and Earnings. New York, NY: Columbia University Press.
Moulton, Brent R. 1986. "Random Group Effects and the Precision of Regression Estimates."
14
Recanatini, Francesca, Scott Wallsten, and Lixin Colin Xu. 2000. "Surveying Surveys and Questioning Questions: Learning from World Bank Experience." Policy Research Working Paper 2307. World Bank, World Bank, Washington DC. Available on line at http://go.worldbank.org/STNT704T40.
Tourangeau, Roger, and Tom W. Smith. 1996. "Asking Sensitive Questions: The Impact of Data Collection Mode, Question Formal, and Question Context." Public Opinion Quarterly
15
[image:16.612.65.496.116.291.2]VI.
Tables
Table 1: Sensitive questions used to identify reticent respondents
Question Random response questions
1 Have you ever paid less in personal taxes than you should have under the law? 2 Have you ever paid less in business taxes than you should have under the law? 3 Have you ever made a misstatement on a job application?
Have you ever used the office telephone for personal businesses?
4 Have you ever inappropriately promoted an employee for personal reasons?
5 Have you ever deliberately not given your suppliers or clients what was due to them?
Have you ever lied in your self-interest?
6 Have you ever inappropriately hired a staff member for personal reasons?
Have you ever been purposely late for work?
7 Have you ever unfairly dismissed an employee for personal reasons
Source: Questionnaire for World Bank’s Enterprise Survey for Nigeria (2007 and 2009).
Note: The three bolded questions are less sensitive questions that were included to allow sophisticated reticent respondents to not have to give
[image:16.612.72.551.346.480.2]large numbers of ‘no’s’ consecutively if they realized that this would be very unlikely
Table 2: Expected and actual distribution of 'no' responses
Number of No Responses
Expected if all are angels
Expected % if 30% have done each behavior
Actual % of respondents in survey
7 0.8% 0.1% 13.3%
6 5.5% 0.8% 8.8%
5 16.4% 4.7% 14.0%
4 27.3% 14.4% 23.0%
3 27.3% 26.8% 22.3%
2 16.4% 29.8% 13.7%
1 5.5% 18.5% 3.7%
0 0.8% 4.9% 1.2%
Source: Author’s calculation based upon data from the World Bank’s Enterprise Survey for Nigeria (2007 and 2009).
Note: Counts are unweighted. The ‘angels’ assumption assumes that no one has done any sensitive behavior. The ‘30% assumption’ assumes 30
16
Table 3: Firm-level wage regressions with manager reporting wages for skilled and unskilled workers
Column (1) (2) (3) (4)
Dependent Variable Log of Monthly Wages for Skilled
Workers
Log of monthly wages for unskilled workers
Estimation Technique OLS 2SLS OLS 2SLS
Observations 1,957 1,949 1,970 1,962
Sector Dummies Yes Yes Yes Yes
Reticence
Number of no responses 0.013** 0.134*** 0.012** 0.135***
[high numbers mean more reticent] (2.06) (6.38) (2.01) (6.40)
Firm Characteristics
Number of workers 0.157*** 0.156*** 0.158*** 0.157***
[Natural log] (9.94) (9.12) (9.95) (9.10)
Age of firm 0.037** 0.039** 0.035** 0.037**
[Natural log] (2.26) (2.17) (2.13) (2.08)
Firm exports 0.051 0.114 0.030 0.093
[Dummy] (0.59) (1.21) (0.35) (0.98)
Firm is foreign-owned 0.061 0.107 0.059 0.107
[Dummy] (0.34) (0.55) (0.33) (0.55)
Percent of firm that is unionized 0.001*** 0.001** 0.002*** 0.001***
[Dummy] (2.98) (2.32) (3.29) (2.59)
Firm is located in South -0.048** -0.119*** -0.043* -0.114***
[Dummy] (-2.18) (-4.45) (-1.92) (-4.24)
Manager characteristics a
Manager is male 0.053 0.047 0.056 0.050
[Dummy] (1.46) (1.21) (1.54) (1.27)
Manager is 30 or younger -0.138*** -0.118** -0.137*** -0.115**
[Dummy] (-2.91) (-2.28) (-2.87) (-2.22)
Manager is between 31 and 45 -0.128*** -0.101** -0.126*** -0.097**
[Dummy] (-3.19) (-2.30) (-3.12) (-2.20)
Manager is between 46 and 55 -0.047 -0.049 -0.032 -0.033
[Dummy] (-1.13) (-1.08) (-0.77) (-0.74)
Manager has secondary education 0.082*** 0.070** 0.083*** 0.071**
[Dummy] (2.94) (2.30) (2.97) (2.34)
Manager has tertiary education 0.174*** 0.165*** 0.181*** 0.172***
[Dummy] (4.81) (4.19) (4.98) (4.33)
R-Squared 0.141 0.147
Source: Author’s calculation based upon data from the World Bank’s Enterprise Survey for Nigeria (2007 and 2009)
a Omitted age category is 56 and older. Omitted education category is primary ***, **, * Statistically Significant at 1%, 5% and 10% significance levels
17
Table 4: Worker level wage regressions with worker reporting wages
Column 1 2 3 4 5 6
Estimation Technique OLS 2SLS
Observations 5140 5061 4708 5113 5034 4681
Sector Dummies Yes Yes Yes Yes Yes Yes
Reticence
Number of no responses -0.012 -0.005 -0.001 -0.048 -0.050 -0.032
[high numbers mean more likely to be reticent] (-0.90) (-0.36) (-0.05) (-1.19) (-1.21) (-0.80)
Worker Characteristics
Experience 0.030*** 0.025*** 0.019*** 0.029*** 0.024*** 0.018***
[years] (6.12) (5.22) (4.01) (5.87) (5.00) (3.84)
Education 0.041*** 0.030*** 0.022*** 0.040*** 0.029*** 0.022***
[years] (6.72) (4.95) (3.78) (6.65) (4.90) (3.73)
Female worker -0.106*** -0.097** -0.095** -0.105*** -0.100*** -0.104***
[Dummy] (-2.79) (-2.54) (-2.50) (-2.78) (-2.61) (-2.69)
Union worker 0.514*** 0.472*** 0.307*** 0.513*** 0.469*** 0.309***
[Dummy] (8.18) (7.46) (4.63) (8.01) (7.25) (4.67)
Annual hours worked -0.222 -0.195 -0.102 -0.203 -0.173 -0.076
[Natural log] (-1.57) (-1.37) (-0.72) (-1.40) (-1.17) (-0.53)
Interviewed in 2007 -0.267*** -0.294*** -0.235*** -0.271*** -0.299*** -0.243***
[Dummy] (-5.70) (-6.35) (-4.53) (-5.76) (-6.42) (-4.64)
Professional 0.233 0.086 0.243 0.092
[Dummy] (1.55) (0.55) (1.62) (0.59)
Skilled worker -0.187** -0.247*** -0.195** -0.246***
[Dummy] (-2.14) (-2.95) (-2.19) (-2.91)
Unskilled production worker -0.379*** -0.435*** -0.376*** -0.425***
[Dummy] (-4.13) (-4.85) (-4.07) (-4.73)
Non-production worker -0.448*** -0.571*** -0.439*** -0.551***
[Dummy] (-4.56) (-5.79) (-4.41) (-5.50)
Firm Characteristics
Number of workers 0.120*** 0.123***
[Natural log] (3.40) (3.49)
Age of firm 0.066* 0.061*
[Natural log] (1.93) (1.73)
Firm exports -0.086 -0.089
[Dummy] (-0.76) (-0.77)
Firm is foreign-owned 0.479* 0.460*
[Dummy] (1.83) (1.65)
Percent of firm that is unionized 0.001 0.001
[Dummy] (0.84) (0.74)
Firm located in the South -0.135*** -0.119**
[Dummy] (-2.93) (-2.45)
Manager characteristics
Manager is 30 or younger -0.184** -0.193**
[Dummy] (-2.09) (-2.13)
Manager is between 31 and 45 -0.133* -0.147**
[Dummy] (-1.89) (-1.96)
Manager is between 46 and 55 0.047 0.049
[Dummy] (0.69) (0.72)
Manager has secondary education 0.000 0.005
[Dummy] (0.00) (0.10)
Manager has tertiary education 0.132* 0.140**
[Dummy] (1.88) (2.01)
R-squared 0.22 0.27 0.53 0.21 0.25 0.51
Source: Author’s calculation based upon data from the World Bank’s Enterprise Survey for Nigeria (2007 and 2009) ***, **, * Statistically Significant at 1%, 5% and 10% significance levels