Energy Audit of an Industrial Unit- A Case Study
S. U. Kulkarni, Kalpana Patil
Abstract - In any industry, the three top operating expenses are often found to be on energy, labor and materials. If one were to find out the potential cost savings in each of the components, energy would invariably emerge at the top, and thus energy management function constitutes a strategic area for cost reduction. This paper discusses the common aspects of electrical energy management in small- and medium-sized industries. It contains the findings and the analysis of the results obtained from the electrical energy audit program employed in an industrial unit, Loknayak J.P.Narayan Shtekari Sahakari
Sootgirni, Untawad Hol, Shahada.Dist.-Nandurbar. The
electrical energy audit was carried out under three major heads: (i) lighting audit, (ii) power load audit (motors, meters, etc.), and (iii) harmonic analysis. Readings were taken under these heads and analyzed to find the scope of energy conservation opportunities in the selected test case industrial unit.
Keywords: Energy audit, energy conservation opportunities, harmonic analysis, industrial unit
I. INTRODUCTION
Electrical energy is the most expensive and the most important form of purchased energy. For this reason, its use must be confined to a minimum for efficient and economic operation [1] . Because of its flexibility, electricity offers advantages over the conventional fossil fuels, and efforts to conserve electricity can result in significant cost savings [2] . Industries use a large amount of electrical energy, and that is why it is important to ensure a loss-free and energy-efficient system in industries [3] . In developing countries like India, where electrical energy resources are scarce and production of electricity is very costly, energy conservation studies are of great importance. Energy audit is the translation of conservation ideas into realities by blending technically feasible solutions with economic and other organizational considerations within a specified time frame [4] . An energy audit is a study of a plant or facility to determine how and where energy is used and to identify methods for energy savings. Energy audits can mean different things to different individuals. The scope of an energy audit, the complexity of calculations, and the level of economic evaluation are all issues that may be handled differently by each individual auditor and should be defined prior to the beginning of any audit activities [5],[6] . If we can reduce the energy usage or improve the energy efficiency in mechanical and electrical installations in a building, energy can be conserved and some of the resulting environmental problems, such as greenhouse effect and ozone depletion, can be alleviated. The energy audit of an industrial unit has been explored in this work. Energy conservation can be obtained by proper maintenance and operation.
Manuscript received November, 2013.
Prof.Mrs S.U.Kulkurni, M.E. Control system from collage of engg.,Pune, India
Kalpana D.Patil, B.E Electrical Engg. From D.N.Patel Collage of Engg.,Shahada., India.
These activities include shutting off unused equipment, changingequipment consuming more energy, improving
electricity demand management, reducing winter
temperature settings, turning off the light, etc. [5] . An Energy Management System can be developed with the basic idea to store the cheaper electrical energy at night in an energy buffer and to use this stored energy during the day [6] .
II. AUDITING PROCEDURE
Energy audit cannot be successfully carried out without the commitment from the top management. Management must be firstly convinced of the necessity of implementing energy management and hence energy audit [7] . Energy audit consists of several tasks, which can be carried out depending on the type of the audit and the size and the function of the audited facility [8] . Therefore, an energy audit is not a linear process and is rather iterative. The audit described in this paper has been carried out based on the following functional activities:
Walk-through survey
Motor load survey used in various processes
Harmonics analysis
III. FIELD VISITS AND MEASUREMENT WORK Loknayak J.P.Narayan Sahakari Sootgirni is one of the competitive yarn manufacturing industry in India supplying
around 60% production of yarn in Export
Marketi.einUSA,Germany,Itly,Grees,Belgium,Portugal,Spai n,Brazil,China,Egypt,Bangladesh, Srilanka etc. and also domestically in various industries. An exhaustive electrical energy audit was carried out and various data were collected related to the audit work, for further analysis.
A. PLANT ELECTRICAL ENERGY CONSUMPTION
The energy consumption of the factory was identified in terms of the equipment and functional area wise. The results were obtained after measurements during the factory visits. Data loggers, power analyzers, clamp meters, etc. were used to measure the electrical energy consumption of the factory. The total load of the unit is approximately 4273.104 KW. The following points can be observed from this survey: There are four transformers of the rating11 kv/415 kV, 1000KVA and one transformer of the rating 33 kV /11 kV, 5000 KVA.
The major load in the plant is that of motor, which
constitutes approximately 80% of the total load.
Total number of units consumed per month after taking
average of 12 months is 16 to 17 lakhs.
B. LIGHTING SURVEY
A walk-through audit was conducted during visits to assess the illumination requirement of the plant and scope of improvement of illumination quality and illumination level, with an objective of cutting down the electrical energy
consumption and cost of electricity.
Energy Audit of an Industrial Unit- A Case Study
thatpresently reflectors are removed resulting into wastage of light towards ceiling. It is recommended
1) To use electronics ballast in place of copper ballast. 1) To use reflector in ring frame area which are removed.
Use of reflector will improve illumination level at work plane.
2) Clean light fixtures and lamps periodically
Energy saving by replacement of copper ballast by electronics ballast assuming average 12 hrs in operation:-
Energy consumed per year with copper ballast = No. of tubes × watts ×12 ×365
= 1059 × 36 ×12 ×365/1000= 1, 66,983.12 kwh
Energy consumed per year with electronics ballast =118558.02 KWh
Energy saved by electronics ballast= 48,425 KWh
Amount saved per year by replacement of copper ballast =
Energy saving × Rate/KWh =48,425 × 5.50
=Rs. 2, 66,338
Thus 29% energy is saved by replacement of copper ballast byelectronics ballast
C.MOTOR SURVEY
Many motors used in plant and other sections have plastic cooling fans. Still some of the motors are fitted with heavy metal cooling fan. The metallic fans are heavy and over the years develop pitting due to corrosion and allow material
build up and consume more power. Fiberglass Reinforced
Plastic cooling fans are lighter and also prevents materials build up and hence consume less power. As the mechanical power consumed by the rotor is constant irrespective of the load on the motor, the energy savings resulting from this modification will be around 2% of the rated KW of the motor.
Thepowerconsumedbyfanmotorsisalsodefendantonthewei
ght of thefans. FiberglassReinforced
Plasticbladesaremuchlighterin weightcomparedto
aluminumbladesandconsume20to40%lesspower.
RECOMMENDATIONS: For large motors metallic cooling fans are used it is recommended to replace all such
metallic fans by Fiberglass Reinforced Plasticfans. Total
energy cost saving will be @ 2% of rated power of motor. Also for the fan motors metal fans areused, it is recommended to replace all these fans by FRP fans. Total energy saving will be 25%.
Energy saving by replacement of metal fan by FRP fan =
Rating of motor × no. of motors ×working
hrs/year×percentage energy cost saving by replacement Amount saved per year = Energy saved ×rate of energy
d) Replacement of metal cooling fan of fan motors by FRP fan
Rated power of fan motors =7.5KW Number of fan motors =7
Energy consumption with metal fans= =7.5×7×8760 = 459900 KWh
Energy consumption with FRP fans = 344925 KWh
Energy saving by replacement of metal cooling fans by FRP fans per year = 114975 KWh
Amount Saved Per Year = 114975×5.50 = Rs.6, 32,362.5
IV. HARMONIC ANALYSIS
With the increased usage of non-linear electrical loads and automation in industrial units, poor power quality due to harmonic distortion has come up as a serious issue. To tackle the problem of increasing harmonic distortion in power distribution system, Maharashtra State Electricity Distributionco. has recently issued guidelines to various medium- and large-scale industrial units of the state to get voltage and current harmonic contents evaluated at their premises at the Point of Common Coupling (PCC) and undertake remedial filtering solutions, if required, for harmonic limits in excess of the limits stipulated by IEEE-519-1992Standard.
The goal of harmonic studies is to quantify the distortion in voltage and current waveforms in the power system of industrial units. The results are useful for evaluating
corrective measures and troubleshooting
harmonicrelatedproblems.
A.EFFECTS OF HARMONICS ON NETWORKS
Overloading of neutral conductor
Reduced efficiency of motors
Malfunctioning of control equipment
Poor power factor of the total system due to
introduction of distortion power factor
Overloading of power factor capacitors
Increase in kVA demand of the plant due to
increase in rms current drawn
B.HARMONIC MEASUREMENTS AT THE CASE UNIT:-
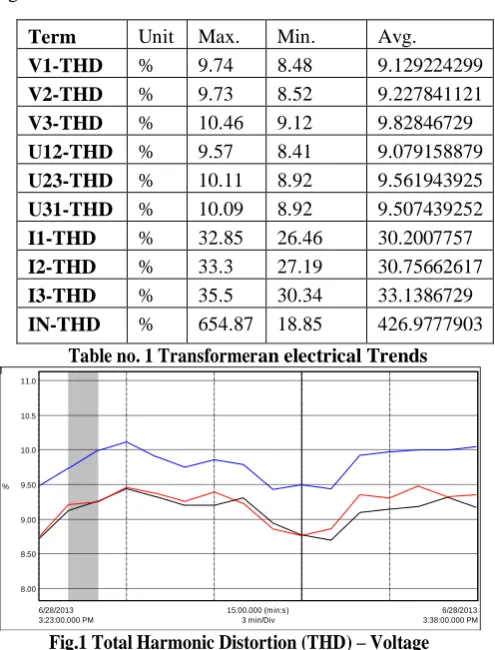
The harmonic spectrum of LT currents in three-phase distribution system of the plant recorded with the help of Power and Harmonic Analyzer is indicated in the following fig. 1 to 8 and table no. 1to 6.
Table no. 1 Transformeran electrical Trends
Fig.1 Total Harmonic Distortion (THD) – Voltage
8.00 8.50 9.00 9.50 10.0 10.5 11.0
%
3:23:00.000 PM 6/28/2013
3:38:00.000 PM 6/28/2013 3 min/Div
15:00.000 (min:s)
Term Unit Max. Min. Avg.
V1-THD % 9.74 8.48 9.129224299
V2-THD % 9.73 8.52 9.227841121
V3-THD % 10.46 9.12 9.82846729
U12-THD % 9.57 8.41 9.079158879
U23-THD % 10.11 8.92 9.561943925
U31-THD % 10.09 8.92 9.507439252
I1-THD % 32.85 26.46 30.2007757
I2-THD % 33.3 27.19 30.75662617
I3-THD % 35.5 30.34 33.1386729
Fig.2 Total Harmonic Distortion (THD) –Current
Term Unit Max. Min. Avg.
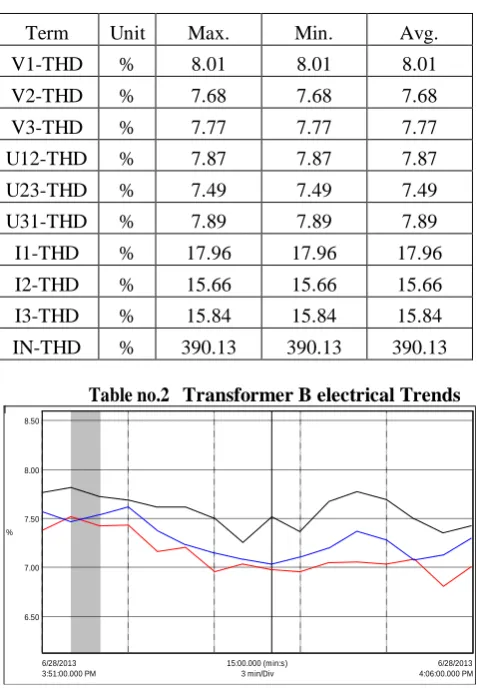
V1-THD % 8.01 8.01 8.01
V2-THD % 7.68 7.68 7.68
V3-THD % 7.77 7.77 7.77
U12-THD % 7.87 7.87 7.87
U23-THD % 7.49 7.49 7.49
U31-THD % 7.89 7.89 7.89
I1-THD % 17.96 17.96 17.96
I2-THD % 15.66 15.66 15.66
I3-THD % 15.84 15.84 15.84
IN-THD % 390.13 390.13 390.13
Table no.2 Transformer B electrical Trends
Fig.3 Total Harmonic Distortion (THD) – Voltage
Fig.4 Total Harmonic Distortion (THD) –Current
Ter Unit Max. Min. Avg.
V1-THD % 7.17 6.28 6.75907
V2-THD % 6.74 5.81 6.247384
V3-THD % 6.89 5.95 6.467373
U12-THD % 7 6.02 6.554324
U23-THD % 6.61 5.88 6.255968
U31-THD % 6.95 6.24 6.6312
I1-THD % 15.85 13.15 14.62276
I2-THD % 12.98 10.49 11.91174
I3-THD % 15.17 12.08 13.9587
IN-THD % 654.17 162.5 423.8821
Table no. 3Transformer C electrical Trends
Fig.5 Total Harmonic Distortion (THD) – Voltage
Fig.6 Total Harmonic Distortion (THD) –Current
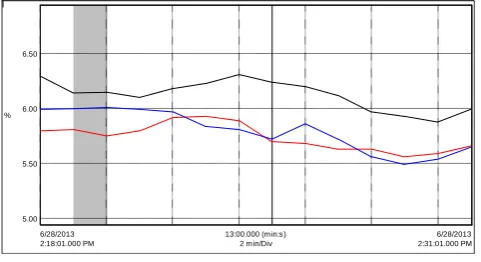
Term Unit Max. Min. Avg.
V1-THD % 6.56 5.7 6.126647
V2-THD % 6.09 5.4 5.741192
V3-THD % 6.18 5.35 5.794848
U12-THD % 6.32 5.61 5.993236
U23-THD % 5.94 5.32 5.675479
U31-THD % 6.26 5.61 5.9591
I1-THD % 13.67 10.48 11.18354
I2-THD % 11.83 8.72 9.455222
I3-THD % 13.1 10.01 10.63162
IN-THD % 652.91 21.61 389.5415
Table no. 4 Transformer D electrical Trends
26.0 28.0 30.0 32.0 34.0 36.0
%
3:23:00.000 PM 6/28/2013
3:38:00.000 PM 6/28/2013 3 min/Div
15:00.000 (min:s)
6.50 7.00 7.50 8.00 8.50
%
3:51:00.000 PM 6/28/2013
4:06:00.000 PM 6/28/2013 3 min/Div
15:00.000 (min:s)
13.0 13.5 14.0 14.5 15.0 15.5 16.0 16.5 17.0 17.5 18.0 18.5
%
3:51:00.000 PM 6/28/2013
4:06:00.000 PM 6/28/2013 3 min/Div
15:00.000 (min:s)
5.50 6.00 6.50 7.00 7.50
%
2:41:00.000 PM 6/28/2013
2:54:00.000 PM 6/28/2013 2 min/Div
13:00.000 (min:s)
10.0 10.5 11.0 11.5 12.0 12.5 13.0 13.5 14.0 14.5 15.0 15.5 16.0 16.5
%
2:41:00.000 PM 6/28/2013
2:54:00.000 PM 6/28/2013 2 min/Div
Energy Audit of an Industrial Unit- A Case Study
Fig.7 Total Harmonic Distortion (THD) – Voltage
Fig.8 Total Harmonic Distortion (THD) –Current 3 Verification of IEEE Limit Compliance
From the data provided by the Electrical Section of the
Plant, The short-circuit current (Isc ) calculated at PCC is
20725.9 A and short-circuit ratio is 14.9
Table no. 5 Current distortion limit of IEEE-519-1992 standard
Table no. 6 Voltage Distortion Limit
The industrial consumer under study falls in the category of short-circuit ratio lying in the range <20, for which the
maximum allowable THD value is 4% (up to 11 th
harmonics). It is clear that the measured THD value at the PCC of Loknayak J.P.NarayanS.Sootgirni is large as compared to its allowable limit of 4%.Also the allowable percentage voltage THD limit is 5% for0.415 kV. The
measured THD value (voltage) is large as compared tothis limit. Therefore, the consumer must install a harmonic filter to improve the power quality and save the penalty on harmonic emission.
V.FOLLOWING RECOMMENDATIONS HAVE BEEN SUGGESTED TO THE CONSUMER:
It is recommended to replace Copper ballast by
Electronic ballast.
Whenever 40Watt/36 Watt conventional tube lights
will fail replace the same by 36 Watt tri-phosphor, True light of Philips make .Lumen output of the same is 3250 lumen as compared to conventional 40W /36 watt tube rod hasFOLLOWING FEATURES
Aspectrumalmostidenticaltonaturaldaylight •Stimulatingbiologicaleffect
•Superbcontrastvision
•Absolutelytrue-to-lifecolourrenderingthroughcolourtemperature inoptimumdaylightrange5,500
•Optimumcolour renderingpropertiesRa96 •Wider,morecontinuousspectrum
comparedwithotherfluorescent lamps •Steady,balancedlightquality
•Servicelife–
whenoperatedwithelectronicballast(Warmstart):13,000 hours
Lamps shall be switched OFF when not required.
Use reflector in ring frame area which are removed
.Use of reflector will improve illumination level at work plane. Presently reflectors are removed resulting into wastage of light towards ceiling.
Clean light fixtures and lamps periodically.
Electric energy cost could also be saved in the office
area where air conditioners are used, by using false ceiling and double door system
Replace metal cooling fans by Fiberglass Reinforced
Plastic Fans to save energy.
Harmonic components at PCC are greater than the
permissible limits. Therefore, the consumer must install harmonic filter to improve the power quality and save the penalty on harmonic emission.
Harmonic component across individual loads is much
higher where variable frequency drives are used, which reflects at the PCC, so a more in-depth analysis is required and a harmonic filter can be designed.
VI. CONCLUSION
By performing Energy Audit above recommendations have been suggested due to which industry can save total amount of Rs. 8,98,700/- per year.
REFERENCES
[1]S. K. Aggarwal, M. Kumar, L. M. Saini, and A. Kumar, "Short-term load forecasting in deregulated electricity markets using fuzzy approach", Journal of Engineering and Technology, Vol. 1, no. 1, pp. 24-30, Jan-Jun2011.
[2]H. K. Wong, and C. K. Lee, "Application of energy audit in buildings and a case study", IEEE International Conference on Advances in Power System Control, Operation and Management 1993, HongKong,Dec1993.
[3]P. Z. Yaacoh, and A. A. Mohd. Zin, "Electrical energy management in small and medium size industries", IEEE TENCON, Beijing, 1993. 5.00
5.50 6.00 6.50
%
2:18:01.000 PM 6/28/2013
2:31:01.000 PM 6/28/2013 2 min/Div
13:00.000 (min:s)
8.50 9.00 9.50 10.0 10.5 11.0 11.5 12.0 12.5
%
2:18:01.000 PM 6/28/2013
2:31:01.000 PM 6/28/2013 2 min/Div
13:00.000 (min:s)
NominalVoltagekV %VTHD
0.415kV 5.0%
11kVor3.3kV 4.0%
33kV 3.0%
[4]A. Thumann, and W. J. Yonger, "Hand Book of Energy Audits", 7 th ed, Lilburn: Fairmont Press Inc.; 2007.
[5]W. J. Lee, "Energy Management for Motors, Systems, and Electrical Equipment", Industrial and Commercial Power Systems Technical Conference, IEEE, 2001.
[6]B. Huyck, and J. Cappelle, "Electrical energy management for low-voltage clients", International Conference on Clean Electrical Power, IEEE, 2007.
[7]X. W. Chen, "Energy Audit of Building: A Case Study of A Commercial Building in Shanghai", Power and Energy Engineering Conference, Asia-Pacific, 2010.
[8]A. Tyagi, "Hand Book of Energy Audit & Management" India: TERI Press; 2000.
[9]"Catalouge Surelink Technologies" Shenzhen, China, 2008
[10] "IEEE recommended practice for electric power systems in commercial buildings", Recognized as an American National Standard (ANSI) IEEE Standard, pp. 241, 1990.
[11] "Hindustan Electric Motors Catalouge", Arranged from Admin Off. Mumbai, India: Hindustan Electric MotorCompany;2008.p.1-2.
[12] Havells Catalouge: Energy Efficient Three phase Induction Motors" arranged
from Branch office. Chandigarh, India: Havells lafert Motors; 2009. p. 3-4.
[13] Havells Catalouge: Energy Efficient Three phase Induction Motors" arranged from Branch office. Chandigarh: 2008.
[14] C. T. Andrade, and S. T. Ricardo, "Three-phase induction motors- Energy Efficiency Standards-A Case Study", Pontes Electrical Engineering Department, Ceará Federal University, 2008.
[15] "IEEE Recommended Practice for Energy Management in Industrial and Commercial Facilities", Recognized as an American National Standard
(ANSI) IEEE Standard, pp. 739, 1995.
Prof.Mrs S.U.Kulkurni,M.E. Control system from collage of engg.,Pune. Associate Professor in Dept. Of Electrical Engg.,Bharti Vidyapeeth Deemed University Collage of Engg.,Pune