P R O C E E D I N G S
Open Access
An unsupervised machine learning method for
assessing quality of tandem mass spectra
Wenjun Lin
1, Jianxin Wang
2, Wen-Jun Zhang
1,3, Fang-Xiang Wu
1,3*From
IEEE International Conference on Bioinformatics and Biomedicine 2011
Atlanta, GA, USA. 12-15 November 2011
Abstract
Background:In a single proteomic project, tandem mass spectrometers can produce hundreds of millions of
tandem mass spectra. However, majority of tandem mass spectra are of poor quality, it wastes time to search them for peptides. Therefore, the quality assessment (before database search) is very useful in the pipeline of protein identification via tandem mass spectra, especially on the reduction of searching time and the decrease of false identifications. Most existing methods for quality assessment are supervised machine learning methods based on a number of features which describe the quality of tandem mass spectra. These methods need the training datasets with knowing the quality of all spectra, which are usually unavailable for the new datasets.
Results:This study proposes an unsupervised machine learning method for quality assessment of tandem mass
spectra without any training dataset. This proposed method estimates the conditional probabilities of spectra being high quality from the quality assessments based on individual features. The probabilities are estimated through a constraint optimization problem. An efficient algorithm is developed to solve the constraint optimization problem and is proved to be convergent. Experimental results on two datasets illustrate that if we search only tandem spectra with the high quality determined by the proposed method, we can save about 56 % and 62% of database searching time while losing only a small amount of high-quality spectra.
Conclusions:Results indicate that the proposed method has a good performance for the quality assessment of
tandem mass spectra and the way we estimate the conditional probabilities is effective.
Background
Proteomics is the systematic study of proteins in order to understand their structures and functional relations [1]. One area in proteomics is to identify proteins in biological complexes via peptides identified from tan-dem mass spectra. Commonly used methods for identi-fying peptides from tandem mass spectra can be divided into two categories: database searching methods such as Mascot [2] and SEQUEST [3] and de novo sequencing methods such as PEAKS [4] and PepNovo [5]. Unfortu-nately, a large number of poor quality spectra are com-monly observed in tandem mass spectral datasets, which contain too little, irrelevant, or ambiguous information.
The existence of spectra with poor quality not only slows down the identification process, but also increases the false positives and false negatives [6]. In Keller et al’s experiments [7], the mixture of 29 proteins pro-duced 37,071 tandem mass spectra, of which only 2,784 spectra originated from those 29 proteins [8], while the rest spectra could be removed from the analysis without losing any relevant protein information. Hence, it is worthwhile to develop an automatic quality assessment algorithm to discriminate high-quality from poor-quality spectra before further interpretation.
Spectral quality assessment methods select high qual-ity spectra for further processing, but do not change the selected spectra themselves [9]. Several spectral quality assessment methods have been developed in recent years. Existing spectral quality assessment methods gen-erally define a number of features to describe the quality * Correspondence: [email protected]
1
Division of Biomedical Engineering, University of Saskatchewan, 57 Campus Dr., Saskatoon, S7N 5A9, Canada
Full list of author information is available at the end of the article
of spectra [10-15]. Based on defined features these methods assessed the quality of tandem mass spectra by supervised machine learning methods, which require labelled training datasets to train a classifier. The trained classifier is then used to classify spectra into high-quality or poor-quality ones. Ideally, the training set should be validated by some peptide identification algorithms or manual checking, i.e., the set should be correctly labelled without or with very few falsely labelled spectra. However, this information is hard to be obtained prior to the peptide identification for new dataset. Even worse, tandem mass spectrometers may produce differ-ent spectra for the same peptide under differdiffer-ent experi-mental conditions. Classifier trained by one dataset may not be effective on another. Therefore, unsupervised machine learning methods are appealing for assessing the quality of tandem mass spectra. In [16], we applied the weighted k-means to classify tandem mass spectra into high-quality cluster and poor quality spectra, based on the features defined in [6].
In the literature, hundreds of features have been defined to describe the quality of tandem mass spectra, some of which are closely relevant, yet other are not. In the previous work, Ding et al [17] used a two-stage recursive feature elimination method which is based on support vector machine (SVM-RFE) to select most rele-vant features from those collected in the existing litera-ture to assess the quality of tandem mass spectra. To verify the relevance of selected features, classifiers are trained with different sets of selected features and their performances are analyzed. The results demonstrate that the sets with a small number of features outperforms the full set of features, which indicates that these fea-tures together can better describe the quality of tandem mass spectra and hence improve the performance of tandem mass spectral quality assessment.
In this paper, we propose an unsupervised machine learning method with a set of 10 most relevant features from the previous work [17] to assess the quality of tan-dem spectra. These 10 features have clear physical meanings: the higher the individual feature value of a spectrum, the more possible it is of high quality. There-fore, each individual feature can be used to easily assign a spectrum to be of high quality or poor quality by a user specified threshold. However, the precision of assessments from each individual feature is too low. Our proposed method in this paper will integrate all assess-ments from 10 individual features into a consensus assessment with a better precision, based a constraint optimization model. The remainder of the paper is orga-nized as follows. The “Method” section introduces the 10 features, describes the constraint optimization model and then present an iterative algorithm to solve it. The
“Experimental results and discussion” section investi-gates the performance of proposed quality assessment method with two tandem mass spectra datasets with low resolution. The results are presented and discussed. The “Conclusions and future work” section concludes this study and points out some direction of the future work along with this study.
Method
In this section, 10 features used for quality assessment of tandem mass spectra are introduced in the subsec-tion A. In subsecsubsec-tion B, we describe a graph-based consensus optimization method [18] to integrate indi-vidual assessments into a consensus assessment and also propose an algorithm method to solve this optimi-zation problem. The convergence of the algorithm is also proved.
A. Spectral features
A tandem mass spectrum usually contains tens to hun-dreds of m/z values with their corresponding signal intensities. In the literature, hundreds of features have been proposed to describe the quality of tandem mass spectra, for example [19-21]. In the previous study, after removing the noisy peaks by using the morphological reconstruction method [22,23], 10 most relevant spectral features are selected based on support vector machine methods [14,17] which are introduced as follows:
Feature 1 is proposed by Bern et al [15] and defined as the total normalized intensity of pairs of peaks with their m/z values summing to the mass of the precursor ion [15]. This feature is based on the reasonable assumption that the peaks with lower intensity are noises and that the complementary peaks are more likely to be signal.
Feature 2 is proposed by Flikka et al [20] and defined as the mass of uncharged precursor ion. This feature is based on the observation that most of poor quality spec-tra have the small mass of precursor ions as they maybe came from not long enough peptides or noisy chemical molecules.
Feature 3 is proposed by Wu et al [6] and defined as the number of peaks whose mass difference equals to one of the 20 amino acids mass (all peaks are consid-ered as single charged). The comparison uses a toler-ance which is set to 0.5 Da. This feature reflects that in the theoretical tandem mass spectrum of a peptide each of all the same type ions (for example, b-ion) in order differs an amino acid from its before- and/or after-neighbors.
This feature reflects that the too-dense spectra are of poor quality [15,20,24].
Feature 5 is proposed by Bern et al [15] and called the Good-Diff Fraction which is defined as
GoodDiffs ={NormI(x) + NormI(y)|M(x)−M(y)≈Mifor somei= 1, 2,. . ., 20} (1) whereM (x) is the m/z value of peakx andM1,M2,...,
M20represents the masses of 20 amino acids (not all of which are unique). The comparison implied by ≈uses a tolerance, which was set to 0.5 Da. Similar to Feature 3, it measures how likely two peaks are to differ by the mass of an amino acid.
Feature 6 is proposed by Wu et al [6] and defined as the number of pairs of complementary peaks. A pair of peaks is complementary if the sum of their m/z values is equal to the mass of the precursor ion (all peaks are considered as single charged). This feature measures how likely an N-terminus ion and a C-terminus ion in the tandem mass spectra are produced as the peptide fragments from the same peptide bond.
Feature 7 is proposed by Wu et al [6] and defined as the number of pairs of peaks whose m/z value differ-ences is equal to the mass of a water molecule or an ammonia molecule (all peaks are considered as single charged). This feature measures how likely one ion in a peptide tandem mass spectrum is produced by losing a water or ammonia molecule from other ion.
Feature 8 is proposed by Wong et al [21] and defined as the ratio of number of peaks that have a relative intensity greater than 1% of total intensity to the total number of peaks in a spectrum. The reasoning for this feature is similar to that for Feature 1;
Feature 9 is proposed by Flikka et al [20] and defined as the standard deviation of delta mass (all mass differ-ences between any two neighbor peaks) values in a spec-trum. The reasoning for this feature is similar to that for Feature 4.
Feature 10 is proposed by Wu et al [6] and defined as the number of pairs of peaks whose m/z value difference is equal to the mass of a CO group or an NH group (all peaks are considered as single charged). This feature measures how likely one ion in a peptide CID mass spectrum is a supportive ion. Two kinds of supportive ions (a-ions and z-ions) were considered.
From the definitions and physical meaning of these features, the larger the values, the more likely the spec-tra are of high quality. Therefore, according to the fea-ture values, each of these feafea-tures can be used to assess the quality of tandem mass spectra and easily divided into two categories: one with high quality and another with poor quality. However, such individual assessments are not as good as the assessment from the combination of all 10 features [14,17].
B. Integration of assessments based on individual features
In this section, we describe a method to integrate assessments based on each individual features into a consensus assessment. Based on each feature a dataset withn tandem mass spectra can be classified into two groups: one with high quality and one with poor quality. Therefore based on m features the dataset can be classi-fied intov(=2m) groups in total. Each spectrum in the dataset must belong to m groups induced by m features. This formulates a natural bipartite graph representation as in Figure 1.
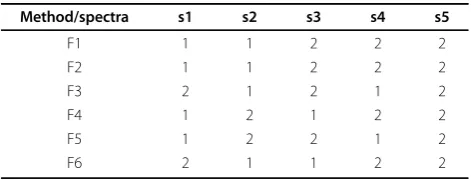
We use the following example to illustrate the bipar-tite graph representation and the problem formulation. Suppose we have a dataset consists of spectra {s1, s2, s3, s4, s5} and we use each of 6 features to classify them into 2 classes, respectively. The results are shown as in Table 1. Based on our model, the bipartite graph repre-sentation of these 6 features is shown in Figure 1. The spectral nodes are on the top side and group nodes are on the bottom side. In this bipartite graph, t1 represents the class 1, t2 the class 2 based on feature 1, and so on. Spectrum s3, for instance, belongs to group t2, t3, t5, t8, t10, t11 as it is in class 2 by Features 1, 4 and 5; and in class 1 by Features 2, 3 and 6.
In the proposed method, we will estimate the prob-abilities ofsi(i = 1,...,n) being in the class of high quality or poor quality, these probabilities can be denoted by matrix Un×2. In our method, the probabilities of each group tj(j = 1,...,v) is also involved, which is denoted by
matrixQv×2. We have
uiz=prob(siis in class z)and qjz=prob(tjis class z),
where z = 1 (means high quality) or 2 (means poor quality). Generally, a grouptj corresponds to class zif the majority of spectra in this group belong to classz, meanwhile a spectrum belongs to classzif the majority of the groups it belongs to correspond to class z. Furthermore, the initial class labels for the groups can be denoted by matrixYv×2asyjz= 1 if the grouptj’ cor-responds to class z and 0 otherwise. To estimate the probabilities in matrix U, we are about to optimize the following cost function with constraints [18]:
minJ(U,Q) = min
⎡ ⎣k
z=1
n
i=1
v
j=1
aij(uiz−qjz)2+α k
z=1
n
j=1
(qjz−yjz)2
⎤ ⎦
s.t.
k
z=1
uiz= 1, k
z=1
qjz= 1
uiz∈[0, 1], qiz∈[0, 1]
(2)
initial labels of the group nodes. This helps to avoid over-fitting. k = 2 is the number of consensus groups (with high quality or poor quality). As each spectra belongs to one ofk groups by each of mfeatures, we have
v
j=1
aij=m (3)
It is obvious that the value of cost function is zero if all assessments based m individual features are perfect agreed. Nevertheless, this does not happen in practice. Therefore, the desired resultant matrixQv×k Qv×kwill be obtained when the cost function in the constraint optimization proplem (2) reaches its minimal value. Finally, every spectrum will be assigned with a probabil-ity to class zdirectly according to the values in matrix Un×k.
From constraint optimization problem (2), we can see that for the given matrix U the objective function is quadratic in elements of matrix Q and that for the given matrix Q the objective function is quadratic in elements of matrix U. We therefore propose the following itera-tive algorithm to solve this optimization problem.
Step 1: Initialize Q by Y, that is, Qt=Y, andt=0. Step 2:t=t+1,
EstimateUtby solving
min
U J(U,Q t−1
) = min
U
⎡ ⎣k
z=1
n
i−1
v
j=1
aij(uiz−qtjz−1)
2 +α
k
z=1
n
j=1
(qtjz−1−yjz)
2
⎤ ⎦
to obtain
ut iz=
v
j=1 aijqtjz−1
v
j=1 aij
= 1
m
v
j=1
aijqtjz−1 (4)
EstimateQtby solving
min
Q J(U
t,Q) = min Q
⎡ ⎣k
z=1
n
i−1
v
j=1
aij(utiz−qjz)
2 +α
k
z=1
n
j=1
(qjz−yjz)2
⎤ ⎦
to obtain
qtjz=
n
i=1
aijutiz+αyjz
α+
n
i=1 aij
(5)
Step 3: Stop if ||Ut-Ut-1||≤ εand outputU, whereε is a user specified small positive number.
In the above algorithm, we did not take the con-straints in optimization problem (2). However, if the initial class labels for the groups Yv×ksatisfy that
k
z=1
yjz= 1, yjz∈[0, 1] (6)
the solutions of the above algorithm at every iteration t satisfying all constraints in optimization problem (2). We can use the technique of mathematical induction to prove that
Figure 1An example of bipartite graph.
Table 1 An object pool classified into several groups
Method/spectra s1 s2 s3 s4 s5
F1 1 1 2 2 2
F2 1 1 2 2 2
F3 2 1 2 1 2
F4 1 2 1 2 2
F5 1 2 2 1 2
Theorem 1: In the our algorithm if Eq(6) is true, the following is true
k
z=1
utiz= 1, 0≤utiz≤1, for i = 1, 2,. . ., n (7a)
k
z=1
qtjz= 1, 0≤qtjz≤1, for j = 1, 2,. . ., n (7b)
for t = 1, 2, ... Proof: for t = 1,
u1iz=
v
j=1 aijq1jz−1
v j=1 aij = 1 m v j=1 aijq0jz=
1 m
v
j=1 aijyjz
It is obvious that u1
iz≥0 and
u1 iz= 1 m v j=1 aijyjz≤
1 m
v
j=1
aij= 1. Furthermore
k
z=1 u1iz=
k z=1 1 m v j=1 aijyjz=
1 m v j=1 aij k z=1 yjz=
1 m
v
j=1 aij= 1
On the other hand
q1jz=
n
i=1
aiju1iz+αyjz
α+
n
i=1 aij
as all values in this express are nonnegative and ais positive, it is true that q1
jz≥0 and
q1jz=
n
i=1
aiju1iz+αyjz
α+ n i=1 aij ≤ n i=1 aij+α
α+ n i=1 aij = 1 Furthermore k z=1 q1 jz= k z=1 n i=1
aiju1iz+αyjz
α+ n i=1 aij = n i=1 aij k z=1 u1
iz+α k z=1 yjz α+ n i=1 aij = n i=1
aij+α
α+ n i=1 aij = 1
Assume that for t=r, Eqs (7a) and (7b) are true, that is
k
z=1
uriz= 1, 0≤uriz≤1, for i = 1, 2,. . ., n (8a)
k
z=1
qrjz= 1, 0≤qrjz≤1, for j = 1, 2,. . ., n (8b)
Then t=r+1, from our algorithm it follows
uriz+1=
v
j=1 aijqrjz
v j=1 aij = 1 m v j=1
aijqrjz, (9a)
qrjz+1=
n
i=1
aijuriz+1+αyjz
α+ n i=1 aij (9b)
From Eq (8b) and (9a) it follows
k
z=1
uizr+1= 1, 0≤uizr+1≤1, for i = 1, 2,. . ., n (10a)
Furthermore, from (9b) and (10a) it follows
k
z=1
qjzr+1= 1, 0≤qjzr+1≤1, for j = 1, 2,. . ., n (10b)
Therefore, for any positive integer t, (7a) and (7b) are true.
Theorem 2: From our algorithm it follows that
J(Ut,Qt)≥J(Ut+1,Qt+1) for t = 1, 2,. . . .. (11)
Proof: from the algorithm, it follows for t = 1,2,....
J(Ut,Qt)≥min U J(U,Q
t) =J(Ut+1,Qt)≥min Q J(U
t+1,Q) =J(Ut+1,Qt+1) From inequality above,J (Ut, Qt) is non-increase as the number of iteration t is increasing. On the other hand, J (Ut , Qt ) is bounded below. Therefore,
lim
t→∞J(U
t,Qt)
exists, that is, our algorithm is converged. The algorithm reflects that at each iteration the prob-ability estimation of group node Q receives the informa-tion from its neighboring spectral nodes while not deviating from its initial value Y too wild. In return, the updated probability estimates of group nodes propagate the information back to its neighboring spectral nodes. The propagation stops when the process converges. The process converges to a stationary point.
Experimental results and discussions
To evaluate our proposed method, experiments are con-ducted on two low resolution tandem mass spectral datasets: TOV and ISB.
TOV dataset
v3.42.fasta containing 72, 340 protein sequences and 5 contaminant sequences.
ISB dataset
The spectra in this dataset are acquired from the com-plex of 18 control mixture proteins which were analyzed by mLC-MS on an ESI-ITMS (ThermoFinnigan, San Jose, CA) using a standard top-down data-dependent ion selection approach [4]. This dataset consists of 37, 044 tandem mass spectra. These spectra were searched against a human protein database appended with the sequences of the 18 standard proteins and other com-mon contaminants (totally, 5, 395 protein sequences in the final database) using SEQUEST search program.
The distribution of tandem spectra is shown in Table 2.‘H’represents the number of the high quality spectra, and‘P’represents the number of the poor quality spec-tra. The assignments of spectra were determined by SEQUEST score with the cut-off score of 2.8. Spectra with score less than threshold were labeled as poor quality spectra; otherwise, they were labeled as high quality spectra.
In the experiment, we applied the proposed method on both datasets to obtain assessments based on indivi-dual features. For each feature, spectra with the top 50% feature values are assigned to high quality class. In the method, the parameterain the model was taken as 90.
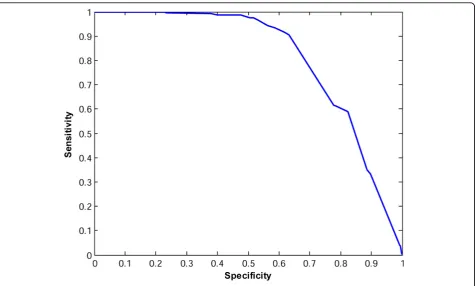
Figures 2 and 3 show the ROC curves for the consen-sus classifiers for TOV and ISB datasets, respectively. For TOV dataset, the proposed method can eliminate about 74% of the poor quality spectra while only losing less than 9% of the high quality spectra at the best case. For the ISB dataset, the proposed method can filter out about 63% of poor quality spectra while only losing 10% of high quality spectra. If we just search the TOV and ISB spectra in the high-quality group with SEQUEST, we can save about 56% (= 1-10042/22576) and 62% (= 1-14087/37044) of searching time while losing only about 10% of the interpretable spectra. These results indicate that our proposed method in this paper outper-forms the method in [16].
Furthermore, our method achieved a better result from TOV dataset than the one from ISB dataset. This may because that there are more poor quality spectra in ISB dataset (35997/37044 = 97%) than in TOV dataset (21440/22576 = 95%). High percentage of poor quality spectra makes quality assessment more challenging [17]. Another reason maybe is that there are more triply charged spectra in ISB dataset (18044) than in TOV Table 2 The distribution of multiply charged spectra in
the ISB and TOV dataset
H P Total
TOV 1136 21440 22576
ISB 1047 35997 37044
(9732). Triple charged spectra contain more doubly charged peaks than both doubly and singly charged spectra. The quality of triply charged spectra are not well described by 10 features we used in this paper, especially, feature 3, 6, 7, 10 we used are only designed for singly charged peaks while triply charged spectra produce many doubly charged peaks [25,26].
Conclusions and future work
This paper has presented an un-supervised machine learning method to integrate the assessments based on individual features (which is easy to do with a low sion) into a consensus assessment with a higher preci-sion. This unsupervised machine learning method first estimate the conditional probability of a spectrum being high quality from the assessments based on individual features. The estimation of the probabilities is solved through a constraint optimization problem. Experiment results illustrate that if we just search spectra assessed as the high-quality in TOV and ISB, we can save about 56% and 62% of searching time while losing only 9% and 10% of high-quality spectra, respectively. This result indicates that the proposed method is useful in saving database searching time. Besides, under the true positive rate (90%), our new method reaches the true negative rate at 74% and 63%, respectively. This indicates that the new method has a good performance on quality
assessment of tandem mass spectra. Also, this result shows the way we estimate the conditional probability is effective.
However, the proposed method could be improved in several ways for the future work. For example, in the ten features we adapted, four of them were calculated for singly charged peaks. This makes the classification method less effective on the triply or higher charged spectra. In the future, we may adapt different features for different charges of spectra. In this study, the value ofaand percentage cut-off value for individual features were taken according to several trial and error repeats. In the future, a more objective method should be devel-oped for specifying these values. In addition, the pro-posed constraint optimization model can be applied for other unsupervised classification problems in bioinfor-matics and proteomics.
Acknowledgements
This research is supported by Natural Sciences and Engineering Research Council of Canada (NSERC). The authors would like to thank Dr. Andrew Keller from Institute for Systems Biology for generously providing spectral data and protein databases for the ISB dataset and Dr. Guy G. Poirier from Laval University for providing the TOV dataset and search results. We also thank Mr. Jiarui Ding for providing the program for computing the features. This article has been published as part ofProteome ScienceVolume 10 Supplement 1, 2012: Selected articles from the IEEE International Conference on Bioinformatics and Biomedicine 2011: Proteome Science. The full contents of the supplement are available online at http://www.proteomesci. com/supplements/10/S1.
Author details
1Division of Biomedical Engineering, University of Saskatchewan, 57 Campus
Dr., Saskatoon, S7N 5A9, Canada.2School of Information Science and Engineering, Central South University, Changsha, P.R.China.3Department of Mechanical Engineering, University of Saskatchewan, 57 Campus Dr., Saskatoon, S7N 5A9, Canada.
Authors’contributions
WL drafted the paper, ran the program to compute the feature values, and ran and wrote the program of the iterative algorithm for the constraint optimization problem. JW and FXW developed the iterative algorithm for the constraint optimization problem, proved its convergence, and substantially modified the paper draft. FXW and WJZ initiated and supervised this research work. All authors read and approved the final manuscript.
Competing interests
The authors declare that they have no competing interests.
Published: 21 June 2012
References
1. Anderson NL, Anderson NG:Proteome and proteomics: new technologies, new concepts, and new words.Electrophoresis1998,
19:1853-1861.
2. Eng JK, McCormack AL, Yates JR:An Approach to correlate tandem mass-spectral data of peptides with amino-acid-sequences in a protein database.J Am Soc Mass Spectrom1994,5:976-989.
3. Shilov IV, Seymour SL, Patel AA, Loboda A,et al:The paragon algorithm, a next generation search engine that uses sequence temperature values and feature probabilities to identify peptides from tandem mass spectra.Mol Cell Proteomics2007,6:1638-1655.
4. Ma B, Zhang K, Christopher H, Chengzhi L,et al:PEAKS: powerful software for peptide de novo sequencing by tandem mass spectrometry.Rapid Commun Mass Spectrom2003,17:2337-2342.
5. Frank A, Pevzner P:PepNovo: de novo peptide sequencing via probabilistic network modeling.Anal Chem2005,77(4):964-973. 6. Wu FX, Gagne P, Droit A, and Poirier GG:Quality assessment of peptide
tandem mass spectra.BMC Bioinformatics2008,9(S6:S13):1-10. 7. Keller A, Purvine S, Nesvizhskii A, Stolyar S, Goodlett DR, Kolker E:
Experimental protein mixture for validating tandem mass spectral analysis.OMICS2002,6(2):207-212.
8. Razumovskaya J, Olman V, Xu D, Uberbacher EC,et al:A computational method for assessing peptide-identification reliability in tandem mass spectrometry analysis with SEQUEST.Proteomics2004,4:961-969. 9. Salmi J, Nyman TA, Nevalainen OS, Aittokallio T:Filtering strategies for
improving protein identification in highthroughput MS/MS studies. Proteomics2009,9:848-860.
10. Koenig T, Menze BH, Kirchner M, Monigatti F,et al:Robust prediction of the MASCOT score for an improved quality assessment in mass spectrometric proteomics.J Proteome Res2008,7:3708-3717. 11. Na S, Paek E:Quality assessment of tandem mass spectra based on
cumulative intensity normalization.J Proteome Res2006,5:3241-3248. 12. Frank AM, Bandeira N, Shen Z, Tanner S,et al:Clustering millions of
tandem mass spectra.J Proteome Res2008,7:113-122.
13. Tabb DL, Thompson MR, Khalsa-Moyers G, VerBerkmoes NC, McDonald WH:
MS2Grouper: group assessment and synthetic replacement of duplicate proteomic tandem mass spectra.J Am Soc Mass Spectrom2005,
16:1250-1261.
14. Ding JR, Shi JH, and Wu FX:SVM-RFE based feature selection for tandem mass spectrum quality assessment.International Journal of Data Mining and Bioinformatics2011,5(1):73-88.
15. Bern M, Goldberg D, McDonald WH, and Yates JR:Automatic quality assessment of peptide tandem mass spectra.Bioinformatics2004,20(1): i49-i54.
16. Ding JR, Shi JH, Wu FX:Quality assessment of tandem mass spectra by using a weighted k-means.Clinical Proteomics2009,5(1):15-22. 17. Ding JR:Pre-processing of Tandem Mass Spectra using Machine
Learning Methods.Master’s ThesisUniversity of Saskatchewan, Mechanical Engineering; 2009.
18. Ge L, Du N, Zhang A:Finding Informative Genes from Multiple Microarray Experiments: A Graph-based Consensus Maximization Model. 2011 IEEE International Conference on Bioinformatics and Biomedicine2011, 506-511.
19. Wu FX, Gagne P, Droit A, Poirier GG:RT-PSM, a real-time program for peptide-spectrum matching with statistical significance.Rapid Commun Mass Spectrom2006,20:1199-1208.
20. Flikka K, Martens L, Vandekerckhove J, Gevaert K, Eidhammer I:Improving the reliability and throughput of mass spectrometry-based proteomics by spectrum quality filtering.Proteomics2006,6(7):2086-2094. 21. Wong J, Sullivan M, Cartwright H, Cagney G, msmsEval:tandem mass
spectral quality assignment for high-throughput proteomics.BMC Bioinformatics2007,8(1):S11.
22. Vincent L:Morphological grayscale reconstruction in image analysis: application and efficient algorithm.IEEE Trans Image Process1993,
2:176-201.
23. Ding JR, Shi JH, Poirier GG, and Wu FX:A novel approach to denoising ion trap tandem mass spectra.Proteome Science2009,7:9.
24. Xu M, Geer L, Bryant S, Roth J, Kowalak J, Maynard D, Markey S:Assessing data quality of peptide mass spectra obtained by quadrupole ion trap mass spectrometry.J Proteome Res2005,4(2):300-305.
25. Zou AM, Shi JH, Ding JR, and Wu FX:Charge state determination of peptide tandem mass spectra using support vector machine (SVM).IEEE Trans Inf Technol Biomed2010,14(3):552-558.
26. Shi JH and Wu FX:Peptide Charge State Determination of Tandem Mass Spectra from Low-Resolution Collision Induced Dissociation.Proteome Science2011,9(Suppl 1):S3.
doi:10.1186/1477-5956-10-S1-S12
Cite this article as:Linet al.:An unsupervised machine learning
method for assessing quality of tandem mass spectra.Proteome Science
201210(Suppl 1):S12.
Submit your next manuscript to BioMed Central and take full advantage of:
• Convenient online submission
• Thorough peer review
• No space constraints or color figure charges
• Immediate publication on acceptance
• Inclusion in PubMed, CAS, Scopus and Google Scholar
• Research which is freely available for redistribution