Open Access
Research article
Comparison of generalized estimating equations and quadratic
inference functions using data from the National Longitudinal
Survey of Children and Youth (NLSCY) database
Adefowope Odueyungbo
1,2, Dillon Browne
3, Noori Akhtar-Danesh
4and
Lehana Thabane*
1,2Address: 1Department of Clinical Epidemiology and Biostatistics, McMaster University, Hamilton, Canada, 2Centre for Evaluation of Medicines, St. Joseph's Healthcare Hamilton – a Division of St. Joseph's Health System, Hamilton, Canada, 3Department of Psychology, University of Guelph, Guelph, Canada and 4School of Nursing, McMaster University, Hamilton, Canada
Email: Adefowope Odueyungbo - [email protected]; Dillon Browne - [email protected]; Noori Akhtar-Danesh - [email protected]; Lehana Thabane* - [email protected]
* Corresponding author
Abstract
Background: The generalized estimating equations (GEE) technique is often used in longitudinal data modeling, where investigators are interested in population-averaged effects of covariates on responses of interest. GEE involves specifying a model relating covariates to outcomes and a plausible correlation structure between responses at different time periods. While GEE parameter estimates are consistent irrespective of the true underlying correlation structure, the method has some limitations that include challenges with model selection due to lack of absolute goodness-of-fit tests to aid comparisons among several plausible models. The quadratic inference functions (QIF) method extends the capabilities of GEE, while also addressing some GEE limitations. Methods: We conducted a comparative study between GEE and QIF via an illustrative example, using data from the "National Longitudinal Survey of Children and Youth (NLSCY)" database. The NLSCY dataset consists of long-term, population based survey data collected since 1994, and is designed to evaluate the determinants of developmental outcomes in Canadian children. We modeled the relationship between hyperactivity-inattention and gender, age, family functioning, maternal depression symptoms, household income adequacy, maternal immigration status and maternal educational level using GEE and QIF. Basis for comparison include: (1) ease of model selection; (2) sensitivity of results to different working correlation matrices; and (3) efficiency of parameter estimates.
Results: The sample included 795, 858 respondents (50.3% male; 12% immigrant; 6% from dysfunctional families). QIF analysis reveals that gender (male) (odds ratio [OR] = 1.73; 95% confidence interval [CI] = 1.10 to 2.71), family dysfunctional (OR = 2.84, 95% CI of 1.58 to 5.11), and maternal depression (OR = 2.49, 95% CI of 1.60 to 2.60) are significantly associated with higher odds of hyperactivity-inattention. The results remained robust under GEE modeling. Model selection was facilitated in QIF using a goodness-of-fit statistic. Overall, estimates from QIF were more efficient than those from GEE using AR (1) and Exchangeable working correlation matrices (Relative efficiency = 1.1117; 1.3082 respectively).
Conclusion: QIF is useful for model selection and provides more efficient parameter estimates than GEE. QIF can help investigators obtain more reliable results when used in conjunction with GEE.
Published: 9 May 2008
BMC Medical Research Methodology 2008, 8:28 doi:10.1186/1471-2288-8-28
Received: 18 January 2008 Accepted: 9 May 2008
This article is available from: http://www.biomedcentral.com/1471-2288/8/28
© 2008 Odueyungbo et al; licensee BioMed Central Ltd.
Background
Investigators often encounter situations in which plausi-ble statistical models for observed data require an assumption of correlation between successive measure-ments on the same subjects (longitudinal data) or related subjects (clustered data) enrolled in clinical studies. Sta-tistical models that fail to account for correlation between repeated measures are likely to produce invalid inferences since parameter estimates may not be consistent and standard error estimates may be wrong [1].
Statistical methods appropriate for analyzing repeated measures include generalized estimating equations (GEE) and multi-level/mixed-linear models [2]. GEE involves specifying a marginal mean model relating the response to the covariates and a plausible correlation structure between responses at different time periods (or within each cluster). Parameter estimates thus obtained are con-sistent irrespective of the underlying true correlation struc-ture, but may be inefficient when the correlation structure is misspecified [2]. GEE parameter estimates are also sen-sitive to outliers [2,3].
Summary statistics derived from the likelihood ratio test can be used to check model adequacy in cross-sectional data analyses [1,4,5]. For mixed linear models, the process is often not straightforward due to the complexities involved [6]. Model selection is difficult in GEE due to lack of an absolute goodness-of-fit test to help in choosing the "best" model among several plausible models [4,5,7]. For repeated binary responses, Barnhart and Williamson [5] and Horton et al[4] proposed ad-hoc goodness-of-fit statistics which are extensions of the Hosmer and Leme-show method for cross-sectional logistic regression mod-els [4,5,8].
The quadratic inference functions (QIF) – introduced by Qu et al [3] – extends the capabilities of the GEE[3]. QIF provides a direct measure of goodness-of-fit that com-pares the fitted model to a saturated model, gives efficient and consistent parameter estimates (irrespective of the underlying correlation structure), and yields inferences that are robust to outliers[3,9]. QIF is a relatively new methodology. A literature search in PUBMED yielded only one study that used QIF for statistical analysis [10].
The aims of this paper are: (1) to illustrate the use of QIF for longitudinal or clustered data analyses; and (2) to compare the results obtained from GEE and QIF using data from the National Longitudinal Survey of Children and Youth (NLSCY) database. In these illustrations we model the relationship between a binary response varia-ble (parent's reports of child hyperactivity-inattention) and covariates such as child's age and gender, family func-tioning, maternal depression symptoms, household
income adequacy, maternal immigration status and maternal educational level.
Methods
Overview of GEEMarginal models are often fitted using the GEE methodol-ogy, whereby the relationship between the response and covariates is modeled separately from the correlation between repeated measurements on the same individual [2].
The correlation between successive measurements is mod-eled explicitly by assuming a "correlation structure" or "working correlation matrix". The assumption of a corre-lation structure facilitates the estimation of model param-eters [2]. Examples of working correlation matrices include: exchangeable, auto-regressive of order 1 (AR(1)), unstructured, and independent correlation structures[2]. For binary data, correlation is often measured in terms of odds ratios [11]. A plausible working correlation matrix can be chosen using a visual tool known as the lorelogram
[11].
Details of the correlation structure and response-covariate relationship are included in an expression known as the
quasi-likelihood function[2], which is iteratively solved to obtain parameter estimates. Estimates obtained from the
quasi-likelihood function are efficient when the true correla-tion matrix is closely approximated '[see Addicorrela-tional file 1]'. In other words, the large-sample variance of the esti-mator reaches a Cramer-Rao type lower bound[3] '[see Additional file 2]'.
The pros and cons of using GEE are summarized in Table 1.
Overview of QIF
The QIF methodology overcomes some of the disadvan-tages of GEE highlighted in Table 1[3]. It is largely based on observing that the inverse of many commonly used working correlation matrices can be expressed as a linear combination of unknown constants and known matrices '[see Additional file 2]'. This linear expression is substi-tuted back into the quasi-likelihood function from which an extended score vector [3] is obtained. Qu et al [3] used the generalized method of moments [12] to obtain an objec-tive function consisting of the extended score vector and its inverse variance matrix. This function is termed the "Quadratic Inference Function", which is minimized through a numerical algorithm to obtain parameter esti-mates '[see Additional file 2]'.
from QIF are still efficient, even if the correlation structure is misspecified [3]. This is confirmed from simulation results obtained by Qu et al [3] comparing the simulated relative efficiency (SRE) of parameter estimators from GEE and QIF:
Given a true correlation structure of AR(1) and a correla-tion of 0.7 between repeated observacorrela-tions, Qu et al [3] obtained an SRE of 1.34 (QIF more efficient) if the work-ing correlation structure is misspecified as "equicorre-lated". An SRE of 2.07 (QIF more efficient) was obtained if a true equicorrelated structure is misspecified as AR(1). SRE is in the range 0.97–0.99 if correlation structure is correctly specified, meaning GEE and QIF are similarly efficient [3]. The reliability of these simulation results is assessed in this paper.
The pros and cons of using QIF are listed in Table 1.
The NLSCY dataset
The NLSCY dataset consists of long-term, population-based survey data collected since 1994, and is designed to evaluate the determinants of developmental outcomes of Canadian children and youth. Each two-year period from 1994 constitutes a cycle [13].
For this paper, we selected a sub-sample of children meet-ing the inclusion criteria outlined below.
Inclusion criteria
Child must be four or five years old in Cycle 1 of the sur-vey. Child must also have complete data (Cycles 1 to 4) on the following variables: hyperactivity-inattention, age, gender, family functioning, maternal (or person most knowledgeable) depression, household income ade-quacy, maternal immigration status and maternal educa-SRE mean squared error of GEE estimator
mean squared error
=
o
of QIF estimator. Table 1: Summary of the pros and cons of GEE and QIF
Attribute GEE QIF
Pros 4 GEE parameter estimates are efficient provided the true correlation structure is closely approximated. Parameter estimates are optimal in this case2;
4 Modules for GEE are widely available in many statistical software applications;
4 GEE parameter estimates are consistent irrespective of the covariance structure chosen, as long as the linear predictor and link function are correctly specified1,2
4 Has all the pros of GEE highlighted in the adjacent column3; 4 Parameter estimates are efficient irrespective of correlation structure specified3;
4 Includes a "chi-squared inference function" for testing goodness-of-fit and regression misspecification. The function follows a chi-squared distribution irrespective of the specified correlation structure. P-values less than 0.5 suggests that the specified model may be inadequate to describe the observed data 3;
4 The goodness-of-fit test is analogous to the LRT, thus model selection criteria such as AIC (Akaike Information Criterion) and BIC (Bayes Information Criterion) are natural extensions3; 4 Gives robust parameter estimates in the presence of outliers/contaminated clusters, by using an "automatic down-weighting strategy" through a down-weighting matrix3. This property is illustrated in Qu and Song 9;
4 Existence of a lower bound is guaranteed since the function has a lower bound of 0, thus solving the problem of multiple roots associated with GEE 3;
4 QIF gives similar results as the GEE when the independent correlation structure is assumed3.
Cons 4 GEE assumes that the chosen model is correctly specified. It is often difficult to assess the goodness-of-fit of models built using GEE due to lack of an inference function like the likelihood ratio test (LRT) 7. The likelihood function for marginal models using GEE is often difficult to evaluate and intractable, especially for data that is not normally distributed 2;
4 GEE parameter estimates are sensitive to the presence of outliers as illustrated in Diggle et al 2 (page 165) and Qu et al3; 4 GEE parameter estimates are not efficient if the correlation structure is misspecified. Inefficient estimates may lead to faulty inferences from hypotheses tests3;
4 Non-convergence of results due to lack of an objective function, and the "multiple roots" problem associated with estimating functions like the quasi-likelihood function 29.
4 No software implementation available, but SAS macro available for download28;
tional level. The "person most knowledgeable" (PMK) is usually the child's mother [13].
Sample size
From a total of 2,090 (weighted sample of 795,856) four to five year olds in Cycle 1, a sub-sample of 1,052 (weighted sample of 384,306) children met the inclusion criteria outlined above. A flowchart of this process is shown in Figure 1.
Model variables
a) Response variable
The outcome of interest is hyperactivity-inattention (HI). HI is a factor measured on a 3-point Likert Scale [14] designed to assess different constructs of a child's behav-ior using information obtained from the PMK (or mother) [15]. The HI scale "identifies children who: can-not sit still, are restless, and easily distracted; have trouble sticking to any activity; fidget; cannot concentrate, cannot pay attention for long; are impulsive; have difficulty wait-ing their turn in games or groups; and cannot settle to do anything for more than a few moments" [15]. The scale is reliable with a Cronbach's alpha of 0.84 [16]. The variable – having a range of possible values between 0 and 16 –
was dichotomized using specifications obtained from Offord and Lipman[17]:
b) Independent variables
i. Child's gender: Male (1) or Female (0);
ii. Child's age (yr);
iii. Maternal immigration status (MIS): A parent who reported "age at immigration" was considered an immi-grant (1 = immiimmi-grant, 0 = non-immiimmi-grant);
iv. Maternal education level (ME): Maternal education level was categorized as (1 = those having university/col-lege degree, 0 = those without university/coluniversity/col-lege degree);
v. Maternal depression (MD): Maternal symptoms of depression were measured using a shortened version of the Center for Epidemiological Depression Scale [18]. MD score ranges between 0 and 36. Scores higher than 12 were coded as (1 = moderate to severe maternal symptoms of depression), while scores 12 and below were coded as (0 = no maternal symptoms of depression). This dichotomy
HI= 0 if HI score is less than the 90th percentile i.e. chilld is not hyperactive-inattentive;
1 if HI score is higher than the 90th percentile i.e. child is hyperactive-inatteentive
⎧ ⎨ ⎩
Sample selection
Figure 1
Sample selection.
A total of 22,831 (0 - 11) year olds fr om Cycle 1
longitudinal cohor t
2,090 (4 - 5) year olds selected
1,052 (4 - 5) year olds with non-missing data selected
for analysis
20,741 excluded
9 Wer e not in the (4 - 5) year age gr oup
1,038 excluded
is consistent with previous work by To et al [19]. Cron-bach's alpha value for this scale is 0.82 [13];
vi. Family functioning (FF): Family functioning was measured using the 12-item general functioning sub-scale of the McMaster Family Assessment Device [20,21]. This scale measures various aspects of family functioning like problem solving, communications, roles, affective involvement, affective responsiveness and behavior con-trol [13]. FF score ranges between 0 and 36. Families with scores greater than 14 were grouped as (1 = dysfunctional) while those with scores 14 and below were grouped as (0 = non dysfunctional), consistent with To et al [19]. Cron-bach's alpha value for this scale is 0.88 [13];
vii. Income adequacy (IA): Income adequacy reflects the impact of household size on family income, as defined by Statistics Canada [13]. Using a precedence from To et al [19], IA was dichotomized by combining the lowest and lower income adequacy categories to indicate (0 = low income adequacy), while the middle, upper middle and highest income adequacy groups were combined to indi-cate (1 = high income adequacy) [19].
c) Adjusted Cycle 4 longitudinal weight
The NLSCY uses a "stratified, multi-stage probability sam-ple" survey design in which each child represents several children in the population, who are not part of the survey [13]. The longitudinal weight reflects the number of chil-dren each child represents. It is calculated as the inverse of the child's probability of selection into the survey [13]. The Cycle 4 longitudinal weights are appropriate for this analysis since these weights are adjusted for population changes between Cycle 1 and Cycle 4. We further adjusted the Cycle 4 longitudinal weight for each child in the sub-sample to reflect the approximate population of four to five year olds (i.e. adjusted total weight = 795,856). This was done to enhance the generalizability of results pre-sented in this paper [13].
Statistical analysis
Summary statistics are expressed as count (percent). Hyperactivity-inattention is expressed as a function of time, gender, family functioning, maternal depression, maternal immigration status, household income ade-quacy and maternal educational level using marginal logistic regression models in GEE and QIF (Equations 8 and 9). The "adjusted Cycle 4 longitudinal weight" is included as a weight variable in the GEE and QIF models to account for study design.
Logit(μij) = α + β1tj + β2gender + β3FF + β4MD + β5MIS + β6ME + β7IA (1)
The goodness-of-fit (GOF) test in QIF is used for model assessment. We compared the fit of different models using the Q statistic [3] and its extensions such as AIC (Akaike Information Criterion) and BIC (Bayes Information Crite-rion). Smaller Qs, AICs and BICs indicate better fits [1,3].
QIF and GEE are compared with respect to relative effi-ciency of parameter estimates. We also illustrate how to use the GOF statistic from QIF in selecting an optimal working correlation matrix between AR(1) and exchange-able correlation structures. All statistical tests were con-ducted at 5% level of significance.
Graphs and analyses results were obtained using SAS© (Version 9.1), SPSS© (Version 14.0) and R (Version 2.5.1).
Results
Demographic characteristics (survey-weighted) and data exploration
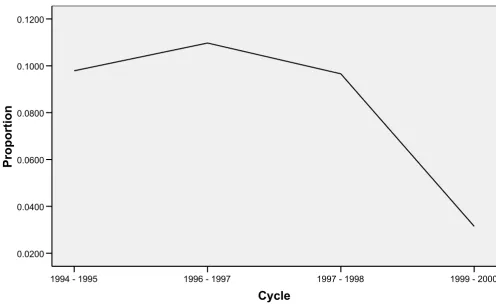
Table 2 represents the weighted frequencies of the base-line and follow-up characteristics of the study population. Figure 2 shows the estimated proportion of hyperactive-inattention among the selected cohort between 1994 and 2000. The graph is not linear. Hyperactivity-inattention appeared to diminish as children in this cohort grew older.
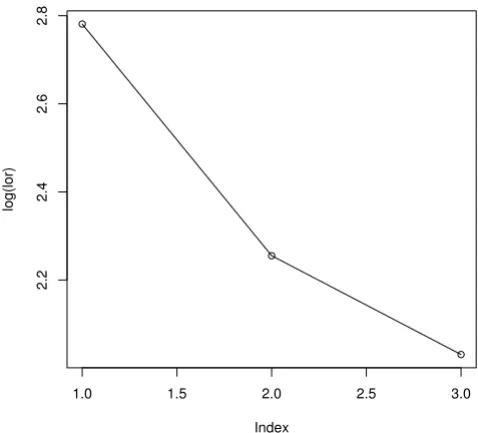
Figure 3 is a lorelogram which measures the correlation
between repeated binary outcomes using odds ratios [11]. The x-axis (index) is the time-lag between two measure-ments. From Figure 3, correlation appears to decrease with increasing lag between repeated responses, thus an AR(1) correlation structure may be appropriate for describing the relationship between hyperactivity-inattention scores at different cycles.
Model selection using QIF
Results in Table 3 were obtained from fitting Model (8) in GEE and QIF, and assuming an AR(1) correlation struc-ture. GEE and QIF produce different conclusions for maternal education level and family functioning, although the odds ratios are of similar magnitudes. Figure 2 shows that a quadratic term may be required to improve model fit, but GEE does not provide a goodness-of-fit test with, for instance, the SAS© implementation.
In addition to the results obtained in Table 3, QIF – in contrast to GEE – provides direct measures of goodness-of-fit (GOF) with SAS© software output to assess model adequacy [3]. QIF facilitates comparison among different plausible models using the Q statistic [3]. The Q statistic logit(mij)= +a b1tj+b1∗t2j+b2gender+b3FF+b4MD+b5MIS+b6ME+b7IAA
is obtained from the asymptotic limiting distribution of the quadratic inference function (QIF). Just like the likeli-hood ratio test, it enables one to test the null hypothesis that a simpler model is just as predictive as a saturated model. The difference between QIF (for saturated model)
and QIF (for simpler model) is asymptotically chi-squared under the null hypothesis irrespective of the underlying true correlation structure. This difference is asymptotically non-central chi-squared under the local alternative hypothesis [3]. The mathematical proof and Table 2: Weighted frequencies of baseline and follow-up characteristics of the study population
VARIABLE CATEGORIES CYCLE 1 CYCLE 2 CYCLE 3 CYCLE 4
Total 795,858 (*) 795,858 795,858 795,858
Gender Male 400,014 (50.3) 400,014 (50.3) 400,014 (50.3) 400,014 (50.3)
Female 395,844 (49.7) 395,844 (49.7) 395,844 (49.7) 395,844 (49.7)
Family functioning Dysfunctional 47,955 (6) 47,768 (6) 52,828 (6.6) 45,862 (5.8)
Not dysfunctional 747,903 (94) 748,090 (94) 743,030 (93.4) 749,996 (94.2)
Maternal depression Severely depressed 70,451 (8.9) 45,767 (5.8) 56,597 (7.1) 58,500 (7.4)
Not severely depressed 725,407 (91.1) 750,091 (94.2) 739,261 (92.9) 737,358 (92.6)
Maternal immigration status Immigrant 100,952 (12.7) 100,952 (12.7) 100,952 (12.7) 100,952 (12.7)
Non immigrant 694,906 (87.3) 694,906 (87.3) 694,906 (87.3) 694,906 (87.3)
Maternal education level College degree 298,839 (37.5) 330,532 (41.5) 339,078 (42.6) 301,324 (37.9)
No college degree 497,019 (62.5) 465,326 (58.5) 456,780 (57.4) 494,534 (62.1)
Income adequacy Adequate income 138,533 (17.4) 128,659 (16.2) 66,834 (8.4) 47,741 (6)
Inadequate income 657,325 (82.6) 667,199 (83.8) 729,024 (91.6) 748,117 (94)
*Calculated based on an unweighted sample size of 1,052.
Estimated proportion of baseline '4–5 year old' cohort with hyperactivity-inattention between 1994 and 2000
Figure 2
Estimated proportion of baseline '4–5 year old' cohort with hyperactivity-inattention between 1994 and 2000. Adjusted for "normalized" Cycle 4 longitudinal weights.
Cycle
1999 - 2000 1997 - 1998
1996 - 1997 1994 - 1995
Proportion
0.1200
0.1000
0.0800
0.0600
0.0400
simulation results are found in Qu et al [3]. The Q statistic has properties similar to the likelihood ratio test used for generalized linear models [3]. Thus, extensions of the Q statistic such as AIC (Akaike Information Criterion) and
BIC (Bayes Information Criterion) can also be used to compare the fit of different models. In comparison to a saturated model, a fitted model is considered inadequate if the p-value for the goodness-of-fit test is less than 0.05 [3].
From Table 4, GOF tests show that Model (8) is inade-quate to describe the observed data (GOF statistic Q = 22.82, p = 0.0066; AIC = 40.82, BIC = 85.45). Considering the non-linearity of Figure 2, a quadratic term was added to Model (8) to obtain Model (9). Model (9) appears to provide a better fit (GOF statistic Q = 11.74; p = 0.3027; AIC = 31.74, 81.33).
Table 5 shows parameter estimates for GEE and QIF using Model (9). The quadratic term (t2) is statistically signifi-cant in both GEE and QIF (p < 0.05). Also, the results from GEE and QIF appear to be in agreement in Model 9, suggesting that the results are robust. Next we provide the clinical implication of the results.
Explanation of results from Table 5 (QIF)
4 Male children have significantly higher odds of devel-oping hyperactivity-inattention than their female counter-parts (OR = 1.73, 95% CI of 1.10 to 2.71).
4 Children from dysfunctional families have significantly
higher odds of developing hyperactivity-inattention than those from non-dysfunctional families (OR = 2.84, 95 CI of 1.58 to 5.11).
Table 4: QIF goodness-of-fit test for model with and without quadratic term
With quadratic Term Without Quadratic Term
AIC (the smaller the better) 31.74 40.82
BIC (the smaller the better) 81.33 85.45
Q (p-value) 11.74 (0.3027) 22.82 (0.0066)
Lorelogram of hyperactivity-inattention
Figure 3
Lorelogram of hyperactivity-inattention. The x-axis (index) is the time-lag between two measurements. The y-axis is log odds ratio.
1.0 1.5 2.0 2.5 3.0
2.2
2.4
2.6
2.8
Index
log(lor)
Table 3: Adjusted odds ratios for hyperactivity-inattention based on GEE and QIF
GEE QIF
Parameter OR (95% CI) p-value OR (95% CI) p-value
Intercept 0.27 (0.08 to 0.96) 0.0422 0.15 (0.04 to 0.54) 0.0036
Cycle (t) 0.93 (0.33 to 2.63) 0.8911 0.92 (0.33 to 2.63) 0.8833
Age (yr) 0.90 (0.54 to 1.50) 0.6927 0.88 (0.52 to 1.47) 0.6143
Gender (Male) 2.08 (1.30 to 3.33) 0.0022 2.09 (1.30 to 3.36) 0.0024
Family functioning 2.67 (1.27 to 5.60) 0.0097 1.32 (0.48 to 3.63) 0.5934
Maternal depression 2.27 (1.41 to 3.66) 0.0008 3.05 (1.92 to 4.83) < 0.0001
Maternal immigration status 0.51 (0.24 to 1.10) 0.0881 0.66 (0.32 to 1.40) 0.2813
Income adequacy 0.80 (0.46 to 1.38) 0.4249 0.95 (0.55 to 1.65) 0.8563
4 Children of moderate to severely depressed mothers have significantly higher odds of developing hyperactiv-ity-inattention than those whose mothers are not depressed (OR = 2.49, 95% CI of 1.60 to 2.60).
4 Children of immigrants, children with mothers having university/college degree and children in the high income adequacy group have lower estimated odds of developing hyperactivity-inattention (OR = 0.69, 95% CI of 0.35 to 1.37; OR = 0.59, 95% CI of 0.34 to 1.02; and OR = 0.95, 95% CI of 0.58 to 1.57 respectively). The odds ratios in these three situations are not statistically significant.
Choice of correlation structure in QIF
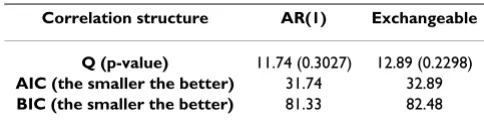
QIF facilitates an optimal choice among the available cor-relation structures. Assuming Model (9), Table 6 shows the results for AR(1) and exchangeable correlation struc-tures. The results for both correlation structures are simi-lar, but AR(1) is the more appropriate working correlation matrix from the goodness-of-fit tests in Table 7. This is also supported by the lorelogram in Figure 3.
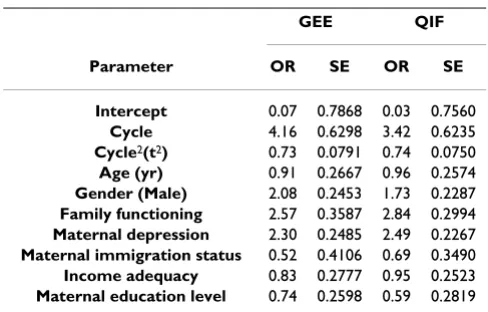
GEE Versus QIF (Relative efficiency)
We compared the efficiency of parameter estimates from QIF and GEE using:
provided the estimates are unbiased estimates of the param-eters of interest [22]. This definition of RE generalizes to situations in which there are multiple parameters to be
Relative Efficiency (RE)=mean square error of estimate fromean square error of estimate from QIFmm GEE
trace of cov
= aariance matrix of parameter estimates from GEE
trace of covvariance matrix of parameter estimates from QIF sum of sq
= uuares of SEs from GEE estimates
sum of squares of SEs from QIF estimates
Table 6: Adjusted odds ratios for hyperactivity-inattention using AR(1) and exchangeable working correlation structures in QIF
AR(1) Exchangeable
Parameter OR (95% CI) p-value OR (95% CI) p-value
Intercept 0.03 (0.01 to 0.15) <0.0001 0.02 (0.01 to 0.08) <0.0001
Cycle (t) 3.42 (1.00 to 11.61) 0.0486 2.97 (0.91 to 9.67) 0.0704
Cycle2(t2) 0.74 (0.64 to 0.86) <0.0001 0.71 (0.61 to 0.82) <0.0001
Age (yr) 0.96 (0.58 to 1.59) 0.8670 1.13 (0.72 to 1.77) 0.6054
Gender (Male) 1.73 (1.10 to 2.71) 0.0167 1.83 (1.19 to 2.80) 0.0056
Family functioning 2.84 (1.58 to 5.11) 0.0005 2.31 (1.27 to 4.21) 0.0061
Maternal depression 2.49 (1.60 to 2.60) 0.0001 2.09 (1.27 to 3.46) 0.0038
Maternal immigration status 0.69 (0.35 to 1.37) 0.2937 0.58 (0.29 to 1.15) 0.1186
Income adequacy 0.95 (0.58 to 1.57) 0.8572 0.99 (0.60 to 1.61) 0.9518
Maternal education level 0.59 (0.34 to 1.02) 0.0606 0.68 (0.41 to 1.13) 0.1370
Table 5: Adjusted odds ratios for hyperactivity-inattention based on GEE and QIF using AR(1) (Model 9)
GEE QIF
Parameter OR (95% CI) p-value OR (95% CI) p-value
Intercept 0.07 (0.01 to 0.33) 0.0007 0.03 (0.01 to 0.15) <0.0001
Cycle (t) 4.16 (1.21 to 14.28) 0.0237 3.42 (1.00 to 11.61) 0.0486
Cycle2(t2) 0.73 (0.62 to 0.85) 0.0001 0.74 (0.64 to 0.86) <0.0001
Age (yr) 0.91 (0.54 to 1.53) 0.7182 0.96 (0.58 to 1.59) 0.8670
Gender (Male) 2.08 (1.28 to 3.36) 0.0029 1.73 (1.10 to 2.71) 0.0167
Family functioning 2.57 (1.27 to 5.20) 0.0084 2.84 (1.58 to 5.11) 0.0005
Maternal depression 2.30 (1.41 to 3.74) 0.0008 2.49 (1.60 to 2.60) 0.0001
Maternal immigration status 0.52 (0.23 to 1.17) 0.1147 0.69 (0.35 to 1.37) 0.2937
Income adequacy 0.83 (0.50 to 1.38) 0.4776 0.95 (0.58 to 1.57) 0.8572
Maternal education level 0.74 (0.43 to 1.28) 0.2818 0.59 (0.34 to 1.02) 0.0606
Table 7: QIF goodness-of-fit test for AR(1) and exchangeable working correlation structures
Correlation structure AR(1) Exchangeable
Q (p-value) 11.74 (0.3027) 12.89 (0.2298)
AIC (the smaller the better) 31.74 32.89
estimated. Thus from Table 8 with AR(1) correlation structure, one obtains
RE = 1.1117.
Using exchangeable working correlation, RE is 1.3082 (see Table 9). This implies that QIF parameter estimates are more efficient than GEE estimates assuming AR(1) or exchangeable correlation structures. This is consistent with the simulation results obtained by Qu et al [3].
Discussion
We have illustrated some desirable features of the QIF in modeling longitudinal or clustered data. QIF provides a direct goodness-of-fit statistic that follows a chi-squared distribution irrespective of the underlying true correlation structure [3]. The goodness-of-fit statistic from QIF also facilitates an optimal selection of correlation structure among several plausible choices. It would be interesting to compare the goodness-of-fit tests provided by QIF to those provided by Barnhart and Williamson [5] and Hor-ton et al [4] in GEE. Overall, we obtained similar parame-ter estimates from GEE and QIF analyses of the NLSCY data. Our results were consistent with the findings by Qu et al [3] showing the greater efficiency of parameter esti-mates from QIF in comparison to GEE. We could not ver-ify the robustness of QIF to the presence of outliers due to strict ethical guidelines regarding the use of the NLSCY dataset. The risk of disclosure of sensitive data may be higher when outliers are selected for sensitivity analysis.
One of the strengths of this study is the longitudinal nature of the NLSCY dataset. However, we caution the readers in interpreting the results – dichotomizing the pri-mary outcome hyperactivity-inattention score may result in loss of information. Understanding the factors that are predictive of hyperactivity-inattention will help stake-holders develop programs to mitigate the effects of such
factors, with the aim of raising children that are healthy members of the society.
The use of "complete case analysis" in the illustrative example is a limitation of this study. QIF – like standard GEE models – requires the assumption that missing val-ues are "missing-completely-at-random" (MCAR) for complete case analysis [30]. There are methods available for assessing this assumption or incorporating missing-ness into statistical models, but missing value analyses was not the aim of this project.
The QIF methodology is relatively new and not available in any statistical software as a built-in routine. The SAS macro to carry out the procedure is available for down-load, but users without adequate programming skills may find the process a bit difficult. Also, the QIF macro can only handle three correlation structures at the moment. More research is being done to incorporate other com-monly used structures into the methodology [28].
Conclusion
QIF is useful for model selection and provides more effi-cient parameter estimates than GEE. QIF can help investi-gators obtain more reliable results when used in conjunction with GEE. The QIF methodology may even-tually become a replacement for GEE due to its desirable characteristics as highlighted in this paper.
Competing interests
The authors declare that they have no competing interests.
Authors' contributions
AO and LT conceived the study. LT, NA–D and DB partic-ipated in the design of the study. Data acquisition and cleaning were done by AO and DB. AO conducted data analysis and wrote initial draft of manuscript. Results of Table 8: Adjusted odds ratios and SEs for
hyperactivity-inattention using AR(1) in GEE and QIF
GEE QIF
Parameter OR SE OR SE
Intercept 0.07 0.7868 0.03 0.7560
Cycle 4.16 0.6298 3.42 0.6235
Cycle2(t2) 0.73 0.0791 0.74 0.0750
Age (yr) 0.91 0.2667 0.96 0.2574
Gender (Male) 2.08 0.2453 1.73 0.2287
Family functioning 2.57 0.3587 2.84 0.2994
Maternal depression 2.30 0.2485 2.49 0.2267
Maternal immigration status 0.52 0.4106 0.69 0.3490
Income adequacy 0.83 0.2777 0.95 0.2523
Maternal education level 0.74 0.2598 0.59 0.2819
Table 9: Adjusted odds ratios and SEs for hyperactivity-inattention assuming exchangeable working correlation structure in GEE and QIF
GEE QIF
Parameter OR SE OR SE
Intercept 0.06 0.8157 0.02 0.7026
Cycle 3.90 0.6393 2.97 0.6019
Cycle2(t2) 0.72 0.0794 0.71 0.0756
Age (yr) 0.95 0.2789 1.13 0.2304
Gender (Male) 2.04 0.2585 1.83 0.2177
Family functioning 2.35 0.3774 2.31 0.3056
Maternal depression 2.04 0.2788 2.09 0.2556
Maternal immigration status 0.54 0.4452 0.58 0.3505
Income adequacy 0.90 0.2607 0.99 0.2494
Maternal education level 0.74 0.2880 0.68 0.2563
data analysis were interpreted by AO and LT. NA–D, LT and DB reviewed and revised the manuscript for impor-tant statistical and subject-matter content. All authors read and approved the final manuscript.
Additional material
Acknowledgements
Dr Lehana Thabane is a clinical trials mentor for the Canadian Institute of Health Research. We are indebted to Statistics Canada for providing access to the NLSCY database. Dr Gina Browne assisted with the application for access to the NLSCY database. The SAS macro for the QIF methodology – without which this project would have been a daunting task – was provided by Dr Peter Song, and is available for online [28]. We thank the reviewers for helpful comments that led to improvements in the manuscript.
References
1. Dobson A: An Introduction to Generalized Linear Models Florida: Chap-man & Hall/CRC; 2002.
2. Diggle PJ, Heagerty P, Liang K, Zeger SL: Analysis of Longitudinal Data
Second edition. Oxford: Oxford University Press; 2002.
3. Qu A, Lindsay B, Li B: Improving generalized estimating equa-tions using quadratic inference function. Biometrika 2000,
87:823-836.
4. Horton NJ, Bebchuk JD, Jones CL, Lipsitz SR, Catalano PJ, Zahner GE, Fitzmaurice GM: Goodness-of-fit for GEE: An example with mental health service utilization. Stat Med 1999, 18(2):213-222. 5. Barnhart HX, Williamson JM: Goodness-of-fit tests for GEE modeling with binary responses. Biometrics 1998,
54(2):720-729.
6. Schabenberger O: Mixed model influence diagnostics. In Pro-ceedings of the twenty-Ninth Annual SAS Users Group International Confer-ence: May 9–12, 2004; Montreal Cary, NC: SAS Institute Inc; 2004:189-29.
7. Heagerty PJ, Zeger SL: Marginalized multilevel models and like-lihood inference. Stat Sci 2000, 15:1-26.
8. Hosmer DW, Lemeshow S: Goodness of fit tests for the multi-ple logistic regression model. Commun Stat 1980, A9:1043-1069. 9. Qu A, Song P: Assessing robustness of generalized estimating equations and quadratic inference functions. Biometrika 2004,
91:447-459.
10. Qu A, Li R: Quadratic inference functions for varying-coeffi-cient models with longitudinal data. Biometrics 2006,
62(2):379-391.
11. Heagerty PJ, Zeger SL: Lorelogram: A regression approach to exploring dependence in longitudinal categorical responses.
JASA 1998, 93:150-162.
12. Hansen L: Large sample properties of generalized method of moments estimators. Econometrica 1982, 50:1029-1054.
13. Statistics Canada and Human Resources Development Canada: Micro-data user guide: National longitudinal survey of children and youth. Ottawa
2002.
14. Likert R: A technique for the measurement of attitudes. Arch Psychol 1932, 140:1-55.
15. Understanding the Early Years: An Update of Early Child-hood Development Results in Four Canadian Communities
[http://www.hrsdc.gc.ca/en/cs/sp/sdc/pkrf/publications/nlscy/uey/ 2005-072005/page05.shtml]
16. Multi-Level Effects on Behaviour Outcomes in Canadian Children [http://www.hrsdc.gc.ca/en/cs/sp/sdc/pkrf/publications/ research/2001-000124/page07.shtml]
17. Offord DR, Lipman EL: Emotional and behavioural problems. In
Growing Up in Canada: National Longitudinal Survey of Children and Youth
Ottawa: Statistics Canada and Human Resources Canada; 1996:119-126.
18. Radloff LS: The CES-D scale: A self report depression scale for research in the general population. App Psychol Meas 1977,
1:385-401.
19. To T, Guttmann A, Dick PT, Rosenfield JD, Parkin PC, Tassoudji M, Vydykhan TN, Kao H, Harris JK: Risk markers for poor develop-mental attainment in young children. Arch Pediatr Adolesc Med
2004, 158:643-649.
20. Epstein NB, Baldwin LM, Bishop DS: The McMaster family assess-ment device. J Marital Fam Ther 1983, 9:171-180.
21. Epstein NB, Bishop DS, Levin S: The McMaster family assess-ment device. J Marital Fam Ther 1978, 9:19-23.
22. Casella G, Berger RL: Statistical Inference Second edition. California: Duxbury Press; 2002.
23. Kerr D, Beaujot R: Family relations, low income, and child out-comes: A comparison of Canadian children in intact-, step-, and lone-parent families. IJCS 2002, 43:134-152.
24. Willms JD: Research findings bearing on Canadian social pol-icy. In Vulnerable Children: Findings from Canada's National Longitudinal Survey of Children and Youth Edited by: Willms JD. Edmonton Alberta: The University of Alberta Press; 2002:331-358.
25. Mahoney D: Maternal depression predicts ADHD in kids. Clin Psychiatry News 2007, 37:21.
26. St. Sauver JL, Barbaresi WJ, Katusic SK, Colligan RC, Weaver AL, Jacobsen SL: Early life risk factors for attention-Deficit/Hyper-activity disorder: A population-based cohort study. Mayo Clin Proc 2004, 79:1124-1131.
27. Kaplan BJ, Crawford SG, Fisher GC, Dewey DM: Family dysfunc-tion is more associated with ADHD than with general school problems. J Atten Disord 1998, 2:209-216.
28. SAS macro QIF manual 2007: Version 0.2 [http:// www.math.uwaterloo.ca/~song/QIFmanual.pdf]
29. Small CG, Wang J, Yang Z: Eliminating multiple root problems in estimation. Stat Sci 2000, 15:313-341.
30. Little RJ, Rubin DB: Statistical Analysis with Missing Data New York: J. Wiley & Sons; 1987.
Pre-publication history
The pre-publication history for this paper can be accessed here:
http://www.biomedcentral.com/1471-2288/8/28/prepub
Additional file 1
Glossary of terms. Provides the definitions of statistical terms used throughout the manuscript.
Click here for file
[http://www.biomedcentral.com/content/supplementary/1471-2288-8-28-S1.doc]
Additional file 2
GEE and QIF theory. Provides a brief review of the mathematical theory behind GEE and QIF.
Click here for file