R E S E A R C H
Open Access
Modifiers of short-term effects of ozone on
mortality in eastern Massachusetts - A
case-crossover analysis at individual level
Cizao Ren
*, Steve Melly, Joel Schwartz
Abstract
Background:Substantial epidemiological studies demonstrate associations between exposure to ambient ozone and mortality. A few studies simply examine the modification of this ozone effect by individual characteristics and socioeconomic status, but socioeconomic status was usually coded at the city level.
Methods:This study used a case-crossover design to examine whether impacts of ozone on mortality were modified by socioeconomic status coded at the tract or characteristics at an individual level in eastern
Massachusetts, US for a period May-September, 1995-2002, with a total of 157,197 non-accident deaths aging 35 years or older. We used moving averages of maximal 8-hour concentrations of ozone monitored at 8 stationary stations as personal exposure.
Results:A 10 ppb increase in the four-day moving average of maximal 8-hour ozone was associated with 1.68% (95% confidence interval (CI): 0.51%, 2.87%), 1.96% (95% CI: -1.83%, 5.90%), 8.28% (95% CI: 0.66%, 16.48%), 0.44% (95% CI: -1.45%, 2.37%), -0.83% (95% CI: -2.94%, 1.32%), -1.09% (95% CI: -4.27%, 2.19%) and 6.5% (95% CI: 1.74%, 11.49%) changes in all natural deaths, respiratory disorders, diabetes, cardiovascular diseases, heart diseases, acute myocardial infarction and stroke, respectively. We did not find any evidence that the associations were significantly modified by socioeconomic status or individual characteristics although small differences of estimates across subpopulations were demonstrated.
Conclusions:Exposure to ozone was associated with specific cause mortality in Eastern Massachusetts during May-September, 1995-2002. There was no evidence that effects of ozone on mortality were significantly modified by socioeconomic status and individual characteristics.
Background
Substantial epidemiological evidence demonstrates that ambient ozone is associated with daily deaths and hospi-tal admissions [1-5]. These associations are generally consistent across studies or robust to adjustment for secular time trends, short-term variation or weather conditions [6].
Recently, interest in epidemiological studies has grown in how socioeconomic status (SES), individual characteris-tics (e.g., age, race and gender) and weather conditions modify associations of exposure to air pollution with mor-tality and hospital admissions. This issue is important in
air pollution studies because better knowledge of these modifiers will increase the power to detect risk in future studies and aid in the identification of potential mechan-isms of pollutants [7]. Several studies have examined the variation of effects of particulate matter or ozone on health outcomes across temperature levels or seasons [8-13]. Recently, an increasing number of epidemiological studies have examined effect modifications of SES and individual characteristics on associations of particulate matter with health outcomes at population and individual levels [14-20]. However, to date, little work has been direc-ted toward identifying which subpopulations are more sus-ceptible to deaths due to effects of ambient ozone [21]. Many studies have examined effect modification using stratified methods [12,19,20], which will decrease the sta-tistical power and lack the ability to examine directly * Correspondence: [email protected]
Exposure, Epidemiology, and Risk Program, Department of Environmental Health, Harvard School of Public Health, Landmark Center, West, 4th floor, 401 Park Street, Boston, MA 02215, USA
interaction effect. Moreover, various estimates might be due to differential distributions of covariates across strata, not effect modification because subpopulations were not exchangeable in other variables. A very few studies exam-ined effect modification by socioeconomic status at the city level [1,22]. However, there is more variation in socio-economic status within urban areas than between urban areas. To date, no study has tried to examine area-based measures of socio-economic status as modifiers at a more geographically resolved area, such as the census tract, or to include both individual and area based measures as effect modifiers.
In the present study, we aimed to examine whether associations between ozone and daily mortality was modified by SES at the census tract level or by indivi-dual characteristics using a case-crossover design, which allows for the examination of effect modification at the individual level. As an alternative analytical methodology to Poisson regression, the case-crossover approach allows for the directly modeling of interaction term at an individual level rather than depending on multiple subgroups analyses as in the Poisson design. Conse-quently, we have the ability to model potential effect modifiers simply using one dataset without rebuilding a dataset when we examined effect modification for differ-ent factors. In addition, continuous effect modifiers can be examined without being categorized.
Methods
Mortality, weather and pollution data
The study population consisted of 162,146 deceased subjects aged 35 years or older from 3 counties (Suffolk, Middlesex, and Norfolk) in the eastern Massachusetts, USA for the period between January 1, 1995 and December 31, 2002 based on data availability. Residents in the counties consisted of about 44 percent of the state’s population. Individual mortality records were obtained from the Massachusetts Department of Public Health, and included all deaths from the chosen coun-ties. The dataset included major characteristics at indivi-dual level, such as age, gender, race, education and marital status. Individual residential address was geo-coded by a private firm by matching the address to state, city, ZIP code and street network data based on TIGER, and assigning to this street address latitude and longitude coordinates, as well as census tract and block group. The geocoding was then reassessed by us for accuracy and completeness. Using the 2000 US census, we then obtained the population per square kilometer dry land or population density in the block group and socioeconomic status in the census tract, including med-ian household income and percent of the population in the tract with 1999 income below the poverty level at the census tract level.
We identified the following characteristics and SES as potential effect modifiers, age, race, gender, education, marital status, population density, household income and percent poverty. We categorized age into 35-64 years, 65-74 years, 75-84 years, and 85 years or older, education into≤8 years, 9-12 years, 13-16 years and 17 years or more, marital status into never married, mar-ried or separated, widowed, and divorced, race into white & non-Hispanic, black, American Indian, Hispa-nic, Asian or Pacific, and others. We classified popula-tion density (residents per km2 in the block group), household income (median household income in the census tract in 1999) and poverty (percent of population in the census tract in 1999 below the poverty level) into low, medium and high using low and high quartiles as cut-offs.
We excluded accident or non-natural deaths in this study (4949, 3.05%) (International Classification of Dis-ease, ICD-9, I-799 or ICD-10 excluding V01-Y98). We classified each case according to their diagnoses based on their primary diagnosis of the following conditions: cardiovascular diseases (CVD) (ICD-9 codes 390-448, ICD-10 codes I00-I79), diabetes (ICD-9 code 250 or ICD-10 code E10-E14) and respiratory disorders (ICD-9 codes 480-486, 490-497, or 507, ICD-10 J100-J118, J120-J189, J209-J499, or J690-J700) [1]. We further identified heart disease (ICD-9 codes 391-429 or ICD-10 codes I01-I51), acute myocardial infarction (ICD-9 codes 410-414, ICD-10 codes I21-I22) and stroke (ICD-9 codes 430-438, ICD-10 codes I60-I69) from the cardiovascular disease category [16].
We obtained air pollution and meteorological data from the Environmental Protection Agency, USA (USA Air Quality System: http://www.epa.gov/ttn/airs/airsaqs/ detaildata/downloadaqsdata.htm). Hourly concentrations of ambient ozone were recorded at each of eight station-ary monitoring sites located in these counties set up by the agency. We first calculated means of hourly ozone concentration from all eight monitoring sites and then calculated daily maximal 8-hour concentrations during the study period. The moving averages of daily maximal 8-hour ozone up to seven days were used as personal exposure. We used maximal 8-hour concentration of ambient ozone because WHO recommended that maxi-mal 8-hour mean reflects the most health-related expo-sure to ozone [23]. We used apparent temperature as an index, defined as a person’s perceived air temperature, given the humidity [24].
Data analysis
outcomes. Since each case-set is made of a single sub-ject, all individual time-invariant characteristics are per-fectly matched, and therefore, each potential time-invariant known or unknown individual confounder is automatically adjusted for. There are several referent selection strategies in case-crossover designs [25]. Refer-ent days in this study were selected according to the time-stratified approach, by dividing the study period into monthly strata. We selected every third day within the stratum of the case event as referents of the event to decrease serial correlation and excluded referents within seven days before and after the case event because we used up to seven day-moving averages of ozone as exposure indices and the accumulative effects of ozone effect might offset estimations. We then fit the conditional logistical regression models to estimate asso-ciations between ozone exposure and mortality and examine effect modification using PROC PHREG in SAS (SAS software Release 9.1; SAS Institute, Cary, NC, 20084) [25].
Because days of the week effect were not explicitly adjusted for in our study design, we adjusted for days of week as a categorical variable in each model. We used a moving average of daily apparent temperature and its quadratic term in each model because of potential non-linear relationships between apparent temperature and health outcomes. In order to determine the period of moving averages of the temperature, we separately fit models that only included linear and quadratic terms of a moving average of temperature and days of the week and replaced the temperature terms with different day-moving averages of temperature from the current day to seven days. The four-day moving average of daily appar-ent temperature was chosen in the final models to mini-mize the Akaike information criterion (AIC) index. We then estimated the effects of ozone on health outcomes adjusting for temperature and days of the week.
To examine the effect modification by each selected variable or modifier (a categorical variable), we sepa-rately fit models including the interactive term for ozone and the modifier at a time. We then linearly com-bined the coefficients for referent group and interactive terms to assess the associations by the modifier. We were particularly interested in the impacts of a subject specific measure of socioeconomic status (educational attainment) and area based measures (median household income, poverty). All analyses were restricted to the per-iods between May 1st and September 30th, 1995-2002 because the concentrations of ozone in cold seasons were very low in the area and many other studies only examined ozone effects in warmer seasons, or found such an association only existed in the warm seasons [1,2,8,9,26,27].
Results
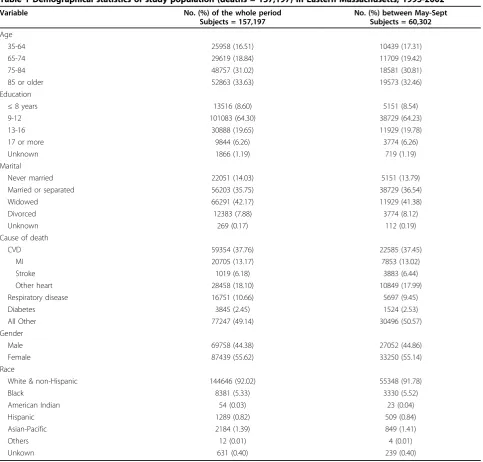
Table 1 shows the demographic description for the decedents. Results show that nearly 65% of deaths were over 75 years old and white was the dominant race, but 16.51% died before 65 years old for the whole period. 64.3% of the decedents had between 9 and12 years of education and over one quarter had 13 years education or more. Females were composed of 55.62% of the deaths. Averages of maximal 8-hour, daily ozone and daily apparent temperature were 41.46 (Standard Devia-tion (SD):17.26) ppb, 27.51 (SD: 12.42) ppb, and 18.32 (SD: 6.97) °C during May-September, 1995-2002, respectively.
We separately assessed associations using ozone on the current day to moving averages up to the previous week. All presented results show effects of ozone on all natural deaths after adjusting for days of the week and linear and quadratic terms for the four-day moving aver-age of apparent temperature (Table 2). The estimated associations show little change across different moving averages. Because the estimate was slightly stronger than those for other moving-averages, we used the four-day moving average in the analysis of specific causes of death and effect modifications. Per 10 ppb increase of the average of maximal 8-hour ozone in the previous week was associated with 1.61% (95% confidence inter-val (CI): 0.25%, 3.00%) increase in non-accident deaths. The interquartile ranges (IQR) of ozone were varied across different daily moving days and longer moving day, the lower concentration.
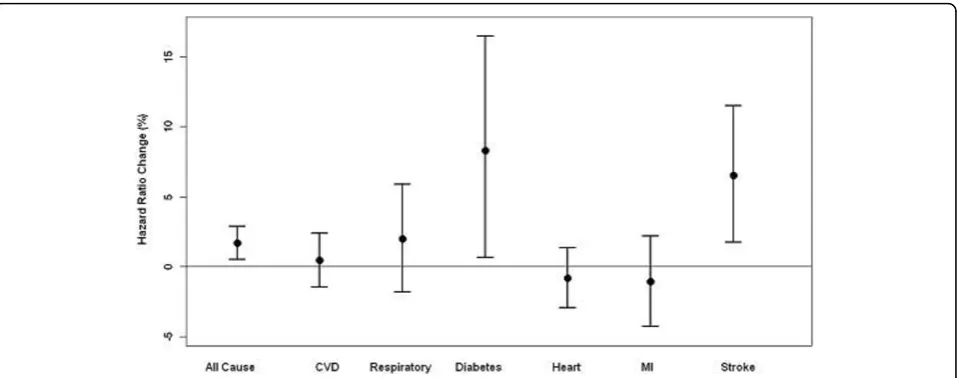
We further examined associations of exposure to the four-day moving average of maximal 8-hour ozone with specific causes of death, including cardiovascular dis-eases, diabetes, respiratory disease, heart disdis-eases, acute myocardial infarction and stroke, adjusting for days of the week and apparent temperature as above. Figure 1 shows that exposure to ozone was strongly associated with diabetes and stroke, slightly stronger with respira-tory disorders, but weakly with heart diseases, myocar-dial infarction or cardiovascular diseases. Per 10 ppb increase in the average of maximal 8-hour ozone in the previous four days was associated with 1.96% (95% CI: -1.83%, 5.90%), 8.28% (95% CI: 0.66%, 16.48%), 0.44% (95% CI: -1.45%, 2.37%), -0.83% (95% CI: -2.94%, 1.32%), -1.09% (95% CI: -4.27%, 2.19%) and 6.50% (95% CI: 1.74%, 11.49%) changes in deaths from respiratory disor-ders, diabetes, cardiovascular diseases, heart, acute myo-cardial infarction and stroke, respectively.
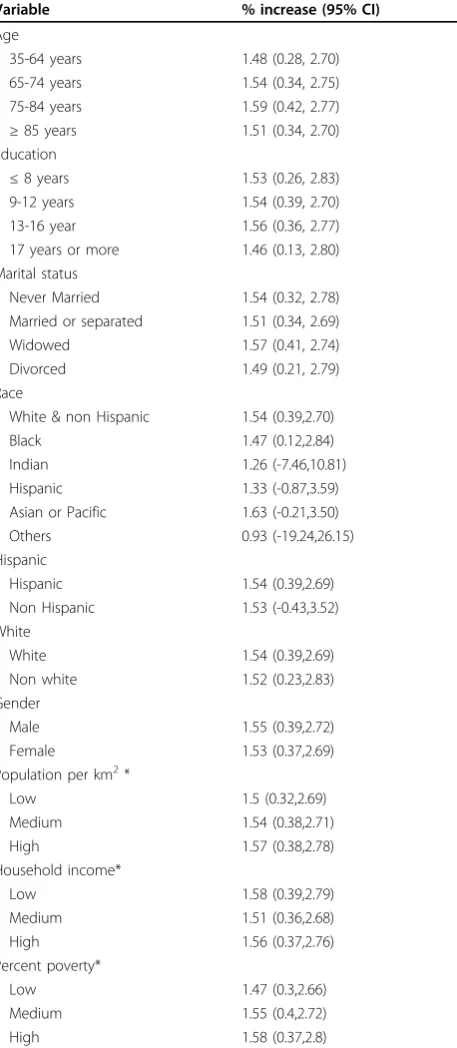
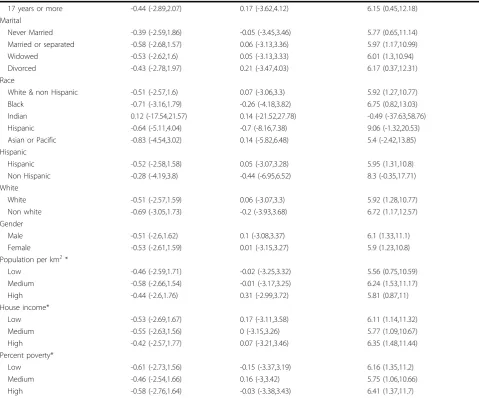
potential modifier one by one. This study did not find any obvious evidence that the association between ozone and non-accident mortality was modified by age, gender, race, education, marital status, population den-sity, median household income and percent poverty in the block group (all p-values of coefficients of interac-tion terms were more than 0.2). Of note, we found little evidence that ozone only affected the elderly, with a sig-nificant association with mortality in the 35-64 year age group that was essentially identical in size to that for the oldest age group. Interactions with educational level and median household income were likewise not signifi-cant. We also examined effect modifications for other
Table 1 Demographical statistics of study population (deaths = 157,197) in Eastern Massachusetts, 1995-2002
Variable No. (%) of the whole period
Subjects = 157,197
No. (%) between May-Sept Subjects = 60,302
Age
35-64 25958 (16.51) 10439 (17.31)
65-74 29619 (18.84) 11709 (19.42)
75-84 48757 (31.02) 18581 (30.81)
85 or older 52863 (33.63) 19573 (32.46)
Education
≤8 years 13516 (8.60) 5151 (8.54)
9-12 101083 (64.30) 38729 (64.23)
13-16 30888 (19.65) 11929 (19.78)
17 or more 9844 (6.26) 3774 (6.26)
Unknown 1866 (1.19) 719 (1.19)
Marital
Never married 22051 (14.03) 5151 (13.79)
Married or separated 56203 (35.75) 38729 (36.54)
Widowed 66291 (42.17) 11929 (41.38)
Divorced 12383 (7.88) 3774 (8.12)
Unknown 269 (0.17) 112 (0.19)
Cause of death
CVD 59354 (37.76) 22585 (37.45)
MI 20705 (13.17) 7853 (13.02)
Stroke 1019 (6.18) 3883 (6.44)
Other heart 28458 (18.10) 10849 (17.99)
Respiratory disease 16751 (10.66) 5697 (9.45)
Diabetes 3845 (2.45) 1524 (2.53)
All Other 77247 (49.14) 30496 (50.57)
Gender
Male 69758 (44.38) 27052 (44.86)
Female 87439 (55.62) 33250 (55.14)
Race
White & non-Hispanic 144646 (92.02) 55348 (91.78)
Black 8381 (5.33) 3330 (5.52)
American Indian 54 (0.03) 23 (0.04)
Hispanic 1289 (0.82) 509 (0.84)
Asian-Pacific 2184 (1.39) 849 (1.41)
Others 12 (0.01) 4 (0.01)
Unkown 631 (0.40) 239 (0.40)
Table 2 Estimated percent increase in natural mortality per 10 ppb in average of maximal 8-hour ozone
IQR (ppb) % increase (95% CI)
Current day 20.79 1.32 (0.74, 1.91)
Moving average at 1-day lag 19.11 1.66 (0.96, 2.36)
Moving average at 2-day lag 16.75 1.61 (0.78, 2.45)
Moving average at 3-day lag 15.47 1.61 (0.61, 2.62)
Moving average at 4-day lag 14.78 1.68 (0.51, 2.87)
Moving average at 5-day lag 13.96 1.56 (0.27, 2.87)
Moving average at 6-day lag 13.45 1.61 (0.25, 3.00)
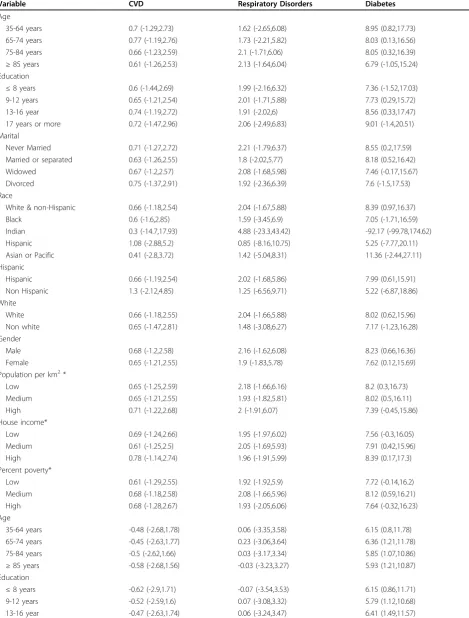
outcomes including respiratory disorders, CVD and stroke. As non-accident deaths, again, there was no obvious evidence demonstrating effect modifications (Table 4).
Discussion
In this study, exposure to ambient ozone in the short term was positively associated with daily deaths in East-ern Massachusetts during May-September, 1995-2002, consistent with evidence from other parts of the world [1,21]. We saw no consistent gradients in effect modifi-cation by individual characteristics and social economic status, and in particular no gradient by either individual level socioeconomic status or area-based socioeconomic status, which was based on small areas (block groups) that were designed to minimize within area gradients while maximizing between area gradients. We did find that the effect was seen in the 35-64 year age group, with essentially the same risk as for older ages, indicat-ing that the effects of ozone are not limited to persons with little life expectancy remaining. In addition, we found that the estimates were stronger when the average periods were extended.
There is a substantial epidemiological literature show-ing clear and consistent association between exposure to ambient ozone and mortality [5,9,13,22]. Of great inter-est are biological mechanisms by which ambient ozone could cause morbidity and mortality. One way investiga-tors can identify the potential mechanisms is to assess whether some subpopulations with specific characteris-tics or at different socioeconomic status are especially sensitive to health effects. The identification of sets of
individuals who are more sensitive to exposure to ozone may suggest possible mechanisms of physiological attacks as well as provide clues for more detailed risk assessment. However, it should be noted that the vul-nerability may also indicate other non biological factors, such as health care access issues.
Several other studies also examined different vulner-ability between specific causes when they examined associations between ozone air pollution and human health, but findings were inconsistent [2,27]. Gryparis et al. conducted a time-series study to investigate associa-tions between ozone and mortality in 21 European cities and found that a 10-ppb increase in the 2-day average of 8-hour ozone was associated with 0.31% (95% CI: 0.17%, 0.52%), 1.13% (95% CI: 0.74%, 1.51%) and 0.46% (95% CI: 0.22%, 0.73%) increases in total mortality, respiratory and cardiovascular mortality in summer, respectively [28]. Bell et al. conducted a meta-analysis of 144 effect estimates from 39 time-series studies and found that a 10-ppb increase of ozone at short-term lags were related to 0.87% (95% posterior interval or PI: 0.55%, 1.18%), 0.47% (95% PI: -0.51%, 1.47%) and 1.11% (95% PI: 0.68%, 1.53%) increases in total, respiratory and cardiovascular mortality, respectively [2]. The two large multi-city time-series studies found that these vulner-abilities of respiratory and cardiovascular diseases to exposure to ozone were controversial.
So far, a few studies examined the vulnerability of sub-populations with diabetes or stroke to ozone air pollu-tion [21]. Medina-Ramün and Schwartz [21] examined who were particularly vulnerable to ozone air pollution in 48 US cities and did not find that persons who died
from stroke or diabetes were more susceptible to ozone air pollution compared to those who died from other specific causes. Our data suggest that people with dia-betes or stroke were at more risk than people with more general heart or lung conditions. A 10-ppb increase in a four-day moving average of maximal 8-hour ozone was associated with 1.68% (95% CI: 0.51%, 2.87%), 1.96% (95% CI: -1.83%, 5.90%) and 0.44% (95% CI: -1.45%, 2.37%) increases of total, respiratory and cardiovascular mortality, respectively. This issue remains clarified for other studies.
Some studies examined such vulnerabilities for parti-culate air pollution and found that people with diabetes were more sensitive to particulate matter pollution [13,16,19,29,30]. For example, Zanobetti et al. found that the concurrent diabetes doubled the risk of particu-late matter to cardiovascular disease [29]. Goldberg et al found that those with diabetes were more susceptible to particles [30]. Zeka et al. reported that a secondary diag-nosis of diabetes modified the associations of PM10with respiratory and stroke mortality [16]. O’Neill et al. examined vulnerability among 270 greater-Boston resi-dents and found that persons with diabetes were more susceptible to particulate air pollution [19].
Recently, a small number of studies assessed the effect modifications of ambient ozone on health by individual characteristics and socioeconomic status [21,22]. Med-ina-Ramün & Schwartz reported that in a multiple com-munity study, each 10 ppb ozone increase (average 0-2 lags) was associated with 1.10% additional increase in mortality of people aged ≥ 65 years compared with younger age [21]. They also reported that women over age 60 and black people were particularly susceptible. Bell & Dominici examined the effect modification of ozone and mortality in 98 US communities by socioeco-nomic statuses at a city level [22]. They found that com-munity-level factors modified the association between ambient ozone and mortality. They stated that higher effect estimates were associated with higher unemploy-ment and the fraction of the Black/Africa-American population. However, this study did not find any evi-dence that individual characteristics and socioeconomic levels modified associations between ozone and mortal-ity. In contrast, we find the people aged 35-64 experi-enced similar risk of death due to ozone exposure, which was different from findings from other studies [1,21,31-33].
There are several possible explanations for this diver-gence. Given a limited area, our findings could be by chance. On the other hand, the Bell and Dominici’s results may reflect the impact of regional differences in socioeconomic status and racial composition, which could be standing for different things than the within urban differences we examined. For example, diet and
Table 3 Percent changes in natural deaths per 10 ppb of four-day average of maximal 8-hour ozone
Variable % increase (95% CI)
Age
35-64 years 1.48 (0.28, 2.70)
65-74 years 1.54 (0.34, 2.75)
75-84 years 1.59 (0.42, 2.77)
≥85 years 1.51 (0.34, 2.70)
Education
≤8 years 1.53 (0.26, 2.83)
9-12 years 1.54 (0.39, 2.70)
13-16 year 1.56 (0.36, 2.77)
17 years or more 1.46 (0.13, 2.80)
Marital status
Never Married 1.54 (0.32, 2.78)
Married or separated 1.51 (0.34, 2.69)
Widowed 1.57 (0.41, 2.74)
Divorced 1.49 (0.21, 2.79)
Race
White & non Hispanic 1.54 (0.39,2.70)
Black 1.47 (0.12,2.84)
Indian 1.26 (-7.46,10.81)
Hispanic 1.33 (-0.87,3.59)
Asian or Pacific 1.63 (-0.21,3.50)
Others 0.93 (-19.24,26.15)
Hispanic
Hispanic 1.54 (0.39,2.69)
Non Hispanic 1.53 (-0.43,3.52)
White
White 1.54 (0.39,2.69)
Non white 1.52 (0.23,2.83)
Gender
Male 1.55 (0.39,2.72)
Female 1.53 (0.37,2.69)
Population per km2*
Low 1.5 (0.32,2.69)
Medium 1.54 (0.38,2.71)
High 1.57 (0.38,2.78)
Household income*
Low 1.58 (0.39,2.79)
Medium 1.51 (0.36,2.68)
High 1.56 (0.37,2.76)
Percent poverty*
Low 1.47 (0.3,2.66)
Medium 1.55 (0.4,2.72)
High 1.58 (0.37,2.8)
Adjusting for linear and quadratic apparent temperature and days of week in the Eastern Massachusetts, May-September, 1995-2002. CI: confidence interval; * Use low and high quartiles as cut-offs. Low and high quartiles are 1016.35 and 6400 residents per km2
Table 4 Percent changes in specific cause deaths per 10 ppb of four-day average of 8-hour ozone
Variable CVD Respiratory Disorders Diabetes
Age
35-64 years 0.7 (-1.29,2.73) 1.62 (-2.65,6.08) 8.95 (0.82,17.73)
65-74 years 0.77 (-1.19,2.76) 1.73 (-2.21,5.82) 8.03 (0.13,16.56)
75-84 years 0.66 (-1.23,2.59) 2.1 (-1.71,6.06) 8.05 (0.32,16.39)
≥85 years 0.61 (-1.26,2.53) 2.13 (-1.64,6.04) 6.79 (-1.05,15.24)
Education
≤8 years 0.6 (-1.44,2.69) 1.99 (-2.16,6.32) 7.36 (-1.52,17.03)
9-12 years 0.65 (-1.21,2.54) 2.01 (-1.71,5.88) 7.73 (0.29,15.72)
13-16 year 0.74 (-1.19,2.72) 1.91 (-2.02,6) 8.56 (0.33,17.47)
17 years or more 0.72 (-1.47,2.96) 2.06 (-2.49,6.83) 9.01 (-1.4,20.51)
Marital
Never Married 0.71 (-1.27,2.72) 2.21 (-1.79,6.37) 8.55 (0.2,17.59)
Married or separated 0.63 (-1.26,2.55) 1.8 (-2.02,5.77) 8.18 (0.52,16.42)
Widowed 0.67 (-1.2,2.57) 2.08 (-1.68,5.98) 7.46 (-0.17,15.67)
Divorced 0.75 (-1.37,2.91) 1.92 (-2.36,6.39) 7.6 (-1.5,17.53)
Race
White & non-Hispanic 0.66 (-1.18,2.54) 2.04 (-1.67,5.88) 8.39 (0.97,16.37)
Black 0.6 (-1.6,2.85) 1.59 (-3.45,6.9) 7.05 (-1.71,16.59)
Indian 0.3 (-14.7,17.93) 4.88 (-23.3,43.42) -92.17 (-99.78,174.62)
Hispanic 1.08 (-2.88,5.2) 0.85 (-8.16,10.75) 5.25 (-7.77,20.11)
Asian or Pacific 0.41 (-2.8,3.72) 1.42 (-5.04,8.31) 11.36 (-2.44,27.11)
Hispanic
Hispanic 0.66 (-1.19,2.54) 2.02 (-1.68,5.86) 7.99 (0.61,15.91)
Non Hispanic 1.3 (-2.12,4.85) 1.25 (-6.56,9.71) 5.22 (-6.87,18.86)
White
White 0.66 (-1.18,2.55) 2.04 (-1.66,5.88) 8.02 (0.62,15.96)
Non white 0.65 (-1.47,2.81) 1.48 (-3.08,6.27) 7.17 (-1.23,16.28)
Gender
Male 0.68 (-1.2,2.58) 2.16 (-1.62,6.08) 8.23 (0.66,16.36)
Female 0.65 (-1.21,2.55) 1.9 (-1.83,5.78) 7.62 (0.12,15.69)
Population per km2*
Low 0.65 (-1.25,2.59) 2.18 (-1.66,6.16) 8.2 (0.3,16.73)
Medium 0.65 (-1.21,2.55) 1.93 (-1.82,5.81) 8.02 (0.5,16.11)
High 0.71 (-1.22,2.68) 2 (-1.91,6.07) 7.39 (-0.45,15.86)
House income*
Low 0.69 (-1.24,2.66) 1.95 (-1.97,6.02) 7.56 (-0.3,16.05)
Medium 0.61 (-1.25,2.5) 2.05 (-1.69,5.93) 7.91 (0.42,15.96)
High 0.78 (-1.14,2.74) 1.96 (-1.91,5.99) 8.39 (0.17,17.3)
Percent poverty*
Low 0.61 (-1.29,2.55) 1.92 (-1.92,5.9) 7.72 (-0.14,16.2)
Medium 0.68 (-1.18,2.58) 2.08 (-1.66,5.96) 8.12 (0.59,16.21)
High 0.68 (-1.28,2.67) 1.93 (-2.05,6.06) 7.64 (-0.32,16.23)
Age
35-64 years -0.48 (-2.68,1.78) 0.06 (-3.35,3.58) 6.15 (0.8,11.78)
65-74 years -0.45 (-2.63,1.77) 0.23 (-3.06,3.64) 6.36 (1.21,11.78)
75-84 years -0.5 (-2.62,1.66) 0.03 (-3.17,3.34) 5.85 (1.07,10.86)
≥85 years -0.58 (-2.68,1.56) -0.03 (-3.23,3.27) 5.93 (1.21,10.87)
Education
≤8 years -0.62 (-2.9,1.71) -0.07 (-3.54,3.53) 6.15 (0.86,11.71)
9-12 years -0.52 (-2.59,1.6) 0.07 (-3.08,3.32) 5.79 (1.12,10.68)
lifestyle differences could show different correlations with such variables betweenvs within city. The differ-ences between this assessment of individual level effect modifiers and the paper of Medina-Ramon et al. [4] is more likely due to the much smaller number of deaths examined. We were not able to look at gender differ-ences stratified by age, as in that paper, for example. The differences may also be attributable to the different methodology used at some extent.
Although many previous studies recently reported effect modification of exposure to ambient air pollutants by socioeconomic statuses, individual characteristics, weather conditions or even genotypes, a very small pro-portion of them directly examined whether or not esti-mated effect modifications are significant [8-10,17]. Some studies examined effect modifications at
community levels at the second-stage meta-analyses [22,34], but this design could not efficiently examine whether there is a significant effect modification at an individual level. The estimated effect modifications could be partially attributable to differential bias from exposure misclassification caused by some factors such as temperature, age, education and poverty because these factors are related to residential behaviors in com-munities. Similarly, in the stratification studies dividing a whole population into subpopulations based on a fac-tor [12,20], the different estimated effects across subpo-pulations might be interpreted to some extent as differential distributions of the risk factors adjusted or unadjusted for in subpopulations because subpopula-tions were not exchangeable for other factors. Moreover, these designs did not directly examine an interactive
Table 4: Percent changes in specific cause deaths per 10 ppb of four-day average of 8-hour ozone(Continued)
17 years or more -0.44 (-2.89,2.07) 0.17 (-3.62,4.12) 6.15 (0.45,12.18)
Marital
Never Married -0.39 (-2.59,1.86) -0.05 (-3.45,3.46) 5.77 (0.65,11.14)
Married or separated -0.58 (-2.68,1.57) 0.06 (-3.13,3.36) 5.97 (1.17,10.99)
Widowed -0.53 (-2.62,1.6) 0.05 (-3.13,3.33) 6.01 (1.3,10.94)
Divorced -0.43 (-2.78,1.97) 0.21 (-3.47,4.03) 6.17 (0.37,12.31)
Race
White & non Hispanic -0.51 (-2.57,1.6) 0.07 (-3.06,3.3) 5.92 (1.27,10.77)
Black -0.71 (-3.16,1.79) -0.26 (-4.18,3.82) 6.75 (0.82,13.03)
Indian 0.12 (-17.54,21.57) 0.14 (-21.52,27.78) -0.49 (-37.63,58.76)
Hispanic -0.64 (-5.11,4.04) -0.7 (-8.16,7.38) 9.06 (-1.32,20.53)
Asian or Pacific -0.83 (-4.54,3.02) 0.14 (-5.82,6.48) 5.4 (-2.42,13.85)
Hispanic
Hispanic -0.52 (-2.58,1.58) 0.05 (-3.07,3.28) 5.95 (1.31,10.8)
Non Hispanic -0.28 (-4.19,3.8) -0.44 (-6.95,6.52) 8.3 (-0.35,17.71)
White
White -0.51 (-2.57,1.59) 0.06 (-3.07,3.3) 5.92 (1.28,10.77)
Non white -0.69 (-3.05,1.73) -0.2 (-3.93,3.68) 6.72 (1.17,12.57)
Gender
Male -0.51 (-2.6,1.62) 0.1 (-3.08,3.37) 6.1 (1.33,11.1)
Female -0.53 (-2.61,1.59) 0.01 (-3.15,3.27) 5.9 (1.23,10.8)
Population per km2*
Low -0.46 (-2.59,1.71) -0.02 (-3.25,3.32) 5.56 (0.75,10.59)
Medium -0.58 (-2.66,1.54) -0.01 (-3.17,3.25) 6.24 (1.53,11.17)
High -0.44 (-2.6,1.76) 0.31 (-2.99,3.72) 5.81 (0.87,11)
House income*
Low -0.53 (-2.69,1.67) 0.17 (-3.11,3.58) 6.11 (1.14,11.32)
Medium -0.55 (-2.63,1.56) 0 (-3.15,3.26) 5.77 (1.09,10.67)
High -0.42 (-2.57,1.77) 0.07 (-3.21,3.46) 6.35 (1.48,11.44)
Percent poverty*
Low -0.61 (-2.73,1.56) -0.15 (-3.37,3.19) 6.16 (1.35,11.2)
Medium -0.46 (-2.54,1.66) 0.16 (-3,3.42) 5.75 (1.06,10.66)
High -0.58 (-2.76,1.64) -0.03 (-3.38,3.43) 6.41 (1.37,11.7)
effect but simply main effects in terms of statistical the-ory [35,36]. As we know, in any epidemiological studies, estimated associations are subject to true risk, variations attributable to differential distributions of many factors adjusted or unadjusted for across populations, bias from error measures of dependent and independent variables as well as a chance. Therefore, the different effect esti-mates across populations or subpopulations would be commonly expected. If inconsiderable different estimates between subpopulations or populations are demon-strated in these kinds of study designs, the interpreta-tion of the differences as an effect modificainterpreta-tion should be particularly cautious.
Another important issue may be publication bias [37-42]. Journals tend to publish papers reporting sig-nificant findings and those without sigsig-nificant findings are less likely to be published even though their study designs were not poorer or even better than those published. Similarly, authors tend to report significant results and the uncertainty of model selections helps significant findings. Although the issue has been criti-cized by many authors, papers reporting non-signifi-cant findings may still be discriminated to some extent because journals tend to pursue high citations [42].
This study used geographic information system (GIS) (ArcGIS, ESRI, Redlands, CA) to identify the geographic coordinates of personal residential addresses and then link the addresses to the census tract dataset to obtain socioeconomic status information. This study used a case-crossover design to identify effect modification at individual levels and test the significance of interaction. All time-invariant variables were autonomically con-trolled by design except for temperature and days of the week. Therefore, the study design has its own advan-tages. However, as in many air pollution studies, the average of ozone measures at the several fixed monitor-ing sites as a surrogate of individual exposures might result in misclassification bias. The extent of error depends on the spatial homogeneity of the exposure, as we compared exposures with temporality. A recent study compared ambient concentrations with personal exposures with monitoring measurement and results showed high correlation between these two measure-ments for PM2.5in the Boston area [43]. Although there is no exact evidence for the homogeneity of ozone in this study, in general, the gaseous pollution is more homogeneous than particulate air pollution. Neverthe-less, if the misclassification is nondifferential, any poten-tial bias will tend toward the null. In addition, this study only included three counties in the eastern Massachu-setts with over 1,570,000 of population. The limited population and the local area restricted its generalization to other places.
Conclusions
This study found consistent associations between expo-sure to ambient ozone and mortality (all natural deaths, respiratory disorders, CVD and stroke) adjusting for apparent temperature and days of week. There was no evidence that the individual characteristics and socioeco-nomic statuses (age, race, gender, education, marital sta-tus, local population density, average household income and percent poverty at the census blocks) modified asso-ciations between exposure to maximal 8-hour ozone and natural or cause-specific mortality in previous four days.
Abbreviations
SES: socioeconomic status; ICD: International Classification of Disease; CVD: cardiovascular diseases; AIC: Akaike information criterion; SD: Standard Deviation; IQR: interquartile ranges; GIS: geographic information system
Acknowledgements
This study was supported by the U.S. Environmental Protection Agency grant EPA R832416.
Authors’contributions
CR was responsible for study design, data analyses, result interpretation and manuscript writing. SM was responsible for gecoding of data,
socioeconomic data collection and result interpretation. JS was responsible for study design, data collection and result interpretation. All authors read and approved the final manuscripts.
Competing interests
The authors declare that they have no competing interests.
Received: 22 July 2009
Accepted: 21 January 2010 Published: 21 January 2010
References
1. Bell ML, McDermott A, Zeger SL, Samet JM, Dominici F:Ozone and short-term mortality in 95 US Urban Communities, 1987-2000.JAMA2004, 292:2372-2378.
2. Bell ML, Dominici F, Samet JM:A meta-analysis of time-series studies of ozone and mortality with comparison to the National Morbidity, Mortality, and Air Pollution Study.Epidemiology2005,16:436-445. 3. Levy JI, Chemerynski SM, Sarnat JA:Ozone exposure and mortality: an
empiric Bayes metaregression analysis.Epidemiology2005,16:458-468. 4. Medina-Ramün M, Zanobetti A, Schwartz J:The effect of ozone and PM10
on hospital admissions for pneumonia and chronic obstructive pulmonary disease: a national multicity study.Am J Epidemiol2006, 163:579-588.
5. Schwartz J:How sensitive is the association between ozone and daily deaths to control for temperature?.Am J Respir Crit Care Med2005, 171:627-631.
6. Franklin M, Schwartz J:The impact of secondary particles on the association between ambient ozone and mortality.Environ Health Perspect2008,116:453-458.
7. Bates DV:Health indices of the adverse effects of air pollution: the question of coherence.Environ Res1992,59:336-349.
8. Roberts S:Interaction between particulate air pollution and temperature in air pollution mortality time series studies.Environ Res2004,96:328-337. 9. Ren C, Williams GM, Mengersen K, Morawska L, Tong S:Does temperature
modify short-term ozone on total mortality in 60 large eastern US communities? -an assessment using the NMMAPS data.Environ Int2008, 34:451-458.
10. Ren C, Williams GM, Morawska L, Mengersen K, Tong S:Ozone modifies associations between temperature and cardiovascular mortality: analysis of the NMMAPS data.Occup Environ Med2008,65:255-260.
mortality? A multicity case-crossover analysis in Italy.Am J Epidemiol 2008,167:1476-1485.
12. Kan H, London SJ, Chen G, Zhang Y, Song G, Zhao N, Jiang L, Chen B: Season, sex, age, and education as modifiers of the effects of outdoor air pollution on daily mortality in Shanghai, China: the Public Health and Air Pollution in Asia (PAPA) study.Environ Health Perspect2008, 116:1183-1188.
13. Ren C, Williams GM, Mengersen K, Morawska L, Tong S:Temperature enhanced effects of ozone on cardiovascular mortality in 95 large US communities, 1987-2000: assessment using the NMMAPS data.Arch Environ Occup Health2009,64:177-184.
14. Bateson TF, Schwartz J:Who is sensitive to the effects of particulate air pollution on mortality.Epidemiology2004,15:143-149.
15. Dobowsky SD, Suh H, Schwartz J, Coull BA, Gold DR:Diabetes, obesity, and hypertension may enhance associations between air pollution and markers of systemic inflammation.Environ Health Perspect2006, 114:992-998.
16. Zeka A, Zanobetti A, Schwartz J:Individual-level modifiers of the effects of particulate matter on daily mortality.Am J Epidemiol2006,163:849-859. 17. Forastiere F, Stafoggia M, Berti G, Bisanti L, Cernigliaro A, Chiusolo M,
Mallone S, Miglio R, Pandolfi P, Rognoni M, Serinelli M, Tessari R, Vigotti M, Perucci CA:Particulate matter and daily mortality: a case-crossover analysis of individual effect modifiers.Epidemiology2008,19:571-580. 18. Chen J, Cavallari JM, Stone PH, Christiani DC:Obesity is a modifier of
autonomic cardiac responses to fine metal particulates.Environ Health Perspect2007,115:1002-1006.
19. O’Neill MS, Veves A, Zanobetti A, Sarnat JA, Gold DR, Economides PA, Horton ES, Schwartz J:Diabetes enhances vulnerability to particulate air pollution-associated impairment in vascular reactivity and endothelial function.Circulation2005,111:2913-2920.
20. O’Neill MS, Bell ML, Ranjit N, Cifuentes LA, Loomis D, Gouveia N, Borja-Aburto VH:Air pollution and mortality in Latin America: the role of education.Epidemiology2008,19:810-819.
21. Medina-Ramün M, Schwartz J:Who is more vulnerable to die from ozone air pollution?.Epidemiology2008,19:672-679.
22. Bell ML, Dominici F:Effect modification by community characteristics on the short-term effects of ozone exposure and mortality in 98 US communities.Am J Epidemiol2008,167:986-997.
23. The World Health Organization:Air quality guideline for Europe. Copenhagen: World Health Organization 2000.
24. Kalkstein LS, Valimont KM:An evaluation of summer discomfort in the United States using a relative climatological index.Bull Am Meteorol Soc 1986,67:842-848.
25. Levy D, Lumley T, Sheppard L, Kaufman J, Checkoman H:Referent selection in case-crossover analyses of acute health effects of air pollution.Epidemiology2001,12:186-192.
26. Zanobetti A, Schwartz J:Is there adaptation in the ozone-mortality relationship: A multi-city case crossover analysis.Environmental Health 2008,7:22.
27. Zanobetti A, Schwartz J:Mortality displacement in the Association of Ozone with Mortality: An analysis of 48 US Cities.Am J Resp Crit Care Med2008,177:184-189.
28. Gryparis A, Forsberg B, Katsouyanni K, Analitis A, Touloumi G, Schwartz J, Samoli E, Medina S, Anderson HR, Niciu EM, Wichmann H, Kriz B, Kosnik M, Skorkovsky J, Vonk JM, Dörbudak Z:Acute effects of ozone on mortality from the“air pollution and health: a European approach”project.Am J Respir Crit Care Med2004,170:1080-1087.
29. Zanobetti A, Schwartz J:Cardiovascular damage by airborne particles: are diabetics more susceptible?.Epidemiology2002,13:588-592.
30. Goldberg MS, Burnet RT, Bailar JC, Brook J, Bonvalot Y, Tamblyn R, Singh R, Valois MF, Vincent R:The association between daily mortality and ambient air particle pollution in Montreal, Quebec, 2: cause-specific mortality.Environ Res2001,86:26-36.
31. Zhang Y, Huang W, London SJ, Song G, Chen G, Jiang L, Zhao N, Chen B, Kan H:Ozone and daily mortality in Shanghai, China.Environ Health Perspect2006,114:1227-1232.
32. Cakmak S, Dales RE, Vidal CB:Air pollution and mortality in Chile: susceptibility among the elderly.Environ Health Perspect2007, 115:524-527.
33. O’Neill MS, Loomis D, Borja-Aburto VH:Ozone, area social conditions, and mortality in Mexico City.Environ Res2004,94:234-242.
34. Dominici F, Peng RD, Bell ML, Pham L, McDermontt A, Zeger SL, Samet JM: Fine particle air pollution and hospital admission for cardiovascular and respiratory diseases.JAMA2006,295(10):1127-1134.
35. Greenland S:Basic problems in interaction assessment.Environ Health perspect1993,101(supple):s59-s66.
36. Greenland S, Rothman KJ:Concept of interaction.Modern Epidemiologynd Philadelphia: Lippincott-Raven Publixhers, 2 1998, 329-342.
37. Ren C, Tong S:Health effects of air pollution - recent research development and contemporary methodology challenges.Environ Health 2008,7:56.
38. Blackwell SC, Thompson L, Refuerzo J:Full publication of clinical trials presented at a national maternal-fetal medicine meeting: is there a publication bias?.Am J Perinatol2009,26:679-682.
39. Crean S, Michels SL, Moschella K, Reynolds MW:Bovine thrombin safety reporting: an example of study design and publication bias.J Surg Res 2010,158:77-86.
40. Strahlman E, Rockhold E, Freeman A:Public Disclosure of clinical research. Lancet2009,373:1319-1320.
41. Turner EH, Matthews AM, Linardatos E, Tell RA, Rosenthel R:Selective publication of antidepressant trials and its influence on apparent efficacy.N Engl J Med2008,358:252-260.
42. Chapman S, Ragg M, McGeechan K:Citation bias in reported smoking prevalence in people with schizophrenia.Aust N Z J Psychiatry2009, 43:277-282.
43. Sarnat JA, Brown KW, Schwartz J, Coull BA, Koutrakis P:Ambient Gas Concentrations and Personal Particulate Matter Exposures: Implications for Studying the Health Effects of Particles.Epidemiology2005, 16:385-395.
doi:10.1186/1476-069X-9-3
Cite this article as:Renet al.:Modifiers of short-term effects of ozone on mortality in eastern Massachusetts - A case-crossover analysis at individual level.Environmental Health20109:3.
Submit your next manuscript to BioMed Central and take full advantage of:
• Convenient online submission
• Thorough peer review
• No space constraints or color figure charges
• Immediate publication on acceptance
• Inclusion in PubMed, CAS, Scopus and Google Scholar
• Research which is freely available for redistribution