R E S E A R C H A R T I C L E
Open Access
Gene-based analysis of ADHD using
PASCAL: a biological insight into the novel
associated genes
Aitana Alonso-Gonzalez
1, Manuel Calaza
1, Cristina Rodriguez-Fontenla
2*and Angel Carracedo
1,2*Abstract
Background:Attention-Deficit Hyperactivity Disorder (ADHD) is a complex neurodevelopmental disorder (NDD) which may significantly impact on the affected individual’s life.ADHDis acknowledged to have a highheritability component (70–80%). Recently, a meta-analysis of GWAS (Genome Wide Association Studies) has demonstrated the association of several independent loci. Our main aim here, is to apply PASCAL (pathway scoring algorithm), a new gene-based analysis (GBA) method, to the summary statistics obtained in this meta-analysis. PASCAL will take into account the linkage disequilibrium (LD) across genomic regions in a different way than the most commonly employed GBA methods (MAGMA or VEGAS (Versatile Gene-based Association Study)). In addition to PASCAL analysis a gene network and an enrichment analysis for KEGG and GO terms were carried out. Moreover, GENE2FUNC tool was employed to create gene expression heatmaps and to carry out a (DEG) (Differentially Expressed Gene) analysis using GTEX v7 and BrainSpan data.
Results:PASCAL results have revealed the association of new loci with ADHD and it has also highlighted other genes previously reported by MAGMA analysis. PASCAL was able to discover new associations at a gene level for ADHD:FEZF1 (p-value: 2.2 × 10⁻⁷) andFEZF1-AS1(p-value: 4.58 × 10⁻⁷). In addition, PASCAL has been able to highlight association of other genes that share the same LD block with some previously reported ADHD susceptibility genes. Gene network analysis has revealed several interactors with the associated ADHD genes and different GO and KEGG terms have been associated. In addition, GENE2FUNC has demonstrated the existence of several up and down regulated expression clusters when the associated genes and their interactors were considered.
Conclusions:PASCAL has been revealed as an efficient tool to extract additional information from previous GWAS using their summary statistics. This study has identified novel ADHD associated genes that were not previously reported when other GBA methods were employed. Moreover, a biological insight into the biological function of the ADHD associated genes across brain regions and neurodevelopmental stages is provided.
Keywords:ADHD (attention-deficit hyperactivity disorder), GBA (gene-based analysis), GWAS (genome wide association study), NDDs (neurodevelopmental disorders), PGC (Psychiatric Genomics Consortium), DEG (differentially expressed gene) analysis, Gene-network analysis, PASCAL (pathway scoring algorithm)
© The Author(s). 2019Open AccessThis article is distributed under the terms of the Creative Commons Attribution 4.0 International License (http://creativecommons.org/licenses/by/4.0/), which permits unrestricted use, distribution, and reproduction in any medium, provided you give appropriate credit to the original author(s) and the source, provide a link to the Creative Commons license, and indicate if changes were made. The Creative Commons Public Domain Dedication waiver (http://creativecommons.org/publicdomain/zero/1.0/) applies to the data made available in this article, unless otherwise stated. * Correspondence:[email protected];
2Grupo de Medicina Genómica, CIBERER, CIMUS (Centre for Research in Molecular Medicine and Chronic Diseases), Universidade de Santiago de Compostela, Santiago de Compostela, Spain
Background
Attention-deficit/Hyperactivity Disorder (ADHD) is a com-mon neurodevelopmental disorder (NDD) characterized by an ongoing pattern of inattention and/or hyperactivity that directly interferes with social functioning [1]. The worldwide estimated prevalence of ADHD is about 5% in children and adolescents and about 2.5% in adult population [2].
ADHD is a complex neurodevelopmental disorder, meaning that both environmental and genetic factors are involved in its etiology. However, the genetics basis of ADHD remains largely unknown due to its clinical hetero-geneity. Thus, ADHD presents comorbidity with other psychiatric and neurodevelopmental disorders such as schizophrenia, depression, bipolar disorder and autism spectrum disorder (ASD) [2]. The high heritability of ADHD (70–80%) was demonstrated by family and twin studies. Therefore, different genetic approaches were employed to search for ADHD susceptibility genes [3, 4]. Polygenic liability models has pointed towards a model in which both, single-nucleotide polymorphisms (SNPs) and rare copy number variants (CNVs) are involved in ADHD genetics For these reasons, it is considered that common variation. explains a substantial fraction of ADHD herit-ability [5–7]. However, early ADHD (GWAS) have failed to detect robust signals surpassing the established signifi-cance threshold (5 × 10⁻⁸). This could be possibly due to the lack of standardized phenotyping protocols and the need of a larger number of cases and controls that allow the detection of common variants with an small effect [8]. Although none of the findings from these early GWAS were genome-wide significant, some interesting loci were highlighted:CDH13, SLC9A9, NOS1andCNR1[9].
The latest GWAS meta-analyses conducted by the Psy-chiatric Genomic Consortium (PGC) have increased the sample size up to ten thousands of cases and controls after a rigorous phenotypic characterization. Thus, this study has identified 12 independent loci carrying 304 SNPs that sur-passes the required threshold for genome-wide significance. Some of the main associated SNPs are located within a large gene cluster located on chromosome 1 (ST3GAL3, KDM4A, KDM4A-AS1, PTPRF, SLC6A9, ARTN, DPH2, ATP6V0B, B4GALT2, CCDC24, IPO13), and SPAG16, FOXP2, PCDH7, SORCS3, DUSP5 SEMA6D[10].
Gene-based analysis (GBA) strategies are additional ana-lyses focused on the study of genes as testing units with a biological entity. GBA generally employs GWAS summary statistics without the need of individual genotypes. Thus, it takes into account all SNPs within a gene and the correla-tions among them to construct a statistic for each single gene [11]. The association results at a gene-level are useful to carry out secondary approaches and to characterize their biological functions [12]. GBA for ADHD has been already performed by MAGMA, one of the most commonly employed approaches together with VEGAS
(Versatile Gene-based Association Study) [13,14]. Several genes have shown significant association with ADHD after MAGMA analysis:ST3GAL3, KDM4A, PTPRF, SZT2, TIE 1, MPL, CDC20, HYI, SLC6A9, ELOVL1, CCDC24(chrom osome 1); MANBA(chromosome 4);MEF2C 5 (chromo-some 5); FOXP2 (chromosome 7); SORCS3, CUBN (chromosome 10); DUSP6 (chromosome 12); SEMA6D
(chromosome 15);CDH8(chromosome 16).
However, it was recently released a novel GBA strategy called PASCAL (Pathway Scoring Algorithm) PASCAL al-lows to generate gene scores by aggregating SNPp-values from GWAS meta-analysis while correcting for linkage disequilibrium (LD) structure. Moreover, PASCAL cor-rects for multiple testing while adjusting individual p -values depending on the correlation among SNPs. Thus, the construction of the correlation matrix is one of the main differences in comparison with other GBA methods as MAGMA. MAGMA also creates a SNP matrix based on principal components but it eliminates those SNPs that contribute with small eigen values [15].
Therefore, the main aim of this paper is to apply PAS-CAL to several public ADHD GWAS meta-analysis data (whole European, females and males). It is expected that PASCAL will help to identify new associations at a gene-level as well as to redefine those previously found by MAGMA. In addition, the list of ADHD associated genes will be studied through gene-network and func-tional annotation approaches in order to gain informa-tion about their potential biological role.
Results
Gene-based-analysis
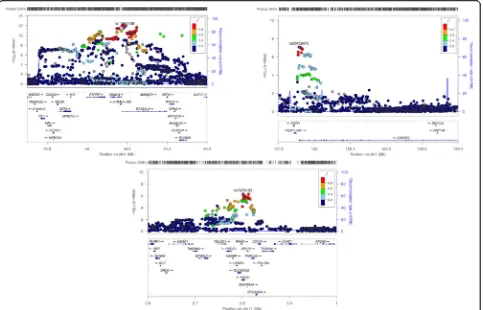
GBA of ADHD done with summary statistics from Euro-pean meta-analysis has revealed association of 19 loci sur-passing the required Bonferroni threshold (2.26 × 10⁻⁶). These loci are located on chromosomes 1, 7, 10, 11, 15 and 16. MED8, was highlighted as associated by PASCAL in comparison with results obtained by MAGMA (Table 1) (Fig.1). Moreover, other genes were associated in chromo-some 7 (FEZF1, FEZF1-AS1) and chromosome 11 (NS3BP, PDDC1).Regional plot around FEZF1has revealed an in-teresting and well-delimited genomic region located be-tween two linkage peaks and encompassing the 3’UTR of
CADPS2gene (Fig.1).
GBA of the female subgroup meta-analysis has also re-vealed interesting results. Therefore, 9 new loci located on chromosome 16 were associated:JMJD8, NARFL, WDR24, FBXL16, METRN, FAM173A, CCDC78, HAGHLandSTU B1(Table2) (Fig.2).
(Fig. 2). Moreover, ADHD GBA done in the male sub-group highlights different top associated genes (STZ2, ELOVL1, CDC20) in comparison with those found in the whole European population (KDM4A, KDM4A-AS1, ST3G AL3)(Tables1and3).
Gene network analysis
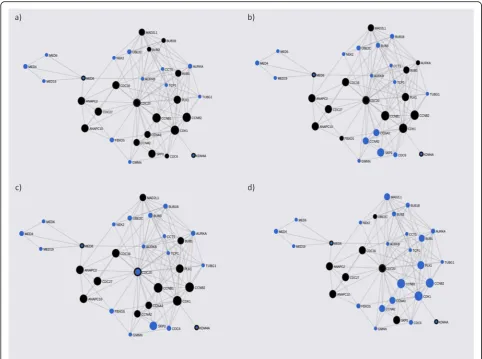
FunCoup has detected several interactors for the associ-ated loci (Additional file2: Table S2). Gene network for these genes was constructed including 16 query genes, 30 subnetwork genes and creating 124 links (Table 4). En-richment analysis of KEGG pathways has revealed associ-ation for cell cycle (q-value = 2.41 × 10⁻²⁰), oocyte meiosis (q-value = 1.08 × 10⁻¹³) and progesterone-mediated oocyte maturation (q-value = 1.4 × 10⁻¹³) among others (Fig. 3) (Additional file 3: Table S3). Top associated molecular GO terms were tranferase activity, enzyme and ribonucleotide binding (Additional file3: Table S3).
The gene-network constructed with genes from the female subgroup includes 37 genes (9 query genes plus 28 subnetwork genes) (Table 4). Enrichment analysis of KEGG and GO terms has revealed significant results for GAP junction (q-value = 2.65 × 10⁻⁵) and ribonucleotide binding (q-value = 2.03 × 10⁻⁹) among others (Fig. 4) (Additional file4: Table S4).
Functional annotation
-Gene expression heatmaps and differentially expressed gene analysis (DEG)
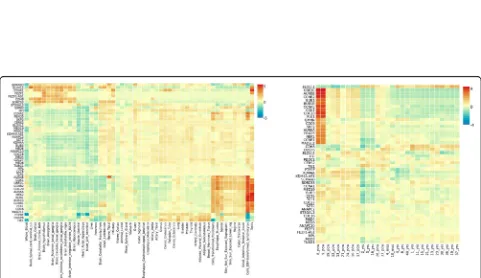
ADHD gene expression heatmap based on GTEX v7 RNA-seq data for 48 genes (18 PASCAL associated genes plus 30 interactor genes) has revealed higher relative expression levels across several brain tissues for the following genes:
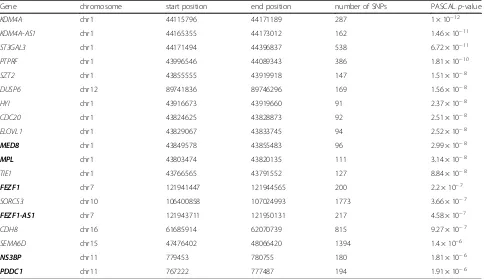
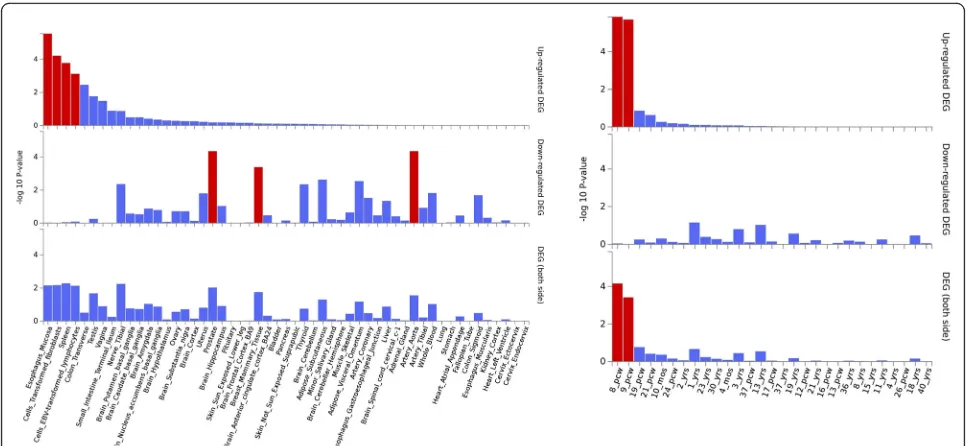
ELOVL2, CCNA1, FEZF1, FEZF1-AS1, CDH8andSORCS3. Conversely, the vast majority of the remaining genes, in-cluding those associated on chromosome 1, have shown relative lower expression levels in brain tissues from GTEX (Fig. 5). Expression heatmap based on BrainSpan data has not revealed any different expression between prenatal and postnatal stages for these genes. However, it is noticeable that a second cluster of genes demonstrated higher relative expression levels during early prenatal stages (8–9 postcon-ception weeks (pcw)) in comparison with postnatal stages (UBE2C, AURKB, CCN2B, BUB1, BUB1B, CCNA2, CDK1, CDC20, PLK1, GMNN, CDC6, SKP2, AURKA, FBX05, NEK2, CCNB1, MAD2L1)(Fig.5). Differentially Expressed Gene (DEG) analyses for ADHD data in several human tis-sues show significant up-regulation across esophagus, cell transformed fibroblasts, lymphocytes and spleen but not in any brain tissue. DEG graphs containing BrainSpan infor-mation have revealed significant upregulation during 8–9 pcw (early prenatal stages), which strongly correlates with Table 1Genes reported by PASCAL for ADHD that surpass the established Bonferroni threshold (p-value < 2.26 × 10⁻⁶). Columns shown gene, chromosome, start and end position for each gene, the number of SNPs included in the analysis for each gene and the correspondingp-value given by PASCAL
Gene chromosome start position end position number of SNPs PASCALp-value
KDM4A chr1 44115796 44171189 287 1 × 10⁻¹²
KDM4A-AS1 chr1 44165355 44173012 162 1.46 × 10⁻¹¹
ST3GAL3 chr1 44171494 44396837 538 6.72 × 10⁻¹¹
PTPRF chr1 43996546 44089343 386 1.81 × 10⁻¹⁰
SZT2 chr1 43855555 43919918 147 1.51 × 10⁻⁸
DUSP6 chr12 89741836 89746296 169 1.56 × 10⁻⁸
HYI chr1 43916673 43919660 91 2.37 × 10⁻⁸
CDC20 chr1 43824625 43828873 92 2.51 × 10⁻⁸
ELOVL1 chr1 43829067 43833745 94 2.52 × 10⁻⁸
MED8 chr1 43849578 43855483 96 2.99 × 10⁻⁸
MPL chr1 43803474 43820135 111 3.14 × 10⁻⁸
TIE1 chr1 43766565 43791552 127 8.84 × 10⁻⁸
FEZF1 chr7 121941447 121944565 200 2.2 × 10⁻⁷
SORCS3 chr10 106400858 107024993 1773 3.66 × 10⁻⁷
FEZF1-AS1 chr7 121943711 121950131 217 4.58 × 10⁻⁷
CDH8 chr16 61685914 62070739 815 9.27 × 10⁻⁷
SEMA6D chr15 47476402 48066420 1394 1.4 × 10⁻⁶
NS3BP chr11 779453 780755 180 1.81 × 10⁻⁶
PDDC1 chr11 767222 777487 194 1.91 × 10⁻⁶
the gene expression heatmap for the second cluster of genes (Fig.6).
ADHD expression heatmap for the female subgroup (9 query genes plus 28 interactor genes) has outlined
FBXL16 as the top up-regulated gene when relative ex-pression levels were analyzed across the brain tissues in-cluded in GTEX but also in testis. Moreover, a second
gene cluster including METRN, CCDC78 and HAGHL
has also shown higher relative expression levels across the same tissues that FBXL16. BrainSpan heatmap has demonstrated that FBXL16 is downregulated during early and mid-prenatal stages (8,9,12,13 pcw) starting to progressively increase its expression from this stage on-wards. METRN and HAGHL have also shown a similar
Fig. 1Regional association plots for ADHD GWAS meta-analysis (chromosomes 1, 7 and 11). PASCAL has revealed novel associations at a gene level forMED8(chr1),FEZF1andFEZF1-AS1(chr 7) andNS3BPandPDDC1(chr11). Regional plot for chromosome 1 has been constructed with rs11810109 as index SNP (r2= 0.99 with the lead SNP, rs11420276) due to the lack of LD data for this marker
Table 2Genes reported by PASCAL for ADHD females that surpass the established Bonferroni threshold (p-value < 2.26 × 10⁻⁶). Columns shown gene, chromosome, start and end position for each gene, the number of SNPs included in the analysis for each gene and the correspondingp-value given by PASCAL
Gene chromosome start position end position number of SNPs PASCALp-value
JMJD8 chr16 731666 734439 23 9.18 × 10⁻⁷
NARFL chr16 779768 790997 21 1.12 × 10⁻⁶
WDR24 chr16 734701 740400 17 1.26 × 10⁻⁶
FBXL16 chr16 742499 755825 21 1.32 × 10⁻⁶
METRN chr16 765172 767480 22 1.39 × 10⁻⁶
FAM173A chr16 771141 772590 22 1.39 × 10⁻⁶
CCDC78 chr16 772581 776880 22 1.39 × 10⁻⁶
HAGHL chr16 776957 779715 22 1.39 × 10⁻⁶
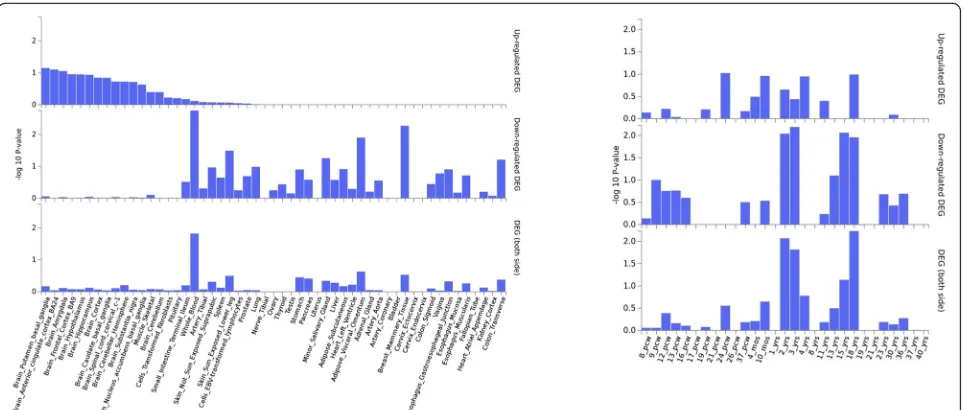
trend (Fig. 7). Moreover, another cluster of genes that have shown high relative expression levels during pre-natal stages (UBE2D1, CCT2, CCT5, CCT8, PA2G4)but it also has exhibited the opposite trend during the first stages of development followed by a variable expression pattern. However, DEG analyses have not shown any sig-nificant result (Fig.8).
Discussion
PASCAL algorithm has revealed novel ADHD associated genes ADHD in comparison with those genes previously reported by MAGMA [10]. The fact that both GBA methods employ similar but slightly different statistical approaches, might explain the differences found between the results reported by both methods. Thus, the vast majority of genes shared between both studies are lo-cated near to genome-wide significant index variants identified by Demontis et al. (cluster of genes within chromosome 1).
However PASCAL has been able to unveil new associ-ated genes that do not physically overlap with individual genome wide significant SNPs. This is the case of the re-gion located on chromosome 7 that encompass FEZF1,
FEZF1-AS1 and part of CADPS2 including its 3’UTR. The top SNP, rs2845270, is located between the 3’UTR
ofCADPS2 and just before the TSS (transcription start-ing site) ofFEZF1. It should be noted that rs2845270 did not reach the required GWAS significance level (p-value < 5 × 10⁻⁸). However, PASCAL algorithm was able to rescueFEZF1 and FEZF1-AS1 as associated genes when thep-values of neighbor SNPs were considered (all SNPs included between both recombination peaks). It is worth noting that the enrichment analysis has not detected any interactor for FEZF1. In addition, FEZF1-AS1, which encodes a lncRNA, was not recognized by FunCoup. This implies a limitation when it comes to describe the biological processes that could be underlying ADHD eti-ology in relation with this gene. Moreover, expression heatmaps have not revealed differences whenFEZF1and
Fig. 2Regional association plots for ADHD GWAS meta-analysis; females (chromosome 16) and males (chromosome 1). Both regions contain PASCAL associated genes
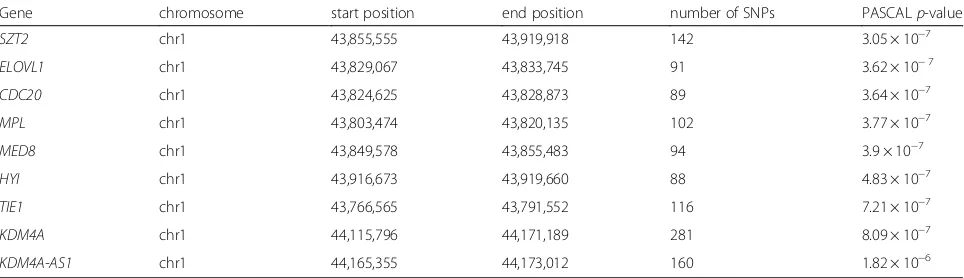
Table 3Genes reported by PASCAL for ADHD males that surpass the established Bonferroni threshold (p-value < 2.26 × 10⁻⁶). Columns shown gene, chromosome, start and end position for each gene,the number of SNPs included in the analysis for each gene and the correspondingpvalue given by PASCAL
Gene chromosome start position end position number of SNPs PASCALp-value
SZT2 chr1 43,855,555 43,919,918 142 3.05 × 10⁻⁷
ELOVL1 chr1 43,829,067 43,833,745 91 3.62 × 10⁻⁷
CDC20 chr1 43,824,625 43,828,873 89 3.64 × 10⁻⁷
MPL chr1 43,803,474 43,820,135 102 3.77 × 10⁻⁷
MED8 chr1 43,849,578 43,855,483 94 3.9 × 10⁻⁷
HYI chr1 43,916,673 43,919,660 88 4.83 × 10⁻⁷
TIE1 chr1 43,766,565 43,791,552 116 7.21 × 10⁻⁷
KDM4A chr1 44,115,796 44,171,189 281 8.09 × 10⁻⁷
FEZF1-AS1 expression patterns were analyzed across pre- and post-natal developmental stages. However, GTEX expression analyses have identified two ADHD expression clusters (one downregulated and another one upregulated). Thus, FEZF1 and FEZF1-AS1have shown a high relative expression in brain together with other ADHD associated genes and their interactors (ELOVL2, CCNA1,CHD8 and SORCS3). It should be noted that previous genetic and functional studies have linked this
genomic region to other neurodevelopmental phenotypes. Therefore,FEZF1was identified as a strong candidate gene for ASD in a family sequencing study and the region spans the autism susceptibly locus 1 (AUTS1) [16,17]. Moreover,
FEZF1expression was mainly found in the forebrain region during early embriogenesis.FEZF1andFEZF2are both re-lated with the differentiation of neuron stem cells and a proper cortical development [18–20]. In addition it was proved that the downregulation of lncRNA FEZF1-AS1,
suppresses the activation of the Wnt/β-catenin signaling pathway in tumor progression. Although its functional role in neurons has not been proved to date, genes within this canonical pathway has been repeatedly linked to ASD and ADHD phenotypes [21, 22]. Moreover, CADPS2plays an important function on the synaptic circuits throughout the activity-dependent release of neurotrophic factor (BDNF). Indeed, genetic variants in CADPS2gene were associated to ASD andCADPS2KO mice have shown impairments in behavioral phenotypes [23–26].
In addition, two novel loci were associated with ADHD,
NS3BPandPDDC1,both located on chromosome 11. Pre-vious GBA carried out by MAGMA has revealed associ-ation of a nearby locus,PIDD1,but the proxy SNP was not identified since the required GWAS significance level (p< 5 × 10⁻⁸) was not surpassed [10]. However, PASCAL was able to identify as associated both genes located on the same genetic region around the top SNP (rs28633403). FunCoup was unable to recognizeNS3BPwhich belongs to an uncharacterizedLOC171391gene which entails a limita-tion in the enrichment analysis. Moreover, no gene inter-action was reported for PDDC1. Thus, it should be noted that it has not been possible to directly relatePDDC1 (glu-tamine amidotransferase like class 1 domain containing 1) andNS3BP (pseudogene) with any biological term. More-over, there is a lack of previous studies reporting their bio-logical function. However, PDDC1 is located within the brain-downregulated cluster together with other ADHD as-sociated genes and their interactors (KDM4A, KDM4A-AS1, CDC20, AURKA, NEK2, BUB1 and BUB1B among others). Curiously, some of the genes that have shown downregulation across GTEX adult brain were upregulated during early neurodevelopmental stages (8–9 pcw) and they have shown a high relative expression in testis. Precisely, most of those genes overexpressed in testis are interactor partners of CDC20. CDC20 together with KDM4A and
KDM4A-AS1 has shown enrichment in KEGG and GO terms related with cell cycle as well as with positive and negative regulation of cellular processes. Specifically,
CDC20has been previously reported as a coactivator of the ubiquitin ligase anaphase-promoting complex (APC). The APC-CDC20 complex has essential functions in regulating mitosis but it has also been described nonmitotic functions in neurons. Thus, APC-CDC20 complex plays a role in dendrite morphogenesis during brain development [27]. Table 4Funcoup interactors detected using PASCAL associated
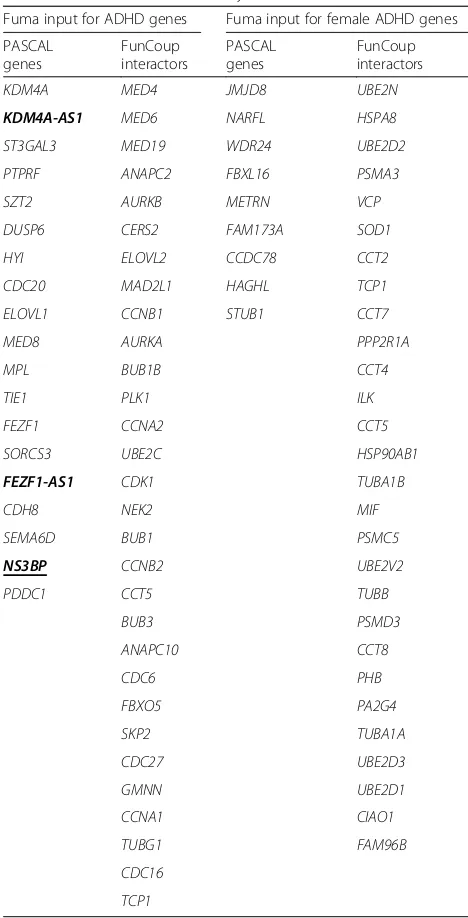
genes as input. Some of the PASCAL genes were no detected by Funcoup, mostly antisense RNA genes (bold font). Moreover, some of the associated PASCAL genes were not detected by FUMA (underlined genes). Those genes marked in bold and underlined were not detected by both tools
Fuma input for ADHD genes Fuma input for female ADHD genes
PASCAL genes FunCoup interactors PASCAL genes FunCoup interactors
KDM4A MED4 JMJD8 UBE2N
KDM4A-AS1 MED6 NARFL HSPA8
ST3GAL3 MED19 WDR24 UBE2D2
PTPRF ANAPC2 FBXL16 PSMA3
SZT2 AURKB METRN VCP
DUSP6 CERS2 FAM173A SOD1
HYI ELOVL2 CCDC78 CCT2
CDC20 MAD2L1 HAGHL TCP1
ELOVL1 CCNB1 STUB1 CCT7
MED8 AURKA PPP2R1A
MPL BUB1B CCT4
TIE1 PLK1 ILK
FEZF1 CCNA2 CCT5
SORCS3 UBE2C HSP90AB1
FEZF1-AS1 CDK1 TUBA1B
CDH8 NEK2 MIF
SEMA6D BUB1 PSMC5
NS3BP CCNB2 UBE2V2
PDDC1 CCT5 TUBB
Novel associated genes were reported in both males and females when PASCAL analysis was carried out. Until now, no GBA has been done with this data. However, a genetic investigation of sex bias in ADHD including this GWAS meta-analyses has revealed different single SNPs associated for male and female meta-analyses [28]. Thus, PASCAL has revealed the association of 9 genes located on chromosome 16. The lead SNP of the region (rs4984677) lies withinFBXL16and it has been pointed as one of the top SNPs associated (p-value:1.9 × 10⁻⁷) for fe-males in the sex-specific meta-analysis [28]. However, it should be noted that the number of SNPs covering these genes is relatively lower in comparison with other associ-ated genes. Moreover, it is also necessary to highlight that the female cohort only includes 4945 cases versus 14,154 cases included in the male cohort. Therefore, these associ-ations should be carefully considered.
Network analysis for the whole GBA, has detected 9 asso-ciated genes but it was only able to identify interactors for
three genes:NARFL, HAGHLand STUB. In addition, en-richment analyses seem to point to different biological pro-cesses from those previously reported for the whole ADHD analysis. Gene expression heatmap (GTEx data) has shown a higher expression in brain forFBXL16, MTRN, CCDC78
and HAGHL compared to other tissue types. It is worth noting that the expression ofFBXL16, HAGHLandMTRN
cluster together across different neurodevelopmental stages (prenatal and postnatal). The function of these genes during neurodevelopment is unknown except in the case of
MTRN. MTRN encodes for a neurotrophic factor that plays important roles both in the glial cell differentiation and the formation of axonal networks [29].
The genetic and functional annotation results seem to point to a differential role of the associated genes in males versus females. Genetic differences between genders in ADHD etiology could explain the sex bias reported in the prevalence for this NDD. Thus, males have shown a rate of ADHD diagnosis seven times higher than females [30].
Fig. 4ADHD female gene-networks constructed with PASCAL associated genes and its FunCoup interactors. Mainquery and interactor partners which form each network are represented. as blue circles. Query genes are also circled by black lines. Node sizes scale to emphasize gene importance in the whole network while participating nodes for each KEGG pathway are marked in black:aGAP junction;bProtein processing in endoplasmic reticulum:cUbiquitin mediated proteolysis;dPhagosome
However, the study conducted by the PGC did not found any evidence that point towards the explanation of this sex bias by the association of common variants [28]. Further re-search will be needed to clarify this question. Probably, to gather a much larger sample size for males and females GWAS would be helpful for future studies.
In conclusion, PASCAL algorithm was used to carry out a novel ADHD GBA, employing summary statistics from the latest PGC meta-analysis. This has helped to identify novel gene associations for ADHD different from those re-ported by MAGMA. Thus, our results prove that both tools might be used as complementary GBA approaches to highlight genes associated to this disorder.
Although PASCAL has solved many limitations found in other GBA as the algorithmic efficiency and the optimization of the correlation matrix, novel improve-ments could be added to the method. Thus, the incorp-oration of functional annotation data, eQTLs or methylation status for each SNP could help to prioritize and report different associated genes.
Moreover, gene-network and functional annotation approaches including gene expression heatmaps and DEG have helped to understand these genetic findings in a biological context. This is extremely useful to select the most suitable candidates genes for future functional studies.
Fig. 6ADHD DEG plots constructed with GTEX v7 (53 tissues) (left) and BrainSpan 29 different ages of brain samples RNA seq data (right). Significantly enriched DEG sets (Pbon < 0.05) are highlighted in red
Methods
GWAS meta-analysis (ADHD) GWAS summary statistics from the latest ADHD GWAS meta-analysis were obtained from the public repository available in the PGC website (https://www.med.unc.edu/pgc/results-and-downloads/). The PGC’s policy (https://www.med.unc.edu/pgc) is to make genome-wide summary results public. Summary statistics from the following files were employed as input for our ana-lysis: (adhd_eur_jun2017.gz, META_PGC_iPSYCH_males.gz, and META_PGC_iPSYCH_females.gz). These ADHD GWAS meta-analysis (full European ADHD GWAS and separated by sex) were also retrieved from the PGC and iPSYCH analysis released in June 2017 (hg19).
In the case of the ADHD male data set, 14,154 cases and 17,948 controls were considered. However, ADHD female dataset only include 4945 cases and 16,246 con-trols. Additional data about each individual GWAS in-cluded in each meta-analysis data set including sample size, ancestry and which diagnostic instrument was employed can be found in Additional file 1: Table S1. Additional information about the genotyping and QC (quality control) methods and the summary statistics employed can be found at PGC website (http://www. med.unc.edu/pgc/results-and-downloads).
Gene-based analysis (GBA)
GBA was carried out using PASCAL (https://www2.unil. ch/cbg/index.php?title=Pascal). It has employed as an in-put the summary statistics obtained from the ADHD meta-analysis. Individual SNPs from GWAS results were first mapped to genes employing a default ±50 kb win-dow around the start and gene end. The default max-imum number of SNPs per gene allowed by PASCAL
was 3000. Moreover, LD information from 1000 Genomes was employed by PASCAL in order to consider linkage between markers for each gene. The Bonferroni correction sets the significance cut-off at 2.26 × 10⁻⁶(0.05 / 22,135 genes). This number of genes includes the whole UCSC list (hg19) employed by PASCAL to perform calculations. However, for each ADHD data set the number of genes considered in each individual analysis is slightly lower. However, it was preferred to consider the most conserva-tive threshold. The whole list of gene scores calculated by PASCAL for each ADHD data set can be consulted in the electronic (Additional files5,6,7).
Regional plots
LocusZoom tool (http://locuszoom.org/) was employed to construct regional plots for those genetic regions con-taining PASCAL associated genes. To this aim, meta-analysis data including marker name, p-values, OR, chromosome position (start-end) and index SNP, were specified for each one of the corresponding studies (ADHD whole, ADHD females and males). The source of LD information used to construct the r2 correlation between SNPs in these regional plots was retrieved from hg19/1000 Genomes Nov 2014 EUR (Europe). The rest of optional controls were used as default.
Gene-network analysis
FunCoup v.4.0 (http://funcoup.sbc.su.se/search/) was employed to expand the associated list of genes (p< 2.26 × 10⁻⁶) previously obtained and to include its interactors. This database integrates 10 different types of functional couplings among genes that allow to infer functional associ-ation networks: Protein interaction (PIN), Mrna
expression (MEX), Protein Co-expression (PEX), Genetic Interaction profile similarity (GIN), Shared Transcription factor binding (TFB), Co-miRNA regulation by shared miRNA targeting (MIR), Subcelular Co-localization (SCL), Domain interactions (DOM), Phylogenetic profile simarity (PHP) and Quantitative mass spectrometry (QMS). Gene networks for the ADHD whole analysis were constructed considering as input 16 of the 19 associated genes because 3 of them were not recognized by the tool (Table4). Gene networks were constructed considering three different pa-rameters. Therefore, expansion parameters include: confi-dence threshold (0.8), a maximum number of 30 nodes per expansion step and a query depth of 1 (only genes directly linked to the query genes are shown). Network expansion algorithm was settled in order to obtain those strongest interactors for any query gene, without prioritizing com-mon neighbor’s links. Moreover, enriched term analysis (KEGG and GO molecular function) were considered for each gene-network constructed with the correspondingp -values. Gene-network representation displays the most significant KEGG pathways according to their q-values after considering an FDR approach. Node sizes scale to emphasize gene importance in the whole network while participating nodes for each KEGG pathway are marked in black.
Functional annotation
GENE2FUNC, a core process of FUMA (Functional Mapping and Annotation of Genome-Wide Association Studies) (http://fuma.ctglab.nl/), was employed to func-tional annotate associated genes and its interactors. In the case of ADHD, a set of 48 genes was used as input (18 PASCAL associated genes plus 30 strong interactors from FunCoup). Moreover, for the female’s subset, a list of 37 genes was employed (9 PASCAL associated genes plus 28 FunCoup interactors) (Table4).
Different analyses performed by GENE2FUNC were employed, including a gene expression heatmap and en-richment of differentially expressed genes (DEG). Gene ex-pression heatmap was constructed employing GTEx v7 (53 tissue types) and BrainSpan RNA-seq data. The average of normalized expression per label (zero means across sam-ples) was displayed on the corresponding heatmaps. Ex-pression values are TPM (Transcripts Per Million) for GTEx v7 and RPKM (Read Per Kilobase per Million) in the case of BrainSpan data set. Heatmaps display normalized expression value (zero mean normalization of log2 trans-formed expression) and darker red means higher relative expression of that gene in each label, compared to a darker blue color in the same label. DEG analysis was carried out creating differentially expressed genes for each expression data set. In order to define DEG sets, two-sided Student’s t-test were performed per gene per tissue against the remaining labels (tissue types or developmental stages).
Those genes with ap-value < 0.05 after Bonferroni correc-tion and a log fold change≥0.58 are defined as DEG. The direction of expression was considered. The -log10 (p -value) refers to the probability of the hypergeometric test.
Supplementary information
Supplementary informationaccompanies this paper athttps://doi.org/10. 1186/s12920-019-0593-5.
Additional file 1: Table S1.Characterization of ADHD cohorts included in the PGC GWAS metanalyses.
Additional file 2: Table S2.Query genes and interactors detected by Funcoup for the loci associated for PASCAL GBA in the global analysis and female analysis.
Additional file 3: Table S3.Enriched terms for query ADHD genes and its interactors (subnetwork genes) according to Funcoup.
Additional file 4: Table S4.Enriched terms for query genes in the ADHD females subgroup and its interactors (subnetwork genes) according to Funcoup.
Additional file 5.adhd_eur_jun2017.genebased.sum.genescores.xls.
Additional file 6.GWASPGCfemalesadhdpvalor.sum.genescores.xls.
Additional file 7.GWASPGCmalesadhdpvalor.sum.genescores.xls. For each file different columns are represented: chromosome, start-end posi-tions, strand (+ or -) relative to transcription start, gene symbol (UCSC), numSNPs (number of SNPs employed to calculate the gene score),p -value calculated by PASCAL.
Abbreviations
DEG:Differentially Expressed Gene; ADHD: Attention Deficit Hyperactiviy Disorder; ASD: Autism Spectrum Disorder; BDNF: Neurotrophic factor; CNV: Copy number variation; DOM: Domain interactions; FDR: False discovery rate; FUMA: Functional Mapping and Annotation of Genome-Wide Associ-ation Studies; GBA: Gene-based analysis; GIN: Genetic Interaction profile similarity; GO: Gene ontology; GTEx: Genotype-tissue expression; GWAS: Genome-Wide Association Study; IPSYCH: Lundbeck Foundation Initiative for Integrative Psychiatric Research; KEGG: Kyoto Encyclopedia of Genes and Genomes; LD: Linkage disequilibrium; MEX: mRNA co-expression; MIR: Co-miRNA regulation by shared miRNA targeting;
NDD: Neurodevelopmental disorder; OR: Odds ratio; PASCAL: Pathway Scoring Algorithm; PEX: Protein Co-expression; PGC: Psychiatric genomic consortium; PHP: Phylogenetic profile similarity; PIN: Protein interaction; QC: Quality control; QMS: Quantitative mass spectrometry; RPKM: Read per kilobase per million; SCL: Subcelular Co-localization; SNP: Single nucleotide polymorphism; TFB: Shared Transcription factor binding; TPM: Transcripts per million; TSS: Transcription starting site; VEGAS: Versatile gene-based associ-ation study
Acknowledgements Not applicable.
Authors’contributions
AA-G, CR-F and MC have performed the analyses. AA-G wrote the paper. AC and CR-F critically revised the work and approved the final content. AA-G, CR-F, MC and AC participated in the design and coordination of this study. All authors have read and approved the manuscript.
Funding
AA-G was supported by Fundación María José Jove. CR-F was supported by a contract from the ISCIII and FEDER. The funding bodies has no role in the design of the study and collection, analysis, and interpretation of data nor in writing the manuscript.
Availability of data and materials
Ethics approval and consent to participate
The GWAS data employed in this study are publicly available at:https:// www.med.unc.edu/pgc. These genetic data have been employed in published studies and have been approved by the corresponding ethics commitees.
Consent for publication Not applicable.
Competing interests
The authors declare that the research was conducted in the absence of any commercial or financial relationships that could be construed as a potential conflict of interest.
Received: 13 May 2019 Accepted: 24 September 2019
References
1. American Psychiatric Association. Diagnostic and Statistical Manual of Mental Disorders. Arlington: American Psychiatric Publishing; 2013. 2. Faraone SV, Asherson P, Banaschewski T, Biederman J, Buitelaar JK,
Ramos-Quiroga JA, et al. Attention-deficit/hyperactivity disorder. Nat Rev Dis Prim. 2015;1:15020.https://doi.org/10.1038/nrdp.2015.20.
3. Voeller KKS. Attention-deficit hyperactivity disorder (ADHD). J Child Neurol. 2004;19:798–814.
4. Gizer IR, Ficks C, Waldman ID. Candidate gene studies of ADHD: A meta-analytic review. Hum Genet. 2009;126:51–90.
5. Genomics C-DG of the PC, Lee SH, Ripke S, Neale BM, Faraone SV, Purcell SM, et al. Genetic relationship between five psychiatric disorders estimated from genome-wide SNPs. Nat Genet. 2013;45:984.https://doi.org/10.1038/ ng.2711.
6. Anttila V, Bulik-Sullivan B, Finucane HK, Walters RK, Bras J, Duncan L, et al. Analysis of shared heritability in common disorders of the brain. Science. 2018;360(6395). Available from:https://doi.org/10.1126/science.aap8757. 7. Smoller JW, Craddock N, Kendler K, Lee PH, Neale BM, Group C, et al.
Identification of risk loci with shared effects on five major psychiatric disorders: a genome-wide analysis. Lancet. 2013;381(9875):1371–9 Available from:http://linkinghub.elsevier.com/retrieve/pii/S0140673612621291. 8. Neale BM, Ph D, Medland S, Ripke S, Anney RJL, Asherson P, et al.
Association Study of Attention- Deficit / Hyperactivity Disorder. Jaac. 2010; 49:906–20.https://doi.org/10.1016/j.jaac.2010.06.007.
9. Franke B, Neale BM, Faraone SV. Genome-wide association studies in ADHD. Hum Genet. 2009;126(1):13–50.
10. Demontis D, Walters RK, Martin J, Mattheisen M, Als TD, Agerbo E, et al. Discovery of the first genome-wide significant risk loci for attention deficit/ hyperactivity disorder. Nat Genet. 2019;51(1):63–75.https://doi.org/10.1038/ s41588-018-0269-7.
11. Huang H, Chanda P, Alonso A, Bader JS, Arking DE. Gene-Based tests of association. PLoS Genet. 2011;7(7).https://doi.org/10.1371/journal.pgen. 1002177.
12. Wang K, Li M, Bucan M. Pathway-based approaches for analysis of genomewide association studies. Am J Hum Genet. 2007;81:1278–83 Available from: http://www.ncbi.nlm.nih.gov/pubmed/17966091%5Cnhttp:// www.pubmedcentral.nih.gov/articlerender.fcgi?artid=
PMC2276352%5Cnhttp://www.pubmedcentral.nih.gov/articlerender. fcgi?artid=2276352&tool=pmcentrez&rendertype=abstract.
13. de Leeuw CA, Mooij JM, Heskes T, Posthuma D. MAGMA: Generalized Gene-Set Analysis of GWAS Data. PLoS Comput Biol. 2015;11(4):e1004219.https:// doi.org/10.1371/journal.pcbi.1004219.
14. Liu JZ, McRae AF, Nyholt DR, Medland SE, Wray NR, Brown KM, et al. A versatile gene-based test for genome-wide association studies. Am J Hum Genet. 2010;87:139–45.
15. Lamparter D, Marbach D, Rueedi R, Kutalik Z, Bergmann S. Fast and Rigorous Computation of Gene and Pathway Scores from SNP-Based Summary Statistics. PLoS Comput Biol. 2016;12(1):e1004714.https://doi.org/ 10.1371/journal.pcbi.1004714.
16. International Molecular Genetic Study of Autism C. Further characterization of the autism susceptibility locus AUTS1 on chromosome 7q. Hum Mol Genet. 2001;10(9):973–82 Available from:http://www.ncbi.nlm.nih.gov/ pubmed/11392322.
17. Chapman NH, Nato AQ, Bernier R, Ankenman K, Sohi H, Munson J, et al. Whole exome sequencing in extended families with autism spectrum disorder implicates four candidate genes. Hum Genet. 2015;134(10):1055–68. 18. Hirata T, Suda Y, Nakao K, Narimatsu M, Hirano T, Hibi M. Zinc finger gene
fez-like functions in the formation of subplate neurons and thalamocortical axons. Dev Dyn. 2004;230:546–56.
19. Hirata T. Zinc-finger gene fez in the olfactory sensory neurons regulates development of the olfactory bulb non-cell-autonomously. Development. 2006;133(8):1433–43 Available from:http://dev.biologists.org/cgi/doi/1 0.1242/dev.02329.
20. Shimizu T, Nakazawa M, Kani S, Bae YK, Shimizu T, Kageyama R, et al. Zinc finger genes Fezf1 and Fezf2 control neuronal differentiation by repressing Hes5 expression in the forebrain. Development. 2010;137(11):1875–85 Available from:http://dev.biologists.org/cgi/doi/10.1242/dev.047167. 21. Eaton JD, Davidson L, Bauer DLV, Natsume T, Kanemaki MT, West S. Xrn2
accelerates termination by RNA polymerase II, which is underpinned by CPSF73 activity. Genes Dev. 2018;32(2):127–39.
22. Kalkman HO. A review of the evidence for the canonical Wnt pathway in autism spectrum disorders. Mol Autism. 2012;3(1). Article number: 10. 23. Bonora E, Graziano C, Minopoli F, Bacchelli E, Magini P, Diquigiovanni C,
et al. Maternally inherited genetic variants of CADPS2 are present in autism spectrum disorders and intellectual disability patients. EMBO Mol Med. 2014; 6(6):795–809 Available from:http://www.ncbi.nlm.nih.gov/pubmed/2473786 9.
24. Sadakata T. The secretory granule-associated protein CAPS2 regulates Neurotrophin release and cell survival. J Neurosci. 2004;24(1):43–52 Available from:http://www.jneurosci.org/cgi/doi/10.1523/JNEUROSCI.2528-03.2004. 25. Sadakata T, Washida M, Iwayama Y, Shoji S, Sato Y, Ohkura T, et al.
Autistic-like phenotypes in Cadps2-knockout mice and aberrant CADPS2 splicing in autistic patients. J Clin Invest. 2007;117(4):931–43.
26. Sadakata T, Shinoda Y, Sato A, Iguchi H, Ishii C, Matsuo M, et al. Mouse models of mutations and variations in autism spectrum disorder-associated genes: Mice expressing Caps2/Cadps2 copy number and alternative splicing variants. Int J Environ Res Public Health. 2013;10:6335–53.
27. Peters JM. The anaphase promoting complex/cyclosome: A machine designed to destroy. Nat Rev Mol Cell Biol. 2006;7:644–56.
28. Martin J, Walters RK, Demontis D, Mattheisen M, Lee SH, Robinson E, et al. A Genetic Investigation of Sex Bias in the Prevalence of Attention-Deficit/ Hyperactivity Disorder. Biol Psychiatry. 2018;83(12):1044–53.https://doi.org/ 10.1016/j.biopsych.2017.11.026.
29. Nishino J, Yamashita K, Hashiguchi H, Fujii H, Shimazaki T, Hamada H. Meteorin: a secreted protein that regulates glial cell differentiation and promotes axonal extension. EMBO J. 2004;23(9):1998–2008.
30. Polanczyk G, De Lima MS, Horta BL, Biederman J, Rohde LA. The worldwide prevalence of ADHD: a systematic review and metaregression analysis. Am J Psychiatry. 2007;164(6):942–8.
Publisher’s Note