Environmental Resources Research Vol. 2, No. 2, 2014
GUASNR
Planning for Protected Areas using Spatial and Temporal Metrics
Seyedhamed Mirkarimi1, Colin Arrowsmith2
1
Department of Fisheries and Environmental Sciences, Gorgan University of Agricultural Sciences and Natural Resources, Gorgan, Iran.,
2School of Math & Geospatial Sciences,RMIT University, Melbourne, Australia.
Received: September 2013 Accepted: December 2013
Abstract
The natural characteristics of protected areas change for a variety of reasons. These changes can be studied both spatially and temporally. Spatially, protected area landscape structures such as shape, size and location with respect to their neighbourhood context can be studied to describe landscape configuration. Temporally, landscape functions such as different geographical locations and land characteristics can be studied to determine the rate of temporal changes in landscape. This paper will introduce a developed framework to enhance the landscape ecological planning approach with attention to changes in landscapes of protected areas. Considering landscape ecological concepts, this framework draws upon spatial and temporal characteristics of protected areas. In order to examine the model in the real world, the data requirements for landscape ecological planning including a number of spatial and temporal metrics were implemented using a case study method. The case study approach proved that spatial and temporal metrics can be used in the interpretation of spatial configuration and temporal variability of protected areas. A list of spatial and temporal criteria was developed to assist interpretation of area compaction, spatial fragmentation and temporal variability of protected areas. Using the criteria list, a new framework for spatial and temporal evaluation of protected areas has been developed. The results were used to determine spatial and temporal management issues of the case areas at the landscape scale. Then planning scenarios for spatial and temporal issues of the protected areas were suggested.
Keywords:National park; protected area; protected area management;
protected area planning; spatial and temporal metrics; landscape ecological
planning1
1. Introduction
Ecological contemporary planning approaches borrow their fundamental concepts and techniques from landscape suitability (Ndubisi, 2002). Landscape suitability considers past, present and some prediction of the future of the environmental characteristics of the areas under study. These can include some data and information about spatial and temporal characteristics of protected area landscapes such as size, shape, temperature and visitation patterns (Miller, 1978; FAO, 1988; McHarg, 1997; Thomas and Middleton, 2003).
This paper will start with an introduction to contemporary planning approaches for protected areas. It includes data requirements and the process of planning for contemporary planning approaches for protected areas. Then, the importance of spatial and temporal characteristics of protected areas will be highlighted. This will lead to a list of important spatial and temporal characteristics of protected areas. In a case study method, the consideration of the spatial and temporal characteristics in the process of planning for protected area will be showed.
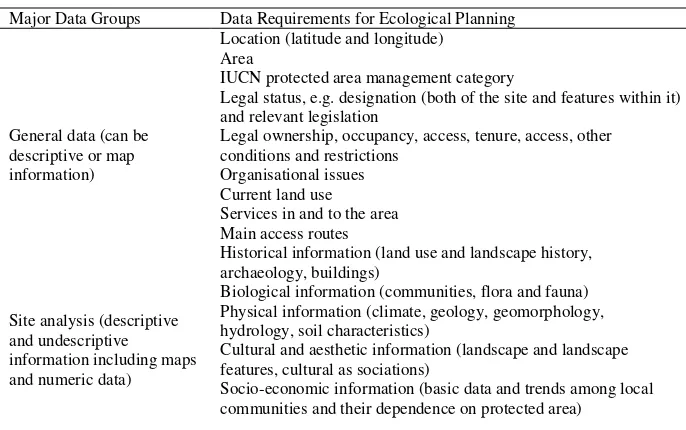
An Introduction to Contemporary Planning Approaches for Protected Areas There are many references on planning for protected areas such as FAO (1988); Forster (1973) and Thomas and Middleton (2003). According to the references, types of data required for any protected area planning varies from protected area to protected area and depend on the characteristics of the area itself (McHarg, 1997; Thomas & Middleton, 2003). Table 1 shows data requirements for ecological planning for protected areas derived from the literature (Miller, 1978; FAO, 1988; McHarg, 1997; Thomas and Middleton, 2003). It will be argued in this paper that with more attention to the spatial and temporal characteristics of protected areas in their neighbourhood context, a different list of data requirements based on ecological planning approach can be developed.
Spatial Characteristics
Spatial characteristics of area and landscape elements, comprising size and shape of individual protected areas and their location relative to neighbourhood land uses are spatial planning issues that affect subsequent management at the landscape level (Hocking et al., 2000).
Size of protected areas
The size of the protected area should reflect the extent of land or water to accomplish the objectives of management (IUCN, 1994). Many authors wrote about the importance of the size of protected areas such as Hocking et al. (2000), Vreugdenhil et al. (2002) and Forman & Godron (1986).
Table1. Data requirements for ecological planning to protected areas according to the contemporary planning approaches for protected areas
Major Data Groups Data Requirements for Ecological Planning
General data (can be descriptive or map information)
Location (latitude and longitude) Area
IUCN protected area management category
Legal status, e.g. designation (both of the site and features within it) and relevant legislation
Legal ownership, occupancy, access, tenure, access, other conditions and restrictions
Organisational issues Current land use Services in and to the area Main access routes
Historical information (land use and landscape history, archaeology, buildings)
Site analysis (descriptive and undescriptive
information including maps and numeric data)
Biological information (communities, flora and fauna) Physical information (climate, geology, geomorphology, hydrology, soil characteristics)
Cultural and aesthetic information (landscape and landscape features, cultural as sociations)
Socio-economic information (basic data and trends among local communities and their dependence on protected area)
Spatial and Temporal Aspects of Protected areas Shape of protected areas
The reserve shape of a protected area could be important for many reasons. Many authors wrote about the importance of the shape of the protected areas such as Farina (1998), Hocking et al. (2000), Nyhuus et al. (1991), Pelletier (2000), Shafer (1990) and O’Sullivan & Unwin (2003). Generally, a round non-fragmented area or a more circular shape is better than a more angular and/or irregular shape (figure 1). In addition to the importance of the area shape it is important to consider if a protected area is fragmented, for example, by a road. Therefore, in addition to the shape of protected area, data about the road, length and importance of the roads need to be considered in the process of planning for protected area.
Figure 1. Angular/irregular shape versus circular non-fragmented shape
Neighbourhood land uses
The increasing rate of landscape change over the past three hundred years has caused more variety in landscape types and a more heterogeneous environment. Today, it is more likely a natural area will be located close to developed areas. The importance of examining the environmental characteristics of the areas surrounding the protected areas has been stated by many authors such as Eagles et al. (2002), Leitao and Ahern (2002), Makhdoum (1999), Phillips (2002) and Siegfried et al.
(1998).
Some surrounding areas such as national parks or other types of reserves may help protected area to be more sustainable. But human activities such as agricultural activities, urbanisation, forestry, fisheries, catchment management, urban and industrial development, infrastructure, mining, transportation and recreation in surrounding areas can have negative impacts on the nature of protected areas.
Generally, proximity of protected areas to populated places and other incompatible activities such as mining, industrial activities and roads, as well as proximity to other reserves and protected areas must be considered in the process of planning for protected areas.
Temporal Characteristics
Protected areas are changing as the landscapes within them change. In addition, protected areas are parts of landscapes. Natural characteristics of protected areas are changing with the entire landscape changes. Changes may lead to temporal and/or spatial changes in the environmental characteristics of landscape. Changes can happen permanently such as the extinction of species and/or temporarily such as climate variability. Changes can happen continually (linear time) such as an increasing population through time (Egenhofer & Golledge, 1998). Changes can happen as repeatable events (circular time) such as seasonal climate changes (Figure 2).
Figure 2. Example diagrams of different time scales in temporal changes Key: left to right: an earthquake, population number increase, seasonality
Figure 3.A combination of linear and circular changes, for example, visitor pattern considering seasonal and population changes.
Temporal changes can happen regularly or irregularly. For a water resource, the temporal variation is made by, for example, irregular rainfall. Seasonal climate changes can alter the environmental characteristics regularly. Seasonal climate changes can also lead to regular temporal visitation patterns in protected areas.
Five major categories of processes in landscape change can be considered including ‘geomorphologic processes’, ‘colonisation processes’, ‘disturbances’, ‘cultural processes’ and ‘climate changes’ (Marcucci, 2000). The scale of temporal changes can be as short as a few seconds or as long as thousands of years (Marcucci, 2000). For example, an earthquake can be described as a short event. Generally, most of the geomorphologic and colonisation processes are too slow to be considered in the study of temporal characteristics in protected area planning, though some geomorphologic and colonisation processes such as erosion or growth of organisms can be considered in the process of protected area planning. The scale of changes caused by natural and cultural process, disturbance events or climatic changes and variability vary but mostly could be considered in the process of protected area planning.
Natural and cultural processes
Natural and cultural processes change the landscape of protected areas continually. Humans by reshaping and/or controlling the landscape, may change landscape function temporarily or permanently (Farina, 1998; Leitao and Ahern, 2002). Human needs, objectives and knowledge have changed the landscape of protected areas permanently (Mirkarimi & Arrowsmith, 2005). In addition, changes in the entire landscape because of cultural processes such as population increase, urbanisation, accessibility, and globalisation can slowly change the landscape of protected areas. At the temporal scale, the impact of tourist activities on protected areas is one of the most important protected areas management concerns.
Disturbance events
change the landscape of protected areas (Marcucci, 2000). Disturbance events have potentially both temporal and permanent spatial impacts on landscape.
Climatic processes
Climate changes can be considered as long-term occurring over thousands or millions of yearsor as short term processes such as diurnal or seasonal annual changes (Chapman & Codrington, 1993; Marcucci, 2000; Viles & Goudie, 2003). Climate changes can potentially affect other landscape processes such as geomorphologic processes, colonisation processes, disturbances and cultural processes. It could be including effects on hydrological cycle, glaciers, water levels or available beach area, rivers flooding, fire events and insect disturbances, fauna and flora growth, animal movement, erosion, weathering rates, soil development, biological process and vegetation and wildlife population (Christopherson, 1995; Lise Mulongoy and Chape, 2004; Newton, 2005; Price, 1981; Scott & Johns, 2005).
Changes in climate can also affect recreational uses and visitation patterns in protected areas (Lise & Tol, 2002; Scott & Johns, 2005). The water vapour content of air, wind speed and air temperature affect human body comfort. High temperature, high humidity and low winds bring most heat discomfort, whereas low humidity and strong winds increase cooling rates (Christopherson, 1995). Temperature is one of the most important factors in tourists’ visitation patterns. Generally, regardless of other factors, an average temperature of about 21°C is the ideal for the large bulk of international tourists (Lise & Tol, 2002). Maddison (2001) believes quarterly climate variables can be used to explain differences in flows of tourists (Maddison, 2001).
Principal controls and influences upon temperature patterns include altitude, latitude, continentality, ocean currents and wind currents (Price, 1981; Christopherson, 1995). The vectors of temperature changes are different through time and space. Great environmental contrasts may occur within long distances from a water body. Changes can happen in all environments but the difference is much greater in mountains. Because mountains extend vertically into different topography within small horizontal distances, they display more rapid changes in environmental characteristics such as fauna, flora, climate, soil and temperature (Price, 1981). According to the ‘adiabatic lapse rate’, for the atmosphere, the drop in temperature of rising, unsaturated air is about 10°C per 1000 metre altitude (Glossary of Meteorology, 2005).
Analysisng Spatial and Temporal Characteristics of protected area
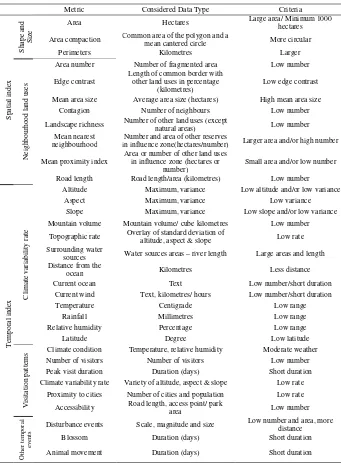
the spatial characteristics of protected areas some relevant landscape metrics to consider the effect of size, shape and neighbourhood land uses could be determined. Landscape spatial metrics can provide data about some spatial attributes of the landscape that can be used to support a quantitative approach to landscape planning (Gergel & Turner, 2002; Leitao and Ahern, 2002). There are hundreds of metrics developed to analyse landscape structures in the literature. For example, a spatial pattern analysis program called “FRAGSTATS 2.0” (McGarigal and Marks, 1995) is designed to calculate 59 different metrics. Metrics are strongly correlated and can be elaborated (Leitao and Ahern, 2002). In their study, Leitao and Ahern (2002) selected nine landscape spatial metrics as a ‘core set’ to support a quantitative approach for landscape planning based on ecological knowledge. These metrics are ‘patch shape’, ‘edge contrast’, ‘patch compaction’, ‘mean nearest neighbour distance’, ‘proximity or mean proximity index’, ‘contagion’, ‘landscape richness’, ‘area number’ and ‘mean area size’. However, in order to consider the effect of roads within the protected areas, ‘road length’ must be added to the ‘core set’. Table 2 shows a list of spatial and temporal data required for landscape ecological planning and criteria for analysing spatial and temporal metrics. The list also can be used in the interpretation of spatial and temporal management issues of protected areas. Using the metrics introduced for this research project, the criteria state a more circular area with less fragmentation as well as less climate variability. As indicated in the table, a more circular ‘area’, large ‘area’, ‘perimeters’ and ‘mean nearest neighbourhood’, low number in ‘area number’, ‘edge contrast’, ‘contagion’, ‘landscape richness’, ‘road length’ and ‘mean proximity index’ as well as high ‘mean area size’ indicate a more circular and a less fragmented area. Large area and length of ‘surrounding water sources’, low number of ‘altitude’, ‘aspect’, ‘slope’, ‘mountain volume’, ‘topographic rate’, ‘distance from the ocean’, ‘current ocean’, ‘current wind’, temperature’, ‘rainfall’, ‘relative humidity’, ‘latitude’, ‘visitors’ and ‘accessibility’ as well as short duration of ‘peak visit duration’, ‘blossom’ and ‘animal movement’ indicate an area with less climate variability.
Landscape Ecological Planning for protected areas
Table 2. Spatial and temporal data required for planning and criteria for analysing spatial and temporal metrics
Metric Considered Data Type Criteria
S p at ia l in d ex S h ap e a n d S iz e
Area Hectares Large area/ Minimum 1000 hectares
Area compaction Common area of the polygon and a
mean cantered circle More circular
Perimeters Kilometres Larger
N ei g h b o u rh o o d l an d u se s
Area number Number of fragmented area Low number
Edge contrast
Length of common border with other land uses in percentage
(kilometres)
Low edge contrast
Mean area size Average area size (hectares) High mean area size
Contagion Number of neighbours Low number
Landscape richness Number of other land uses (except
natural areas) Low number
Mean nearest neighbourhood
Number and area of other reserves
in influence zone(hectares/number) Larger area and/or high number
Mean proximity index
Area or number of other land uses in influence zone (hectares or
number)
Small area and/or low number
Road length Road length/area (kilometres) Low number
T emp o ra l in d ex C li m at e v ar ia b il it y r at e
Altitude Maximum, variance Low altitude and/or low variance
Aspect Maximum, variance Low variance
Slope Maximum, variance Low slope and/or low variance Mountain volume Mountain volume/ cube kilometres Low number
Topographic rate Overlay of standard deviation of altitude, aspect & slope Low rate
Surrounding water
sources Water sources areas – river length Large areas and length Distance from the
ocean Kilometres Less distance
Current ocean Text Low number/short duration
Current wind Text, kilometres/ hours Low number/short duration
Temperature Centigrade Low range
Rainfall Millimetres Low range
Relative humidity Percentage Low range
Latitude Degree Low latitude
V is it at io n p at te rn
s Climate condition Temperature, relative humidity Moderate weather
Number of visitors Number of visitors Low number Peak visit duration Duration (days) Short duration Climate variability rate Variety of altitude, aspect & slope Low rate
Proximity to cities Number of cities and population Low rate
Accessibility Road length, access point/ park
area Low number
O th e r te m p o ra l ev e n ts
Disturbance events Scale, magnitude and size Low number and area, more distance
Blossom Duration (days) Short duration
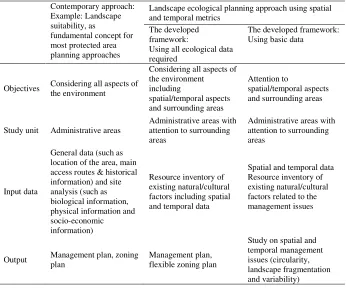
Table 3. Objectives, study unit, input and output data in the contemporary approach and the developed framework.
Contemporary approach: Example: Landscape suitability, as
fundamental concept for most protected area planning approaches
Landscape ecological planning approach using spatial and temporal metrics
The developed framework:
Using all ecological data required
The developed framework: Using basic data
Objectives Considering all aspects of the environment
Considering all aspects of the environment including
spatial/temporal aspects and surrounding areas
Attention to
spatial/temporal aspects and surrounding areas
Study unit Administrative areas
Administrative areas with attention to surrounding areas
Administrative areas with attention to surrounding areas
Input data
General data (such as location of the area, main access routes & historical information) and site analysis (such as biological information, physical information and socio-economic information)
Resource inventory of existing natural/cultural factors including spatial and temporal data
Spatial and temporal data Resource inventory of existing natural/cultural factors related to the management issues
Output Management plan, zoning plan
Management plan, flexible zoning plan
Study on spatial and temporal management issues (circularity, landscape fragmentation and variability)
Table 3 compares objectives, study unit, input and output data between the contemporary approach and the developed framework for protected areas. When the aim is to study spatial and temporal aspects of protected areas, the developed framework does not need detailed data in all aspects of ecological characteristics of the area. Therefore, it is a suitable framework especially for areas with lack of detailed data. Obviously, detailed ecological data are vital in protected areas management and planning however, when time and cost are issues, the framework can be used to determine what data must be collected first.
zoning plan is a plan considering spatial/temporal changes in landscape. In a flexible plan, the recreational zone of a park may be managed as a conservation zone in a limited period and vice versa. For example, a recreational road crossing animal corridors must be closed at the time of animal migration or the road may also be closed in the high flood risk period.
Figure 5. A model of process of ecological planning for protected areas using spatial and temporal metrics
Key: derived from the process of contemporary ecological planning approach to protected areas, added to body of the process of contemporary ecological approaches to protected areas
Planning for protected area using spatial and temporal metrics
Implementation of a flexible zoning plan Analysis
Resource inventory of existing spatial, temporal and contextual
factors at landscape scale (the area under study and its
surrounding areas) Resource inventory of existing natural/cultural factors - issues identification, consultation
Determining the spatial and temporal metrics listed in table 2
Preparation of landscape ecological management plan
Developing management vision and objectives General objectives for protected areas planning
Description of national and regional
context
Public consultation
on the draft plan
Identifying spatial and temporal management issues using table 2
Planning scenario for the spatial and temporal issues
The Case Studies
A case study approach was used to examine the developed framework. The case areas were selected from Iran and Australia. Iran and Australia have various environmental characteristics. This can explore the effects of biophysical and sociological differences on spatial and temporal issues. For example, while Iran has more deciduous plants, Australia has more evergreen flora and this will result in aesthetic differences in landscape between seasons. In addition, compared with Australia, Iran is a mountainous country. Moreover, Iran has higher population density areas compared with Australia.
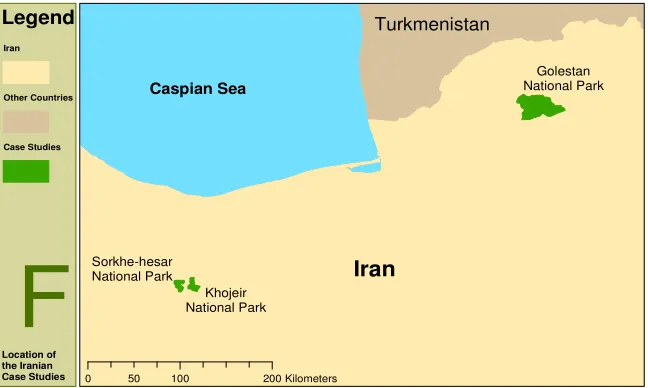
Figure 4. The Iranian case studies
Three case studies were selected for each country (Figures 4 and 5). Three Iranian national parks (Golestan National Park, Khojeir National Park and Sorkhe-hesar National Park) were selected as case studies for this research. National parks in Iran have the highest rate of biodiversity and the most variety of management zones compared with the other types of protected areas. Golestan National Park, for example, is one of the most important natural parks in Iran. The park presents a rich biodiversity area including one third of Iran’s total bird species, 50 percent of total mammal species and over 1300 plant species. The park is fragmented by a highway. Khojeir National Park and Sorkhe-hesar National Park are located between the mountainous areas of Alborz and the desert plain of Dashte-kavir. Therefore, their landscapes are a combination of mountains and desert, and they are
Location of the Iranian Case Studies
F
Sorkhe-hesarNational Park LegendIran
Other Countries
Case Studies
0 50 100 200Kilometers
Turkmenistan
Khojeir National Park
Iran
rich in plant diversity. The parks are located in one of the most developed areas in Iran. They are close to the capital of Iran, Tehran.
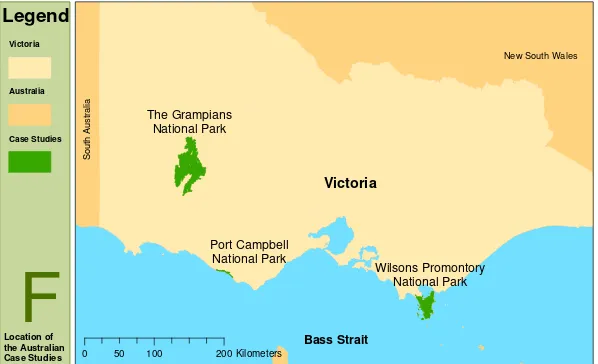
Figure 5. The Australian case studies
Three Australian national parks (the Grampians National Park, Port Campbell National Park and Wilsons Promontory National Park) have been selected as case studies. The Australian case studies were selected because of their general similarity with the Iranian case studies, such as being equivalent from a management point of view and being important at local and international levels. According to the International Union of the Conservation of Nature and Natural Resources (IUCN) categories of protected areas, like the Iranian study areas, the three Australian case studies are assigned Category II (national parks); therefore, from the protected area management point of view, they are equivalent. In addition, study areas were selected having different spatial and temporal aspects. The cases show different proximity to township areas as well as different climatic variability, visitation patterns, size and shape.
The Grampians National Park is a mountainous terrestrial protected area with an irregular shape and close to township areas. Port Campbell National Park is a small coastal protected area with a linear shape. It is located on the Great Ocean Road which is a high tourist destination. This park was selected as a sample of a coastal protected area with a huge number of visitors and contains an important road. Wilsons Promontory National Park was selected as an example of a big peninsula area close to township areas.
Port Campbell National Park
Wilsons Promontory National Park
S
o
u
th
A
u
s
tr
a
lia
The Grampians National Park
New South Wales
0 50 100 200Kilometers
Victoria
F
Location of the Australian Case StudiesBass Strait
Legend
Victoria
Australia
3.Results and Discussion
The spatial metrics indicate that the Iranian case studies show a lower level of ‘area’, ‘perimeters’, ‘shape irregularity’, ‘area number’, ‘mean area size’, ‘edge contrast’, ‘mean nearest neighbourhood distance (number)’ and ‘mean proximity index (rail and roads)’ compared with the Australian case studies.
On the other hand, the levels of ‘mean nearest neighbourhood distance (area)’, ‘mean proximity index (populated places)’, ‘mean proximity index (major cities)’ and ‘road length’ are higher in the Iranian case studies. Generally, this indicates that the Iranian case studies are located in highly populated landscapes, and therefore their traditional use can be considered as an important issue. In contrast, the metrics suggests that the Australian case studies are located in less populated landscapes.
Compared with the Australian case studies, the Iranian case studies have higher altitude. There is no significant difference between the average altitudes of the Iranian case studies. However, each of the Australian case studies shows differences in the average altitude compared with the other case studies. The Iranian case studies have higher slopes compared with the Australian case studies. In addition, the Iranian case studies have lower ‘river length’ and ‘water source’. Generally, the Iranian case studies have the highest range and average annual temperature. Golestan National Park, with minimum ‘water source’ and maximum ‘mountain volume’, maximum altitude range and maximum slope range and average, has the maximum annual average range of temperature. This indicates that the landscape of the park is highly variable in different seasons. In contrast, Wilsons Promontory National Park with maximum ‘water source’ and low ‘mountain volume’ has the minimum annual average range of temperature. Generally, temporal metrics indicate more ‘climate variability’ for the Iranian case studies. This suggests a flexible zoning plan for the Iranian case studies.
High climate variability for the Iranian case studies, can lead to high risk of natural disaster or a high variation in visitation patterns. Temporal disturbance event such as floods have killed hundreds of the park’s visitors and animals in the last decade in Golestan National Park (ISNA, 2006). People must be prohibited from going through the Park during flood periods. The road must be also closed to visitors at these times. A flexible zoning plan is recommended for the Park. The determined metrics and their management implications for the case studies were summarised in Table 4.
4.Conclusion
‘landscape richness’, ‘edge contrast’, ‘mean nearest neighbourhood’, ‘mean proximity index’ and ‘road length’. Key temporal data requirements include ‘altitude’, ‘aspect’, ‘slope’, ‘mountain volume’, ‘topographic variability rate’, ‘area of surrounding water sources’, ‘distance from the ocean’, ‘current ocean’, ‘current wind’, ‘temperature’, ‘rainfall’, ‘relative humidity’, ‘latitude’, ‘number of visitors’, ‘peak visit duration’, ‘proximity to cities’, ‘accessibility’ as well as ‘time and duration of disturbance events’, ‘blossom’ and ‘animal movement’.
The results of the case study were determined that compared with the Australian case studies, the Iranian case studies are located in a higher density populated area and have higher climate variability. For the Iranian case studies a flexible zoning plan and more attention on the possible spatial/temporal impacts of neighbourhood land uses and local community on protected areas were recommended.
References
Aarde, R., and Jackson, T. 2006. "The big picture" Africa Geographic: Elephants and Us. April. 76-79.
Arrowsmith, C. 2003. Modelling potential for nature-based tourism, In Buckley, R., Pickering, C. and Weaver, D. C. Nature-based Tourism.Environment and Land Management. CAB International. pp. 167-179.
Arrowsmith, C., and Chhetri, P. 2003, Port Campbell National Park: pattern of use, Final report to Parks Victoria, Melbourne. pp. 6-8, p. 77.
Bennett, A.F. 1999. Linkages in the landscape: the role of corridors and connectivity in wildlife conservation, IUCN, Gland, Switzerland and Cambridge. UK. 254 p.
Brotherton, I. 1996. Protected area theory at the system level. Journal of Environmental Management. 47: 369-379.
Christopherson, R.W. 1995. Elemental geosystems: a foundation in physical geography, Prentice Hall, New Jersey. 534 p.
Douglass, R.W. 1975. Forest recreation, Pergamon Press Inc. New York. 336 p.
Eagles, P.F.J., McCool, S.F., and Haynes, C.D. 2002. Sustainable tourism in protected areas: guideline for planning and management, IUCN, Gland, Switzerland, and Cambridge, UK, the United Nations Environmental Programme and the World Tourism Organization. 185 p.
Egenhofer, M.J., and Golledge, R.G. 1998. Spatial and temporal reasoning in geographic information systems, Oxford University Press, New York. 276 p.
Farina, A.1998. Principles and methods in landscape ecology, Chapman & Hall Ltd, New York. 235 p.
FAO.1988. National Parks Planning: a manual with annotated examples, Food and Agriculture Organization of the United Nations. Rome. 29 p.
Forman, R.T.T., and Godron, M. 1986. Landscape ecology, John Wiley & Sons, New York. Forster, R. Planning for man and nature in national parks: reconciling preparation and use, IUCN, Morges, Switzerland. 619 p.
Gergel, S.E., and Turner, M.G. 2002. Learning landscape ecology: a practical guide to concepts and techniques, Springer-Verlong, New York. 316 p.
Holdgate, M. 1999. The green web, Earthscan Publisher, London. 308 p.
IUCN.1994. Guideline for protected area management categories, IUCN, CNPPA with assistance of WCMC, Gland, Switzerland and Cambridge, UK. 261 p.
Leitao, A.B., and Ahern, J. 2002. Applying landscape ecological concepts and metrics in sustainable landscape planning. Landscape and urban planning. 59: 65-93.
LISE, W., and TOL, R.S.J. 2002. Impact of climate on tourist demand. Climate Change. 55: 429-449.
Maddison, D. 2001. In research of warmer climates? the impact of climate change on flows of British tourists. Climatic Change. 49: 193-208.
Madjnoonian, H. 1998. Guidelines for protected mountain areas. Department of the Environment of Iran. Tehran (in Persian).
Madjnoonian, H., Zehzad, B., Kiabi, B., Darrehshoori, B.F., and Meigouni, H.G. 1999. Golestan National Park: biosphere reserve. Department of the Environment of Iran, Tehran. 129 p (In Persian).
Makhdoum, M.F. 1999. Fundamentals of Land Use Planning. Tehran University, Tehran. 289 p (in Persian).
Makhdoum, M.F., Azarnivand, H., Jafari, M., Jamali, V., Tabiee, N.D., Sigaroudi, S.K., Salajeghe, A., Feiznia, S., Kiabi, B., Mohajer, M.R.M., and Mirkarimi, S.H. 1999. Golestan National Park: a comprehensive management plan, (In Persian), University of Tehran and Department of the Environment of Iran, Tehran. 386 p.
Marcucci, D.J. 2000. Landscape history as a planning tool. Landscape and Urban Planning. 49: 67-81.
McGarigal, K. and Marks, B.J. 1995. FRAGSTATS: spatial patterns analysis program for quantifying landscape structure, Gen. Tech. Rep. PNW-GTR-351. OR: U.S. Department of Agriculture, Forest Service, Portland Oregon Pacific Northwest Research Station. McHarg, I.L. 1997. Natural factors in planning.Journal of Soil and Water Conservation. 52
(1): 13-17.
Miller, K.R. 1987. Planning national parks for ecodevelopment: methods and cases from Latin America, Peace Corps, Washington DC. 759 p.
Mirkarimi, H., and Arrowsmith, C. 2005. "A landscape ecological approach to protected area management", Proceedings of the SpatialScience Conference 2005 'Spatial Intelligence, Innovation and Praxis' The biennial conference of the Spatial Sciences Institute,September, 2005. Melbourne, Spatial Sciences Institute. ISBN 0-9581366-2-9, p. 85.
Mulongoy, K.J., and Chape, S. 2004. Protected areas and biodiversity: an overview of key issues, CBD Secretariat, Montreal, Canada and UNDP-WCMC, Cambridge, UK. 56 p. Ndubisi, F. 2002. Ecological planning: a historical and comparative synthesis, The Johns
Hopkins University Press, Baltimore. 168 p.
Newton, I. 2005. New insights on the ecology of bird migration. Trends in Ecology & Evolution. 20(6): 292-293.
O’Sullivan, D., and Unwin, D. 2003. Geographic information analysis, John Wiley & Sons, New Jersey. 436 p.
Pelletier, J.D. 2000. Model assessments of the optimal design of nature reserves for maximizing species longevity. Journal of Theoretical Biology. 202: 25-32.
Phillips, A. 2002. Management guideline for IUCN category V protected areas: protected landscapes/seascape, IUCN, Gland, Switzerland and Cambridge UK. 141 p.
Price, L. 1981. Mountains and man, University of California Press, Berkeley. 506 p. Siegfried, W.R., Benn, G.A., and Gelderblom, C.M. 1998. Regional assessment and
conservation implications of landscape characteristics of African national parks. Biological Conservation. 84: 131-140.
Shafer, C.L. 1990. Nature reserves: island theory and conservation practice, Smithsonian Institution Press, Washington. 185 p.
Thomas, L., and Middleton, J. 2003. Guidelines for management planning of protected areas, IUCN, Gland, Switzerland and Cambridge. UK 183 p.