Journal of Industrial Engineering and Management Studies
Vol. 6, No. 1, 2019, pp. 1-17
DOI: 10.22116/JIEMS.2019.87659
www.jiems.icms.ac.ir
Partial inspection problem with double sampling designs in
multi-stage systems considering cost uncertainty
Taha-Hossein Hejazi1,*, Pardis Roozkhosh2
Abstract
The nature of input materials is changed as long as the product reaches the consumer in many types of manufacturing processes. In designing and improving multi-stage systems, the study of the steps separately may not lead to the greatest possible improvement in the whole system, therefore the study of inputs and outputs of each stage can be effective in improving the output quality characteristics. In this study, the double sampling method is applied for inspection where decision variables are the sample size per sampling time and the maximum amount of defective items in the first and second samples in each stage. Furthermore, uncertainty in parameters such as production, inspection, and replacement costs are included in the objective function and handled by a Monte-Carlo based optimization method. In order to show the efficacies of the proposed method, a numerical example has been designed, and further analyses on solutions have been conducted.
Keywords: Double sampling plan; Genetic Algorithm; Monte Carlo Optimization; Inspection Error, Multistage Systems.
Received: October 2018-27
Revised: December 2018-11
Accepted: February 2019-02
1. Introduction
The behavior of manufacturing companies in the market is changing due to the increasing dynamism, economic, social, political, and technologicalcomplexity. The products, processes and systems are challenged by external stimuli, including new regulations, new materials, technology, services, communications, cost pressures, and sustainability (Colledani et al., 2014).
The quality of products is considered as a major concern in the manufacturing system, therefore, implementation of optimal inspection policies is of great importance for reducing quality cost (Zhu et al., 2016).
The study of quality control methods in multi-stage systems is essential to improve and control products and prevent the production of non-conforming items in the system. Products
* Corresponding author; [email protected]
and systems with more complexity are facing a larger set of defects. In these situations, companies are inspecting large amounts of investment in flexible inspection systems and management issues.
For statistical modeling in multi-stage systems, the samples are randomly taken of each stage of the system, and according to the policy of the double sampling design, the sample is accepted, rejected or taken again. The advantage of double sampling designs over single sampling is that if the first sample size is less than single sampling designs, in cases where it is possible to make a decision by the first sample, less average total inspection is obtained (Montgomery, 2009). In real situations, estimating the cost elements have a significant degree of uncertainty due to the variety of error sources and the actions needed to remove their effects across the production line. Moreover, the inspection activities may include some error specially in detecting faulty items.
Using double sampling designs reduces defective items in the system as a result of increased productivity and reduced costs. Therefore, this study was carried out to minimize the inspection costs using a double sampling method under uncertainties in cost elements such as inspection, production, and replacement.
The model presented in this study is a stochastic nonlinear integer programming for which a Monte-Carlo based genetic algorithm is used to find a best possible solution in reasonable time. The rest of the paper is organized as follows. Review of major works in the literature is presented at Section 2, the process under study and its statistical relationships are described at Sections 3 and 4. Finally, a numerical example is presented in Section 5 to optimize the inspection costs by using the double sampling method and the concluding remarks are given at Section 6.
2. Literature review
Manufacturing systems generally consist of several stations or stages in which raw materials are passed through various operations and ultimately become final products. This type of system is called a multi-station (or multi-stage) manufacturing system (MMS) (Zhou et al., 2003). In MMS, each processing station produces some defective items. The statistical process control techniques (SPCs) can be used as a simple idea to maintain the quality level of an inspection station after the last station, so that all non-conforming products can be eliminated using complete inspection and nonconforming items can be detected. This is generally referred as Output Inspection (Sarhangian et al., 2008). However, using output inspection, all investment efforts and costs are lost by generating defective items across previous stations. It is more reasonable that inspection stations after each major production process are considered to ensure that a certain quality level is maintained. Therefore, the inspection strategy indicates the number and location of inspection stations and inspection parameters (sample size, sampling distance, acceptance number, or control limitations) for each inspection station. Considering quality control in MMS, the main issue is that the output of operations at the lower stations can be achieved by operating at high stations. In addition, a product or a work-in-process part in a multi-station work-in-process may introduce additional variations. This phenomenon is called the stream of variations. When quality features or process variables are quantitative, mathematical models can describe the quality state function. By building the model, we can find the factors affecting final quality features, which is also important for analyzing the root cause of whether deviation from the quality targets occurs.
developed by Hawkins was introduced as a standard statistical method for describing the quality function. The relationship between input quality and output quality variables is identified by a regression model through the data gathered from monitoring the specific station (Hawkins, 1991).
Yum and McDowellj (2007) used rework, repair and disposal to deal with defective products. They used an integer 0-1 program to solve optimal inspection settings.
Zantek et al. (2002) have used a simultaneous equation model to show the statistical relationships between quality measurements from several stations in a process. As the methods are based on a statistical model, it is usually possible to explicitly describe the relationship without any requirements of special engineering knowledge.
Zhou et al. (2003) discussed a sample of a two-dimensional car panel manufacturing process that includes multiple operation stations and product inspection for surface finish, common quality and dimensional nonconformities. Also, the authors presented another example involving hundreds of stations, and more than 30 stations are only needed for engine machining.
Xiang and Tsung (2008) introduced an exponential moving average (EMA) design as a monitoring method for multi-station processes described by an engineeringspace state. Shi and Zhou (2009) examined quality control and improvement for multi-station systems. In some conditions, the defective ratio of each station is not considered, but the relationship between the quality characteristics of the two adjacent stations can be described due to the regression models or engineering models. The only relationship between manufacturing stations is the quality level of product delivery from the former station to the latter one. In addition, the nature and defects ratio is such that the number of non-conforming items can be algebraically added from one station to another. For example, the ratio of non-conforming station 2 is equal to the failure rate of station 1 plus the failure rate generated at station 2. Attribute control charts (ACCs) are helpful for addressing this problem.
Heredia-Langner et al. (2002) formulated a very limited multi-stage inspection problem in which all inspection stations were to be partially corrected, and solved it using the Genetic Algorithm (GA). In this model, type I and II of the inspection errors are considered, but only the defective rate is considered in the control state.
Kaya and Engin (2007b) presented an ACC optimization model based on the sampling method to accept multi-stage processes. They solved a model using the binary genetic algorithm coding structure. They provided an application for a piston manufacturing process. Also, the sample size, n, was suggested by GA to determine the ACCs.
Engin et al. (2008) have provided a similar model based on a fuzzy method for ACC in multi-station processes. They assumed that some of the parameters in the model are fuzzy. The model design was based on acceptance sampling and was solved by GA. The proposed method is used in an engine poppet valve manufacturing company. In the Kaya model as shown above, the defective rate for each station remains unchanged. It is assumed that MMS is always running under controlled conditions without changing the quality. Out-of-control conditions would cause ignoring the increase in nonconforming product prices.
variables. First: the inspection stages which are carried out. Second: inspection tolerance. Third: inspection sample size. Also, multiple ACCs in multi-station manufacturing systems can be categorized as an optimization problem in the inspection strategy. The comprehensive inspection policy will be complex for multi-stage processes due to all the simultaneous inspection parameters in the joint optimization problem.
Sarhangian et al. (2008) have introduced the Particle Swarm Optimization (PSO) algorithm to find an optimal inspection policy in the sequential multi-stage station manufacturing process. This policy consists of three decision variables for optimization including stations in which the inspection is carried out, the inspection tolerance and the sample size. Also, they used simulation optimization in order to determine the optimal inspection strategy for multi-station production systems. The optimal inspection strategy leads to minimized total inspection cost ensuring the required quality of the output is achieved. Hence, simulation was used for the complexity of the problem in the multi-stage process model and used to calculate inspection costs.
Van Volsem et al. (2007) have used a simulation model to study the multistage inspection problem and find an optimal inspection strategy by an evolutionary algorithm. Their method made possible determination of the inspection type (0%, 100% or sampling), which must be considered at each station.
Zhu et al. (2016) concluded that the MMS inspection policy not only affects the production of defective products, but the detection of an out-of-control state could lead to considerable costs due to quality changes. The calculation of the MMS state becomes very complex and the cost analysis becomes hard when each station is in the out-of-control or control state. All products are sent from the beginning to the end in the MMS system, and non-conforming ones are discarded when they are sampled by sampling.
This study has focused on design optimization of the inspection strategy including quality changes for MMS, in which multiple ACCs are generally used for quality control. All products are transmitted through MMS, and nonconforming ones are discarded if they are found by the sampling inspection method. The station may remain in the out-of-control or control state. The MMS cost structure is analyzedbased on Steady-State Probability Distribution (SSPD). The ACC optimization model is then implemented, in which the goal of optimization is to minimize costs, and the parameters of the decision-making variables of the control graph are shown by m, n, and c. The ACCs optimization model is facing problems of large solution space. Therefore, an integrated algorithm which combines some metaheuristic algorithms has been suggested. Fig. 1 shows a kind of MMS in which raw materials are transmitted with non-conforming rates through assembly stations, and will be finally converted to the final products. Each station can be in out-of-control or control state according to the conditions and equipment and environmental factors. In (Colledani and Tolio, 2012), it is expected that the variable cost (EVC) of each product includes two parts when entering the MMS. One of them is the expected production cost (EPC) and the other is the loss of expected success (ESC), due to non-conformities among the finished products.
For mass production, it can be assumed that MMS operations are in a stable condition, and EVC selection in this situation is a cost effective criterion for the evaluation. Parameters mi,
1
n and c1 should be considered to minimize EVC.
Rau et al. (2011b) examined sampling design for optimal allocation of inspection in multi-stage systems considering reworks. The defective components detected in the sampling plan are returned to the related workstations for rework. This study minimizes the total cost of sampling design at each workstation.
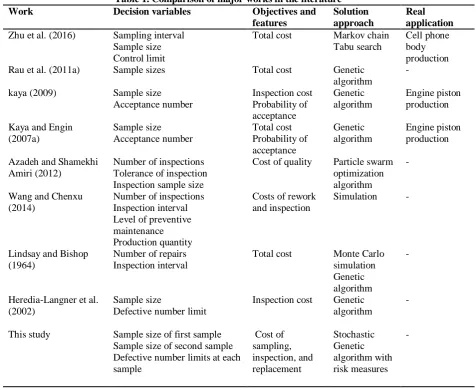
Table 1. Comparison of major works in the literature Real application Solution approach Objectives and features Decision variables Work Cell phone body production Markov chain Tabu search Total cost Sampling interval Sample size Control limit Zhu et al. (2016)
- Genetic
algorithm Total cost
Sample sizes Rau et al. (2011a)
Engine piston production Genetic algorithm Inspection cost Probability of acceptance Sample size Acceptance number kaya (2009) Engine piston production Genetic algorithm Total cost Probability of acceptance Sample size Acceptance number Kaya and Engin
(2007a)
- Particle swarm optimization algorithm Cost of quality
Number of inspections Tolerance of inspection Inspection sample size Azadeh and Shamekhi
Amiri (2012)
- Simulation Costs of rework
and inspection Number of inspections
Inspection interval Level of preventive maintenance Production quantity Wang and Chenxu
(2014) - Monte Carlo simulation Genetic algorithm Total cost
Number of repairs Inspection interval Lindsay and Bishop
(1964) - Genetic algorithm Inspection cost Sample size
Defective number limit Heredia-Langner et al.
(2002) - Stochastic Genetic algorithm with risk measures Cost of sampling, inspection, and replacement Sample size of first sample
Sample size of second sample Defective number limits at each sample
This study
We can conclude from the above table that quality inspection in multistage systems is an important task to ensure the final product satisfaction. Therefore, this paper tries to consider several aspects of this problem which have not been taken into account together. Among them, the main focus would be on inspection error, uncertainty in cost elements in designing an optimal double sampling scheme for inspection in multistage systems. Also, a new hybrid genetic algorithm has been introduced to handle the uncertainties.
3. Process description and mathematical modeling
Since, the number of items (N ) is relatively large, two samples with n1 and n2 sizes are randomly selected to specify the quality level.
If the number of defective items in the first sample (d )1 is less than or equal to a predetermined value (c1), the sample will be accepted and all items will go to the next step of production. But if d1>c2, the sample is rejected, and all items will be inspected in order to repair all defective items or replace them by healthy ones. However, when d1>c1and d1<c2, it is not possible to decide on the rejection or acceptance of the items, so the second sample (of sizen2) must be taken.
1
1 1 1
1
d 1
1 1
d 0 1 1 1 !
(d ) (1 )
d !( d )!
c
n d
a
n
p p c p p
n
(1)Here, p is the percentage of defective items produced.
The acceptance probability of the second sample is as follows:
1 2 2 1 1 2
( )
a
p p d d c c d c (2)
The average outgoing quality in the double sampling design and for the described process is equal to:
1 1 2
[P Na( n ) Pa (N n n )]p AOQ
N
(3)
and the average total inspection (ATI) is:
1 a
(
1 2)
a(1
a)
ATI
n p
n
n p
N
p
(4)
where, pa pa pa.
The average sample number (ASN) can also be computed by the following equations in case of curtailment in the second sample (Montgomery, 2009).
2
1
2
1 1 2 2 2 2 2
1
1
( , )[ ( , ) ( 1, 2)]
c
M L M
j c
c j
ASN n p n j n p n c j p n c j
p
(5)where, is the probability of observing exactly j defectives in a sample of size , and is the cumulative probability function for defectives.
In this study, the quality policy for the process requires product inspection after each major production stage.
3.1. Modeling assumptions
Before the model is introduced, some assumptions are considered in modeling and analysis phases are expressed.
1. The lot size ( ), the sizes of the first and second samples (n1i,n2i ), and the percentage of production defective items in stage have valid values for using a binomial distribution (for all stages of the process).
2. The only relationship between the stages of production is the quality level of production delivery from one stage to the next. For example, if the percentage of defective items from stage 2 has two components: AOQ1 and the percentage of defective products only
in the second stage.
3. When examining a product, the inspector may encounter two types of errors: rejecting the healthy items (type I error) and accepting the unhealthy ones (type II error). These errors are constant for the inspector. The inspection cost at each stage is directly proportional to the total number of inspection.
4. The following conditions illustrate how to decide on n1i,n2i and c1i,c2i at each step. a. The inspection cost is minimized.
b. The items under inspection are accepted with high probability, if the percentage of defects in the current stage is small.
( , )
M
P n j j n
,
L
P n j j
i
N
c. All constraints, for example, the level of quality or sample size under inspection to be met at different stages.
5. In order to achieve an optimal design of sampling procedure, two levels of quality have been assumed with corresponding errors , , so that the following criteria are met:
a. The acceptance probability of a lot with quality level is greater than 1. b. The acceptance probability of a lot with quality level is less than .
3.2. Notations
: The ratio of defective items at stage i : The lot size at step i
: The size of the first sample inspected at stage i : The size of the second sample inspected at stage i
: The parameter of acceptance of the first sample in stage i : The parameter of acceptance of the second sample in stage i : Number of defective items in the first sample in stage i
: Number of defective items in the second sample at stage i : Type I error of the first sample at stage i (healthy but rejected)
: Type II error of the sample at stage i (defective but accepted) : The probability of acceptance by the first sample in stage i
: The probability of acceptance by the second sample in stage i : The probability of the items being rejected in stage i
: Nondeterministic sampling cost at stage i : Nondeterministic inspection cost at stage i
: Nondeterministic replacement cost at stage i Where, is calculated as follows:
(1 ) (1 )
i i i i i
R p p A (6)
1
1 1 1
1
d 1
1 1
d 1 1 1 !
(d ) (1 )
d !( d )!
i
i i i
i
c
n d
i
i i i i i
i i i
n
pa p c R R
n
(7)1 2 2 1 1 2
( )
i i i i i i i
pa p d d c c d c (8)
Where,
pa pa
i,
ifollow the binomial distribution. Also, is as follows:Where,pi pi0AOQi1, and AOQ00.
The average output quality at stage i if
i,
A
i
0
, is calculated according to the following formula,0
1 1 1 2
( i i )[ i( i i) i ( i i i)]
i
i
p AOQ Pa N n Pa N n n
AOQ N (9) 0 1
(pi ,pi)
and also if the average output quality in step i if
i,
A
i
0
, is calculated as given below.1 2 1
1 2 1
1 2
( )
( ) ( )(1 )
( )(1 )
(1 )
i i i i i i i
i i i i i i i i i
i i i i i
i
i i
n n Pa N n
p Pa N n n N n Pa
N n n Pa
AOQ N R (10)
The average total of inspections in stage i was calculated as follows:
1 ( 1 2 ) (1 )
1
i i i i i i i
i
i
n pa n n pa N pa
ATI
R
(11)
Finally, the proposed optimization model can be written with respect to the mentioned equations.
1 0 1 1
minTC
(ai ASNi b ATIi i x Ni i(1pa pi) i) (12)(13) (14) (15) (16) (17) (18) (19)
In the above equation, n1i,n2iand c1i,c2iare integers and the values of *
i
AOQ , *
i
ATI are predetermined. It should be noted that the superscripts correspond to the assumed level of quality for the lots.
The objective function (12) includes the total cost of sampling, inspection, and replacement in each stage. Constraints (13) and (14) limit the average output quality and average total inspection at each stage. Constraints (15) and (16) are related to the probability of acceptance for the two assumed quality levels.
Constraint (17) implies that the maximum defective number allowed at the second stage must be greater than the one at the first stage. Constraint (18) guarantees that the maximum allowed value for defective items cannot exceed the sample size.
4. Uncertainty analysis and solution methods
As mentioned before, the objective function (12) that denotes total costs in such systems consists of some parameters with nondeterministic value. These parameters with a bar symbol (a b xi, ,i i) are related to the cost structure of the assumed system. There are many research
studies that support this assumption for cost values (Zhang et al., 2016, Hong et al., 2016, Gao et al., 2016). Due to the existing variability in elements of production, inspection, and replacement activities, uncertainty analysis can be a realistic way to handle the related costs. In this study, we apply a Monte-Carlo simulation based approach embedded in GA to cope with the uncertainty in parameters. Uniform distribution has been assumed to be followed by
1 *
i i
AOQ AOQ i 1, 2,...m
1 *
i i
ATI ATI i 1, 2,...m
0 1
i
pa i 1, 2,...m
1
i
pa i 1, 2,...m
2i 1i 0
c c i 1, 2,...m
1i 2i 1
n c i 1, 2,...m
1i 0, 2i 0, 1i 0, 2i 0
all nondeterministic parameters for which the lower and upper bounds must be estimated based on historical data or expert judgment.
The Monte-Carlo technique iteratively evaluates functions of random variables considering one single value of each of them. Then, by some measures such as mean and variance of observed function values, the behavior of random outputs can be studied (Hubbard, 2014).
4.1. Monte-Carlo based GA
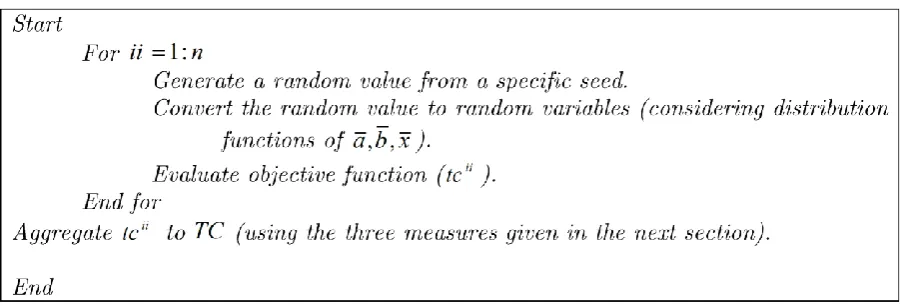
GA has been used to find the optimal solution for the problem in this study, because this algorithm always finds a fairly good solution (near optimal) in a reasonable time. Since the cost parameters in this model are considered to be nondeterministic, the Monte-Carlo simulation technique is applied to evaluate the objective function defined for GA calculation. Standard GA is a recognized method of non-classic/metaheuristic optimization and has been used in variety of research projects (Lin et al., 2015, Saghaei et al., 2014, Liu et al., 2015, Moura et al., 2015, Kim and Kim, 2017), so for the details of this method, one can refer to the mentioned works. It is worthy to note that modified versions of GA or hybrid editions of it and other metaheuristics algorithms have also been recently applied by researchers to improve GA performance in many more applications (2015, Shi et al., 2017, Kuo and Han, 2011, Soleimani and Kannan, 2015). As we used the Global optimization toolbox of MATLAB 2015, only the required entries for running GA in MATLAB will be provided next. Figure 1 includes a sub-procedure of the proposed method embedded in GA.
Figure 1. Sub procedure of Monte-Carlo technique embedded in GA to calculate the objective function
4.2. Equivalent deterministic functions
Mean and variance of a random variable are two main measures frequently used for simplification in analysis. Several ideas have also been suggested by researchers to combine these measures into a single aggregative function (Hejazi et al., 2014, Hejazi et al., 2012, Díaz-García et al., 2005, Díaz-Díaz-García and Bashiri, 2014, Hejazi et al., 2013). In this work, we address three main ideas to tackle the uncertainty.
Standard Monte-Carlo method with the mean measure
1 1 n
ii
ii
TC tc
n
(20)This measure is very simple to calculate and used for variables with usual behavior. Further, it fails to consider variability/dispersion of the distribution.
Mean-variance measure
2
1
( )
1
ii n
ii
tc ATC
TC ATC z
n
where ATC and denote average tcii and percentile of a standard normal distribution function, respectively. In other words, Equation (21) calculates the upper bound of a one-sided confidence interval. Since ii
tc is a summation of several random variables, we assume that the central limit theorem could provide a good approximation by using standard normal distribution for the cases that a b, and x have not been normally distributed.
Since the sample variance term above is added, this measure is suitable for those experts who care about the dispersion around the mean value.
c) Percentile measure
[ ,P N]
TC
TC y (22)
where yTC[ ,P N] is an order statistic which estimates the th percentile of distribution function. also rounds its argument to the nearest integer value.
Where a degree of complexity increases or symmetry of the distribution is not assumed, it would be better to apply this measure. Of course, it needs more computational steps.
In the next section, a numerical example is analyzed by the proposed method to illustrate the benefits gained from the developed model as well as to provide useful results and associated analyses.
Again, it is worthy to note that the proposed method has the following main features that might be of interest for managers of intermediate level in inspection or quality assurance departments.
Optimal design of a double sampling method for multistage systems.
Finding optimal sample size and reject/accept limits in a double acceptance sampling.
Considering uncertainty in cost parameters by a probabilistic approach.
Applying measures beyond the mean value for analyzing the distribution of total cost functions.
Applying GA Toolbox in MATLAB to perform efficient computations.
Addressing inspection error in calculating the sampling performance measures.
5. Numerical Example
A numerical example is designed to be formulated by the proposed model and solved by GA. In order to evaluate effects of the stochastic parameters on the final value of the objective function, 25iterations are run. This model has been implemented in the optimization toolbox of MATLAB 2015b software package.
The parameters of a sequential three-stage process are shown in Table 2. Also, .
z (1)%
(1)%
p TC
.Table 2. Parameters used to design the numerical example Parameters Stages 1 Stages 2 Stages 3
10000 10000 10000
0.002 0.0005 0.0001
0.05 0.1 0.08
0.001 0.001 0.001
0.005 0.001 0.002
0.01 0.01 0.01
9000 9000 9000
Inspection cost 25 30 40
Replacement cost 33 40 70
Sampling cost 10 20 30
5.1. Deterministic GA for Double Sampling Design
Table 3 shows the settings of the operators used in the GA toolbox of MATLAB in the numerical example.
Table 3. Choice of GA setting for the numerical example
Setting* Choice
Mutation Constraint dependent
Selection Uniform
Cross-over Scattered
Population size 80
* Default settings have been chosen for the other ones.
To get a better performance of GA, we also set bounds for the decision variables as:
1 2 1 2
5n 100, 0n 500,1 c 10,1c 50.
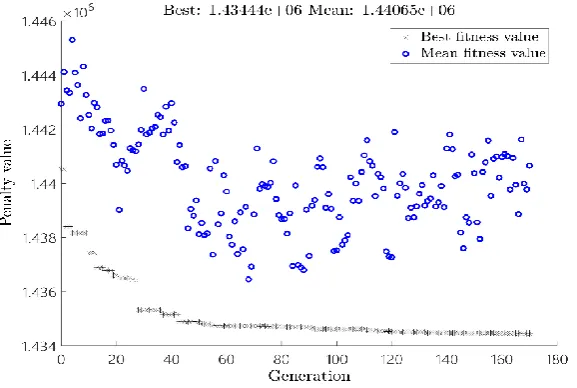
GA is used for the double sampling inspection problem and the value of the final objective function reached 1,434,444.Figure 2 shows how it converges during the optimization process.
Figure 2. Convergence of the GA for the numerical example
N 0 p
1 p
A B
* AOQ
Table 4. Design characterstics and their final values
Variable Stage1 Stage 2 Stage 3
(0.002, 0.0028) (0.0025, 0.0058) (0.0026, 0.0048)
(102.96,10017) (59.61,10603) (55.84, 10405)
(1, 0.0496) (1, 0.05) (1, 0.0499)
(92,1),(339,8) (59,2),(344, 25) (53,1),(142,5)
TC 1,434,444
As it is observed in Table 4, it is meaningful to take more samples from the beginning stages, since the cost components are at lower levels.
In order to make a comparison with the existing works, the GA has also been run for a single-sampling design with inspection error for multi-stage systems (Heredia-Langner et al., 2002). If the single sampling design is used instead of double sampling designs, then the total cost is 1,439,500 greater than double sampling output:
1 1 2 2 3 3
(( , ), (n c n c, ), (n c, )(151,3), (59, 2), (88,3)).
As mentioned before, the proposed approach considers the interrelation (dependency) across the stages. If we find an optimal design individually for each of the stages independent from each other, we will see that total cost increases due to the higher cost components at the last stage, which is probably the most important stage. Table 5 includes a detailed cost comparison between these two approaches.
Table 5. Cost-based comparison between the proposed and locally designed optimization approaches Replacement cost Inspection cost Sampling cost
Stage 1
Dependent 329182.19 2574.10 922.34
Independent 329175.50 2541.93 964.44
Stage 2
Dependent 397944.33 1788.45 1200.95
Independent 398193.15 1419.81 930.73
Stage 3
Dependent 697005.28 2233.57 1592.69
Independent 697841.76 3104.04 2280.05
Total Cost
Dependent 1434443.90 Independent 1436451.40
* Underlined values indicate the better approach.
Monte-Carlo based GA for uncertainty analysis
As mentioned before, the cost structure in the objective function is not easy to estimate precisely, so one might be interested to know how the uncertainties in cost parameters affect the results of optimization. For this purpose, three above-defined functions (Equations 20-22) are considered instead of Equation (12) and GA is run based on the procedure given before (see Figure 1). Also, a ±10% deviation, which is uniformly distributed around the point estimated values, is assumed for each cost component. Table 6 includes the optimal plan of acceptance sampling procedures for the three cases.
0 1
(AOQ ,AOQ ) 0 1 (ATI ,ATI )
0 1
,
a a
p p
Table 6. Optimal sampling design corresponding to the three objective functions
, Stages
First Second Third
Measures Mean (92,1),(339,8) (59,2),(344,25) (53,1),(134,5) Mean-variance (92,1),(330,8) (59,2),(344,25) (53,1),(135,5) Percentile (92,1),(446,10) (73,3),(346,26) (54,1),(251,14)
We observed that the solutions from the percentile measure are more conservative than the others, as it takes more sample items, especially in the secondary sampling.
Figure 3. Total cost average and its 3rd quartile at optimal values from each measure
Table 7. Total ATI and ASN values of all stages of operations for each measure
MEASURE Sum of ATI0 Sum of ATI1 Sum of ASN1 Mean 218.210 31022.327 205.426
Mean-variance 217.958 31021.740 205.493
Percentile 237.833 31037.104 221.560
Table 8. Final value of AOQs corresponded to the differenct quality levels
MEASURE STAGES AOQ0 AOQ1
MEAN
1 1.986e-03 2.837e-03
2 2.479e-03 5.802e-03
3 2.574e-03 4.851e-03
MEAN-VARIANCE
1 1.986e-03 2.841e-03
2 2.479e-03 5.801e-03
3 2.574e-03 4.849e-03
PERCENTILE
1 1.985e-03 2.826e-03
2 2.475e-03 5.704e-03
3 2.570e-03 4.806e-03
As it is observed from the results shown in Figure 3, Table 7, and Table 8, while the percentile based approach has higher ATIs and ASNs at all stages, better outgoing quality levels are ensured either at assumed value (𝑝0) or at the shifted one (𝑝1).
Accordingly, we can conclude some managerial insights from this study as follows.
Systems with experienced quality engineering departments are recommended to apply the double sampling method instead of single sampling to reduce total cost of sampling.
n1i, c1i
n2i, c2i
0 200000 400000 600000 800000 1000000 1200000 1400000
Mean Mean-variance Percentile
978680 978680 979370 1237400 1237400 1238300
An integrated sampling plan for all system stages is expected to lead to cost reduction in inspection operations as well as an improvement in outgoing quality levels.
The proposed decision making model is capable and flexible enough to consider different situations and conditions on quality levels associated with type I and type II errors.
Individual design of the acceptance sampling plan would result in combined errors or faulty items at the last stage of the operations.
Uncertainty in costs is allowed in the proposed approach and handled by a Monte-Carlo simulation technique to analyze gains and losses related to each solution.
6. Conclusion
The relationships between stages and the impact of variables should be considered in order to achieve global improvement in today's complex systems. In order to improve and control products and prevent the production of non-conforming items in the system, it is essential to study quality control methods in multi-stage systems. More complex products and systems are faced a larger set of failures. In such conditions, large amounts of investment would be required to establish flexible inspection systems. Applying double sampling designs reduces defective items in the system as a result of increased productivity and reduced costs. Therefore, this study aimed to find a plan for sampling and inspection operations so that the sampling, inspection, and replacement costs are minimized while the outgoing quality levels are satisfied in a multistage system.
Due to some avoidable sources of uncertainty especially in the cost component estimation, we tried to develop a GA with an embedded Monte-Carlo method to reach the optimal solution of the proposed integer nonlinear programming model.
The results showed that integrated modeling of such a system would result in a better design than local modeling of each stage. Further, the optimal double sampling plan will reduce total cost of the system. For further studies, the application of other meta-heuristic algorithms is suggested to reduce CPU time of the optimization. A more complex probability pattern for cost components can also be considered in the future to show the efficiency of the risk measure versus mean value optimization. Modeling systems with different flow materials including rework area would also be an interesting extension of the current study.
Funding
This work was supported by the Iran's National Elites Foundation [15/96595];
References
Azadeh, A., Sangari, M. S., and Amiri, A. S., (2012). "A Particle Swarm Algorithm for Inspection Optimization in Serial Multi-Stage Processes", Applied Mathematical Modelling, Vol. 36, pp. 1455-1464.
Azadeh, A., and Shamekhi Amiri, A., (2012). "A Particle Swarm Algorithm for Inspection Optimization in Serial Multi-Stage Processes", Applied Mathematical Modelling, Vol. 36, pp. 1455-1464.
Colledani, M., and Tolio, T., (2012). "Integrated Quality, Production Logistics and Maintenance Analysis of Multi-Stage Asynchronous Manufacturing Systems with Degrading Machines", Cirp Annals - Manufacturing Technology, Vol. 61, pp. 4.
Díaz-García, J. A. and Bashiri, M., (2014). "Multiple Response Optimisation: An Approach from Multi-Objective Stochastic Programming", Applied Mathematical Modelling, Vol. 38, pp. 2015-2027.
Díaz-García, J. A., Ramos-Quiroga, R., and Cabrera-Vicencio, E., (2005). "Stochastic Programming Methods in the Response Surface Methodology", Computational Statistics and Data Analysis, Vol. 49, pp. 837-848.
Engin, O., Çelik, A., and Kaya, İ., (2008). "A Fuzzy Approach to Define Sample Size for Attributes Control Chart in Multistage Processes: An Application in Engine Valve Manufacturing Process", Applied Soft Computing, Vol. 8, pp. 1654-1663.
Gao, Y., Yang, L., and Li, S., (2016). "Uncertain Models on Railway Transportation Planning Problem", Applied Mathematical Modelling, Vol. 40, pp. 4921-4934.
Hawkins, D. M., (1991). "Multivariate Quality Control Based On Regression-Adjusted Variables", Technometrics, Vol. 33, pp. 61-75.
Hejazi, T. H., Bashiri, M., Díaz-García, J. A., and Noghondarian, K., (2012). "Optimization of Probabilistic Multiple Response Surfaces", Applied Mathematical Modelling, Vol. 36, pp. 1275-1285.
Hejazi, T. H., Seyyed-Esfahani, M. and Badri, H., (2014). "Two-Stage Stochastic Programming Based on the Desirability Function to Optimize the Performance of an Internal-Combustion Engine", Proceedings of the Institution of Mechanical Engineers, Part D: Journal of Automobile Engineering, Vol.228, pp. 104-114.
Hejazi, T. H., Seyyed-Esfahani, M., and Mahootchi, M., (2013). "Quality Chain Design and Optimization by Multiple Response Surface Methodology", The International Journal of Advanced Manufacturing Technology, Vol. 68, pp. 881-893.
Hejazi, T. H., Seyyed-Esfahani, M., and Mahootchi, M., (2015). "Optimization of Degree of Conformance in Multiresponse-Multistage Systems with a Simulation-Based Metaheuristic", Quality and Reliability Engineering International, Vol. 31, pp. 645-658.
Heredia-Langner, A., Montgomery, D. C., and Carlyle, W. M., (2002). "Solving a Multistage Partial Inspection Problem Using Genetic Algorithms", International Journal Of Production Research, Vol. 40, pp. 1923-1940.
Hong, S., Wernz, C., and Stillinger, J. D., (2016). "Optimizing Maintenance Service Contracts Through Mechanism Design Theory", Applied Mathematical Modelling, Vol. 40, pp. 8849-8861.
Hubbard, D. W., (2014). How To Measure Anything: Finding The Value Of Intangibles In Business, John Wiley and Sons.
Kaya, (2009). "A Genetic Algorithm Approach to Determine the Sample Size for Attribute Control Chart", Information Sciences, Vol. 179, pp. 1552-1566.
Kaya, and Engin, (2007). "A New Approach To Define Sample Size Attributes Control Chart In Multistage Processes: An Application In Engine Piston Manufacturing Process", Journal of Materials Processing Technology, Vol. 183, pp. 38-48.
Kim, H., and Kim, P., (2017). "Reliability–Redundancy Allocation Problem Considering Optimal Redundancy Strategy Using Parallel Genetic Algorithm", Reliability Engineering and System Safety, Vol. 159, pp. 153-160.
Kuo, R. J., and Han, Y. S., (2011). "A Hybrid of Genetic Algorithm and Particle Swarm Optimization for Solving Bi-Level Linear Programming Problem – A Case Study On Supply Chain Model", Applied Mathematical Modelling, Vol. 35, pp. 3905-3917.
Lin, C. D., Anderson-Cook, C. M., Hamada, M. S., Moore, L. M., and Sitter, R. R., (2015). "Using Genetic Algorithms to Design Experiments: A Review", Quality And Reliability Engineering International, Vol. 31, pp. 155-167.
Lindsay, and Bishop, (1964). "Allocation of Screening Inspection Effort-Adynamic-Programming Approach", Management Science, Vol. 10, pp. 342-352.
Liu, X., Zheng, S., Feng, J., and Chen, T., (2015). "Reliability Reallocation for Fuel Cell Vehicles Based On Genetic Algorithm", Quality and Reliability Engineering International, Vol. 31, pp. 1495-1502.
Montgomery, D. C., (2009). Statistical Quality Control, Wiley New York.
Moura, M. D. C., Lins, I. D., Droguett, E. L., Soares, R. F., and Pascual, R., (2015). "A Multi-Objective Genetic Algorithm for Determining Efficient Risk-Based Inspection Programs", Reliability Engineering and System Safety, Vol. 133, pp. 253-265.
Rau, H., Cho, K., and Wang, Y., (2011). "Optimal Inspection Allocation for Workstations of Attribute Data with Multi-Characteristics in Multi-Station Systems", Engineering Materials, Vol. 450, pp. 397-400.
Rau, H., Cho, K. H., and Wang, Y. H., (2011). "Optimal Inspection Allocation for Workstations of Attribute Data with Multi-Characteristics in Multi-Station Systems", Key Engineering Materials, Vol. 450, pp. 397-400.
Aghaie, A., Fatemi Ghomi, S. M. T., and Jabari, S., (2014). "Economic Design of Exponentially Weighted Moving Average Control Chart Based On Measurement Error Using Genetic Algorithm", Quality and Reliability Engineering International, Vol. 30, pp. 1153-1163.
Sarhangian, V., Vaghefi, A., Eskandari, H., and Ardakani, M. K., (2008). "Optimizing Inspection Strategies for Multi-Stage Manufacturing Processes Using Simulation Optimization", 2008 Winter Simulation Conference, 7-10 Dec. 2008, pp. 1974-1980.
Shi, J., Liu, Z., Tang, L., and Xiong, J., (2017). "Multi-Objective Optimization For A Closed-Loop Network Design Problem Using An Improved Genetic Algorithm", Applied Mathematical Modelling, Vol. 45, pp. 14-30.
Shi, J., and Zhou, S., (2009). "Quality Control and Improvement for Multistage Systems: A Survey", Iie Transactions (Institute Of Industrial Engineers), Vol. 41, pp. 744-753.
Soleimani, H. and Kannan, G., (2015). "A Hybrid Particle Swarm Optimization and Genetic Algorithm for Closed-Loop Supply Chain Network Design In Large-Scale Networks", Applied Mathematical Modelling, Vol. 39, pp. 3990-4012.
Wang, K., and Chenxu, D., (2014). "A Mixed-Effect Model for Analyzing Experiments with Multistage Processes", Quality Technology and Quantitative Management, Vol.11, pp. 491-511.
Williams, W. W., and Peters, M. H., (1989). "Economic Design of an Attributes Control System for a Multistage Serial Production Process", International Journal of Production Research, Vol. 27, pp. 1269-1286.
Xiang, L., and Tsung, F., (2008). "Statistical Monitoring Of Multi-Stage Processes Based On Engineering Models", Iie Transactions (Institute Of Industrial Engineers), Vol. 40, pp. 957-970.
Yum, B. J., and Mcdowellj, E. D., (2007). "Optimal Inspection Policies in A Serial Production System Including Scrap Rework And Repair: An MILP Approach", International Journal of Production Research, Vol. 25, pp. 1451-1464.
Zantek, P. F., Wright, G. P., and Plante, R. D., (2002). "Process and Product Improvement in Manufacturing Systems with Correlated Stages", Management Science, Vol. 48, pp. 591-606.
Zhang, X., Huang, S., and Wan, Z., (2016). "Optimal Pricing and Ordering In Global Supply Chain Management With Constraints Under Random Demand", Applied Mathematical Modelling, Vol. 40, pp. 10105-10130.
Zhou, S., Huang, Q., and Shi, J., (2003). "State Space Modeling Of Dimensional Variation Propagation in Multistage Machining Process Using Differential Motion Vectors", IEEE Transactions On Robotics And Automation, Vol. 19, pp. 296-309.
Zhu, H., Zhang, C., and Deng, Y., (2016). "Optimisation Design of Attribute Control Charts For Multi-Station Manufacturing System Subjected To Quality Shifts", International Journal of Production Research, Vol. 54, pp. 1804-1821.
This article can be cited: Hejazi T.H., and Roozkhosh, P., (2019). "Partial inspection problem with double sampling designs in multi-stage systems considering cost uncertainty", Journal of Industrial Engineering and Management Studies, Vol. 6, No. 1, pp. 1-17.