http://www.sciencepublishinggroup.com/j/ijefm doi: 10.11648/j.ijefm.20180603.15
ISSN: 2326-9553 (Print); ISSN: 2326-9561 (Online)
Research on Ordering Strategy of Perishable Products with
Variable Demand
Feng Wei
School of Management and Economics, University of Electronic Science and Technology of China, Chengdu, China
Email address:
To cite this article:
Feng Wei. Research on Ordering Strategy of Perishable Products with Variable Demand. International Journal of Economics, Finance and Management Sciences. Vol. 6, No. 3, 2018, pp. 104-109. doi: 10.11648/j.ijefm.20180603.15
Received: April 8, 2018; Accepted: May 12, 2018; Published: June 20, 2018
Abstract:
This paper mainly considers the influence of price on demand for perishable products. According to the characteristics of products and the condition of demand, demand is a function of price elasticity. Under the premise of allowing the shortage, this study constructs optimal inventory control model of perishable products by introducing the lost order coefficient and solves the model, improves the traditional inventory model. Using optimization method, which deduces the optimal ordering cycle, the optimal order quantity and the total inventory cost, etc. Through the example for the deterioration rate and service level to sensitivity analysis, the results show that as deterioration rate increases, the total inventory cost and sale price are on the rise, while the unit profit is decreasing; The service level is directly proportional to the selling price, inversely proportional to the total inventory cost and unit profit. This research provides a theoretical basis for firms in the efficient inventory management.Keywords:
Perishable Products, Demand Depends on Price, Inventory Model, Sensitivity Analysis1. Introduction
Perishable products can decay, damage, volatilize, expire or devalue over time, gradually lose their economic value. These products fall into two main categories [1]: One is the product that gradually changes its physical properties over time and loses its economic value. Such as fruit, alcohol, food, medicine and radioactive substances. The other is the product those application changes over time and loses its economic value. Such as electronics, clothing, books and software. If the inventory is insufficient, it will not satisfy the customer’s demand, which will lead to the loss of goods and damage the reputation of the enterprise; on the other hand, if there is too much inventory, it will not only take up a lot of liquidity, but also reduce the value of the inventory [2]. Since the 1950s, many scholars are devoted to the study of the inventory of perishable goods [3-10].
In the study of deterioration rate, Whitin first studied the outdated issues of fashion items’ inventory in 1957. After that, Ghare and Schrader (1963) put forward the inventory model of perishable products based on Whitin’s research. Papachristos and Skouri [11] established the inventory control model of perishable goods by using constant metamorphism.
Goswani (1991) considered the inventory control model of perishable goods with linear time-varying rate of deterioration. Abad (2000) studied some characteristics of perishable products. S. Mukhopadhyay et al. (2004) studied the inventory model of perishable goods with order quantities and joint pricing. They set up the linear function of the deterioration rate in compliance with time.
valuable conclusions, have a certain gap with actual application. In fact, enterprises are facing a changeable market environment, and the demand is also dynamic.
In the study of whether to allow out of stock, Moon, Giri et al. (2005) considered the delay rate of the inventory, i.e. the waiting time for replenishment of goods from the beginning of the shortage to the next cycle. Wang X [14], Jianxiong Zhang
[15], Yi yan Qin [16] took into consideration random order
advance period, revenue sharing, joint pricing and establishment of inventory control model.
In summary, scholars have studied the inventory model of perishable goods in influencing factors and variable selection, but lacked of systematic research on the inventory model of price impact demand. Based on the theory of price impact demand, this paper selects the corresponding variables to construct the inventory model of perishable goods, and applies the model to the inventory management of perishable goods in a supermarket. Unreasonable inventory restricts the rapid development of enterprises. It provides reference for managers to manage inventory effectively.
2. Model Formulation and Assumptions
The theory of elasticity is an important theory of microeconomics, which was first proposed by the 19th century French economist Cournot and developed into a complete theory by Marshall. After the 20th century, British economist Arthur Cecil Pigou, American economist Moore and schultz used this theory in practice to estimate the elasticity of demand for certain goods.
This paper examines the inventory issue of a single product. The demand is affected by price fluctuations and customer traffic restrictions, and a model is established based on this. The study analyzes the changes of the orderer’s cost, the changes of the parameters in the inventory model, and the sensitivity analysis of the main parameters under conditions that do not allow out-of-stock, and obtain the optimal ordering cycle, optimal order quantity, and minimum inventory costs. By example, corresponding countermeasures are proposed for parameters that significantly affect the cost, so that the enterprise managers can effectively manage the inventory of perishable products and minimize the loss, which highlights the practicability and reference value of the model.
In order to discuss convenience, this model makes the following assumptions: (1) The order time of the orderer is zero, that is, the instantaneous replenishment; (2) The deterioration rate is fixed, which is a constant. The deterioration occurs only after the commodity has entered the inventory. (3) Allow out of stock.
The inventory strategy for making perishable products, demand needs to be taken into account. In reality, the demand function obeys the elastic function of price according to the demand theory of microeconomics. Then D=m x−n ,
0 , 0
m > n ≥ ,
x
represents sales price, m represents customer size,n
represents demand price elasticity.Based on the theory of price impact demand, this paper
constructs the inventory model of perishable products with the goal of minimizing inventory cost and maximizing profit. The relevant parameters are shown in the following table 1:
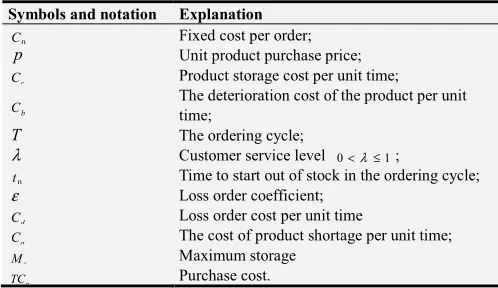
Table 1. Symbols and notation.
Symbols and notation Explanation
0
C Fixed cost per order;
p Unit product purchase price;
c
C Product storage cost per unit time;
b
C The deterioration cost of the product per unit time;
T The ordering cycle;
λ Customer service level 0<λ≤1; 0
t Time to start out of stock in the ordering cycle;
ε Loss order coefficient;
d
C Loss order cost per unit time
q
C The cost of product shortage per unit time;
c
M Maximum storage
g
TC Purchase cost.
3. The Model of Perishable Products
3.1. Demand Is the Price Elasticity Function
( )
d
I t represents inventory levels at time t,
( ) ( ) dI t
I t D
dt +θ = − 0≤ ≤t T
The inventory model satisfies the following differential equations:
0
0
( ) 0 ( ) (1 ) n d d n
mx I t t t
dI t
dt mx t t T
θ ε − − − − ≤ ≤ = − − ≤ ≤
(1)
And the boundary conditions
0
( ) 0
d
I t = (2)
Joint (1) and (2), by integral, get the solution:
0 ( ) 0 0 0 1 0 ( )
(1 ) ( )
n t t
d
n
mx
e t t
I t
mx t t t t T
θ θ ε − − − − ≤ ≤ = − − − ≤ ≤ (3)
The storage cost TCc:
0 0
0 0
1
( ) ( 1)
n
t t
c c d
mx
TC C I t dt eθ t
θ θ
−
=
∫
= − − (4)The deterioration cost TCb:
0 0 0 0 1 1 ( ) ( )
t n t
b d
TC pθ I t dt pmx eθ t
θ θ
−
=
∫
= − − (5)The cost of product shortage TCq:
[
]
0
2 0
( ) (1 )( )
2 n
T q
q q t d
C mx
TC C I t dt ε T t
−
=
∫
− = − − (6)Loss order cost TCd:
0
( )
n
d d
Therefore, the total inventory cost TCh:
1
( )
h o c b q d
TC C TC TC TC TC
T
= + + + + (8)
Purchase cost TCg:
0 (0) ( 1) n t c d g
pM pI mx
TC p e
T T T
θ θ
−
= = = − (9)
Due to the short replenishment cycle of perishable products, Taylor’s expansion omit θ3 and the following items and result in small errors, which can be ignored. That is:
0 2
0 0
1
1 ( )
2 t
eθ ≈ +θt + θt
λ
represents customer service level, so t0=λT It is known by (8) and (9)Inventory cost: 2 2 2 n n o c
p h g
C T C mx
TC TC TC p Tmx
T
λ − θ λ
−
= + = + +
2
(1 )(1 ) (1 )
2
n
q n n
d
C mx
T C mx pmx
ε λ ε λ λ
−
− −
+ − − + − + (10)
Sales revenue:
n
TR=xmx− (11)
Profits:
2
2 2
n
n o c n
p
C T C mx
TR TC xmx p Tmx
T
λ
π= − = − − − − −θ λ −
2
(1 )(1 ) (1 ) 2
n
q n n
d
C mx
T C mx pmx
ε λ ε λ λ
−
− −
− − − − − − (12)
In order to maximize profits, enterprises must determine the optimal order period and order quantity, so as to achieve the best equilibrium of inventory cost and profit.
3.2. Optimal Order Cycle and Optimal Order Quantity
According to the property of the derivative, the derivative of equation (12) is available:
2 2 2
2
1
(1 )(1 )
2 2 n q n n o c C mx C
Cmx p mx T T
π λ θ λ − ε λ
− −
∂ = − − − − −
∂ (13)
2 2 3 2 0 o C T T π ∂ = − ≤
∂ (14)
Formula (14) shows that, according to the property of the derivative and the convexity theorem of the function curve, the total profit function π=f T( ) in the unit time is the convex function.
For a given p and
x
, the optimal order cycle can beobtained by partial derivative 0 T
π ∂ =
∂ .
By formula (13), the optimal order cycle can be obtained:
*
2 2 2
2
2 (1 )(1 )
o
n n n
c q
C T
C mx p mx C mx
λ − θ λ − − ε λ
=
+ + − − (15)
Substituting formula (15) into (3) can obtain the optimal order quantity: * * ( 1) n T mx
Q eθλ
θ
−
= − (16)
After getting the optimal sale price
x
, the optimal order cycle and order quantity need to be obtained. Further calculation:The first step, substituting equation (15) into (12)can calculate the total profit function of unit time in the optimal order cycle:
2 2 2
5
2 2 (1 )(1 )
2
n n
o c q
xmx C mx C p C
π= − − − λ + θ λ + −ε −λ
(1 ) n n
d
C m x pm x
ε λ − λ −
− − − (17)
The second step, this profit function takes the partial derivative for
x
, which makes it zero, 0x
π ∂ =
∂ , so:
(1 )
(1 n) n Cd pn mxn
x x
ε λ λ
π − + −
∂
= − +
∂
2 2 2
5
2 2 (1 )(1 ) 0
4
n
o c q
n
C C p C mx
x λ θ λ ε λ
−
+ + + − − = (18)
This formula is a function of selling price, when m and n take the determined value, the optimal price can be obtained.
The third step, after obtaining the optimal price
x
, the optimal order cycle *T and optimal order quantity * Q can
be obtained by substituting in (15) and (16).
4. The Example Analysis
An agricultural product distribution center is a specialized distribution center integrating vegetables and grain oil. The center has established a long-term relationship with retailers such as supermarket chains. [5] The center is responsible for the distribution of fresh vegetables in several branches of a large supermarket chain. The data of the case came from recent transaction of the distribution center and the supermarket chain, and the transaction data of vegetables were discussed in a certain month. This case analyzes the model of commodity inventory control when the supermarket is allowed out of stock, The value of each parameter is investigated. [6]:Cq = $ 2 / kg, C0 = $ 30, Cc =
$5/kg*month,
p
=$ 3 / kg,Cd = $ 2 / month,ε =0.1,λ=0.10,λ=0.8.
According to past experience, the demand rate of chain supermarket obeys the elasticity function of price.
2 32000
D= x− . Thus, the function relation between price and
provides some references for the decision makers of large supermarket chains.
4.1. Sensitivity Analysis of the Deterioration Rate
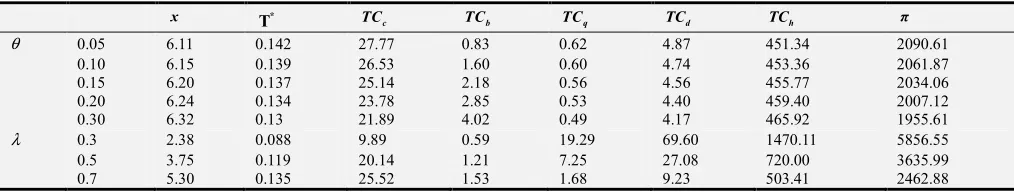
The parameter values are substituted into the model. For the convenience of calculation, Matlab9.1 is used to perform the operation of the relevant model to obtain the optimal solution. Set λ=0.8, to analyze the influence of each cost when the deterioration rate θ of perishable product is different, this paper keeps the other parameters in the model unchanged, only changes the value of deterioration rate θ, and gets the change of the cost and the optimal order period in the system. Table 2 is the calculation results of cost.
As shown in table 2, with the increase of deterioration rate, the total inventory cost and the optimal selling price of supermarkets show a continuous upward trend. However, the profit per unit time decreases slowly with the increase of deterioration rate, and further increases continuously in the shortage cost. The deterioration rate increases, the cost of deterioration increases naturally and gradually, if the purchase quantity is large, this part of the cost can not be ignored. However, making the deterioration rate smaller will result in increase of the corresponding cost of keeping the technology fresh and the cost of management, so not the smaller the better.
The order cycle is smaller and the turnover rate increases more steadily. Therefore, shorten the order cycle to accelerate the turnover rate, reduce the cost of management, technology and other costs, and help to reduce the loss caused by deterioration. By observing, when λ=0.05,
T
=0.142; whenλ=0.3,
T
=0.13,T
reduced by 8.5%. It is explained that because of the loss of commodities, supermarkets should try to shorten the order cycle and speed up the circulation of fresh produces. This shows that the effect of different deterioration rate on the cost and profit of supermarket chain is very obvious.Obviously, an increase in sale prices leads to a decrease in profits from table 2. The fluctuation of price will affect the business sales profit and the consumption ability of price-sensitive consumers. In addition, an increase in the rate of deterioration leads to a decrease in demand, which is negative correlation. Total inventory costs are rising, and businesses need to take effective measures to reduce perishable rates to expand sales. Some reasonable suggestions should be considered. For example, seal the fresh product with plastic wrap. The product packaging a layer of plastic wrap can slow the deterioration of fresh products. It adopts the refrigeration technology such as high pressure
preservation and ventilation storage, improve refrigeration facilities and enhance storage capacity. Improve the cold chain logistics system, the transportation process should be “cold” enough so as to reduce loss and improve the cold chain logistics system. Negotiate with suppliers to shorten the order cycle to increase the turnover rate of goods, which can reduce the deterioration loss and reduce unnecessary expenses. The local government shall ensure the quality and safety of fresh products and ensure the supply of fresh products. As the necessities of daily life, fresh agricultural products such as fruits and vegetables should reduce the loss in circulation, improve the cold chain logistics of agricultural products. Procurement management is the first link in the circulation of commodities and is very crucial. Reasonable purchase quantity can not only guarantee the demand of consumers, but also accelerate inventory turnover and reduce deterioration.
4.2. Sensitivity Analysis of Customer Service Level
Keep the other parameters in the model unchanged, only change the value of the customer service level λ, and get the change of the cost and optimal order cycle of the system. The relevant costs were calculated by Matlab9.1 and then compared and analyzed. Set θ =0.1,ε =0.1.
It is easy to see from table 2 that the price of a product increases gradually as the customer service level increases. When λ=0.3, it only sells $ 2.38, but when λ=0.9, the selling price rises to $7.07, which means that the increase is obvious. This shows that the service level has a significant impact on the price, and further affects the customer’s demand. As the order cycle gradually becomes larger, it can be seen that order quantity will be reduced and the ordering cost will be saved. The total inventory cost of supermarkets is decrease [7], so the improvement of service level is beneficial to the reduction of total inventory cost. However, the profit per unit time of supermarkets showed an accelerating downward trend with the increase in service level, from $5,856.55 when λ=0.3 to $1,739.24 when
0.9
λ= , and the profit decreased by 70.3%. However, loss of order cost and shortage cost will gradually reduce, which is conducive to improve customer satisfaction and maintain the reputation of the enterprise. To improve customer service levels, businesses typically store a certain amount of safety inventory, but it will increase the storage cost. The average total profit of retailer will also decrease with the increase of
λ, and the policy makers should find the best balance between reasonable profit and customer satisfaction.
Table 2. Sensitivity analysis.
x T *
c
TC TCb TCq TCd TCh π
θ 0.05 6.11 0.142 27.77 0.83 0.62 4.87 451.34 2090.61
0.10 6.15 0.139 26.53 1.60 0.60 4.74 453.36 2061.87
0.15 6.20 0.137 25.14 2.18 0.56 4.56 455.77 2034.06
0.20 6.24 0.134 23.78 2.85 0.53 4.40 459.40 2007.12
0.30 6.32 0.13 21.89 4.02 0.49 4.17 465.92 1955.61
λ 0.3 2.38 0.088 9.89 0.59 19.29 69.60 1470.11 5856.55
0.5 3.75 0.119 20.14 1.21 7.25 27.08 720.00 3635.99
x *
T TCc TCb TCq TCd TCh π
0.8 6.15 0.139 26.53 1.60 0.60 4.74 453.36 2061.87
0.9 7.07 0.143 26.63 1.60 0.12 1.83 420.84 1739.24
Through investigation, the agricultural product distribution center and the chain supermarket business transaction data is obtained. The demand of the consumer is 102.8kg, and the supermarket orders with a fixed quantity at every time, the order quantity is 85kg, and the inventory cost is $74.
Using inventory model of perishable products, when
0.1
θ = ,ε =0.1,λ =0 .8. By the calculation, optimal order cycle is: *
0.139
T = . The optimal order quantity is:
*
*
* ( 1) 94.61
n T c
m x
Q e
T
θλ
θ
−
= − = . The total inventory cost (T Ch)
of the retailer is $63.02.
Compared with the above inventory model, the order quantity of the supermarket is 85kg each time. Some shortages will occur, which will reduce the profit. After applying the model, the order quantity is 94.61kg, which basically meets customer demand. Although the out-of-stock costs will be incurred when the stock is allowed to be out of stock, the total inventory cost will decrease, and the average total profit increased and there was a lot of room for improvement.
According to the relationship between sale price and demand, as the price rises, the demand decreases gradually, thus the profit of the retailer reduce. The consistent practice of retailer is that attracting customers with fresh products at low prices to drive sales of high-profit goods. How to improve service level? Highlighting the characteristics of commodity, brand management is a common strategy in marketing. Improve every detail in the service, enhance the service consciousness, standardize management of internal process, find the internal bottleneck accurately and eliminate it in time, and implement “humanization” management. Enterprises should pay attention to customer feedback information, establish good reputation. In addition, due to the market demand information asymmetry, it is necessary to consider the market price fluctuation and adjust the price reasonably to achieve the expected goal. This research provides a decision-making support so as to improve performance for firms in a dynamic market environment.
5. Conclusion
This article comprehensively uses literature analysis, investigation method, quantitative and qualitative research methods, experience summary methods, and combines with storage theory, optimization method and other related knowledge for exploratory research, derive ordering strategy of perishable products with variable demand. On the basis of previous research, in view of the perishable product’s supply demand conditions, this paper establishes the inventory control model of the elasticity function of demand, and optimizes the cost of each part of the model to make it more practical. When the demand is subject to the price elasticity function and it is allowed to be out of stock, the inventory model of perishable products is constructed and solved. For
the market demand conditions of perishable products, the decreasing relationship between demand and price, under the condition of allowing out-of-stock, the inventory model is constructed by introducing the loss order coefficient (ε). In the process of solving, the partial derivative property and the convexity theorem of the function curve are used to obtain the optimal order cycle ( *
T ) of orderer, which is related to the service level (λ) and the loss order coefficient (ε). Then the optimal order quantity ( *
Q ) and sales price (x*) in the
cycle are obtained. According to this, the storage cost, the cost of deterioration, the cost of the shortage, the cost of loss order, the total inventory cost and the total profit (π) are calculated. As case above, the sensitivity analysis of the two important parameters of service level (λ) and deterioration rate (θ ) was carried out, and the influence degree of each cost is discussed. But the point should be pay attention to is that the service level is not the higher the better, but it exists satisfied service level (λ*). The firm should mainly consider the change of demand, determine satisfied service level (λ*) according to the market demand, so as to maintain the cost advantage. This model provides a theoretical basis for enterprise managers to manage their inventory effectively and plays a supporting role in the company’s operational decision-making.
Acknowledgements
Support was provided by the National Natural Science Foundation of China (No. 71472026). Thanks to the Institute of Logistics and Supply Chain Management for the framework of the article.
References
[1] Bai QG, Xu XH, Chen MY, Luo Q. A. two-echelon supply chain coordination for deteriorating item with a multi-variable continuous demand function. 1rd ed., vol. 2. International Journal of Systems Science: Operations & Logistics 2015, pp. 49-62. [2] Taniya S, Santanu K. An economic production quantity model
for items with time proportional deterioration under permissible delay in payments. 3rd ed., vol. 5. International Journal Mathematics in Operational Research 2013, pp. 23-31. [3] Tal Avinadav, Avi Hebon, Uriel Spiegel. Optimal inventory policy for a perishable item with demand function sensitive to price and time. 2rd ed., vol. 144. International Journal Mathematics in Operational Research 2013, pp. 497-506. [4] Cetinkaya. S, Chung-Yee Le. Stock Replenishment and
Shipment Scheduling for Vendor-managed Inventory Systems. 2rd ed., vol. 46. Management Science 2000, pp. 217-232. [5] Panda S., Modak, N. M., Snas, S. S. Pricing and
[6] Zhang J. X., Wang Y., Lu L. H. Optimal dynamic pricing and replenishment cycle for non-instantaneous deteriorating items. vol. 170. International Journal of Production Economics 2015, pp. 136-145.
[7] Jian Holmstorm, Implementing Vendor-Managed-Inventory the Efficient way: A case Study of Partnership in the Supply Chain. 3rd ed., vol. 39. Production and Inventory Management Journal 1998, pp. 1-5.
[8] Herbon, Avi. A non-cooperative game model for managing a multiple-aged expiring inventory under
consumers’heterogeneity to price and time. 6rd ed., vol. 51. Applied Mathematical Modelling 2017, pp. 38-57.
[9] Teng, J. T., Yang, H. L. On an EOQ model for deteriorating items with time-varying demand and partial backlogging. 4rd ed., vol. 54. Journal of the Operational Research Society 2003, pp. 432-436.
[10] Chang, C. T. An EOQ model with deteriorating items under inflation when supplier credits linked to order quantity. 3rd ed., vol. 88. International Journal of Production Economics 2004, pp. 307-316.
[11] S. Papachristos, K. Skouri. An inventory model with deteriorating items quantity discount, pricing and time-dependent partial backlogging. 3rd ed., vol. 83.
International Journal of Production Economics 2003, pp. 247-256.
[12] L. W. G. Strijbosch, J. J. A. Moors. The impact of unknown demand parameters on (R, S)-inventory control performance. 3rd ed., vol. 162. European Journal of Operational Research 2005, pp. 805-815.
[13] M. J. G. Dominey, R. M. Hill. Performance of approximations for compound Poisson distributed demand in the newsboy problem. 2rd ed., vol. 92. International Journal of Production Economics 2004, pp. 145-155.
[14] Wang X, Disney S M. Mitigating variance amplification under stochastic lead-time: The proportional control approach. 1rd ed., vol. 256. European Journal of Operational Research 2017, pp. 151-162.
[15] Jianxiong Zhang, Guowei Liu, Qiao Zhang, Zhenyu Bai. Coordinating a supply chain for deteriorating items with a revenue sharing and cooperative investment contract. vol. 56. Omega 2015, pp. 37-49.