http://www.sciencepublishinggroup.com/j/ogce doi: 10.11648/j.ogce.20180601.13
ISSN: 2376-7669(Print); ISSN: 2376-7677(Online)
Effect of CTAB Concentration on Foam Properties and
Discussion Based on Liquid Content and Bubble Size in the
Foam
Junchao Wang
1, Yijun Cao
2, *, Guosheng Li
1, *, Lijun Deng
1, Shulei Li
11School of Chemical Engineering and Technology, China University of Mining and Technology, Xuzhou, China
2
Chinese National Engineering Research Center of Coal Preparation and Purification, China University of Mining and Technology, Xuzhou, China
Email address:
*
Corresponding author
To cite this article:
Junchao Wang, Yijun Cao, Guosheng Li, Lijun Deng, Shulei Li. Effect of CTAB Concentration on Foam Properties and Discussion Based on Liquid Content and Bubble Size in the Foam. International Journal of Oil, Gas and Coal Engineering. Vol. 6, No. 1, 2018, pp. 18-24. doi: 10.11648/j.ogce.20180601.13
Received: December 15, 2017; Accepted: January 15, 2018; Published: January 24, 2018
Abstract:
Surfactants known as frothers are widely used in froth flotation to produce small bubbles and stabilize the froth, meanwhile, froth stability plays an important role in determining the product grade and recovery achieved from a mineral flotation process, and therefore it is of great significance to study the effect of surfactant on foam properties. However, foam properties, especially foam stability concerning liquid content of foam and evolution of bubble size, in flotation has received little attention. In this study, we intensively investigated the foamability and foam stability of different concentration cetyltrimethylammonium bromide (CTAB) solutions. Experiments were carried out using a commercially available instrument, Foam Scan, which determined simultaneously the foaming time, foam volume, the liquid content of foam and bubble size distribution. Particularly, the evolution of bubble size can be allowed to determine at a regular time interval. The results showed that as an increase in CTAB concentration, the foamability continuously increased till reached a constant at a critical micelle concentration (CMC), however, the foam stability initially increased and then presented a little decrease when the tested concentrations were larger than its CMC. An argument based on foam drainage, bubble coalescence and coarsening processes is proposed to account for the effect of CTAB concentration foam properties.Keywords:
CTAB, Foam Properties, Foam Stability, Liquid Content of Foam, Bubble Size Distribution1. Introduction
Foam stabilized by surfactant, is a two–phase system consisting of gas bubbles separated by three–dimensional water channels where the liquid constantly drains and the water film between the bubbles thins [1–4], which can be encountered in many engineering applications such as mineral flotation, dust control, tertiary oil recovery, food industry, wastewater treatment, firefighting, personal care products, and so forth [5–8]. Surfactants known as frothers are used in froth flotation to produce small bubbles, reduce bubble rise velocity, and stabilize the froth, which together enhance the efficiency
of flotation [9–13].
Over the past decades, many methods have been proposed to test and evaluate the foam performance of frother. These methods can be classified as traditional methods and modern
methods. The traditional methods consist of Waring–Blender
method, Bikerman method [14], and Ross–Miles method [15]
simple and convenient, but the results are not accurate. In addition, the traditional methods only focus on the foam volume or foam height (foamability) and foam lifetime (foam stability), and neglect other important foam properties, such as the evolution of bubble size and liquid content of foam. The modern methods (e.g., Foam Scan method) also have many limitations due to their complicated device and high test cost [18], but it is crucially important for higher accuracy and detailed information of the various experiments which will be helpful to achieve a deeper research on foam properties.
Foam properties are generally characterized by foamability (as known as foam capacity) and foam stability. The foamability is defined as the ability of a given foaming solution to produce foam and evaluated as either the foam volume (foam height) formed in a period of time or the foaming time (foam retention time) taken to form a desired foam volume [4, 19–20]. The foam stability is usually evaluated as the foam lifetime. It is well known that the interfacial properties, such as surface tension, surface dilatational viscosity and surface elasticity, have a significantly important effect on foam properties, the presence of surfactants in foams especially. Many previous works have studied that the effect of the type and concentration of surfactant on interfacial properties [21–22] and foam properties [23–28], and shown that surfactant could modify considerably the gas–liquid interfacial properties and change the flow type inside the foam’s liquid network. Consequently, the foam drainage rate is largely changed. However, most works study the effect of surfactant on foam properties either in
foam systems that maintain their initial bubbles size during drainage or/and neglect the evolution of bubbles size [21–22, 29–30]. Fortunately, Magrabi et al. [31] have payed attention to the above issues and concluded that in their particular system, foam destabilization takes place at three stages: initially (< 200s) drainage dominates over coarsening, later (200–900s) drainage and coarsening occur concurrently and eventually (> 900s) coarsening prevails over drainage. However, the above work does not take into account the effect of the type or/and surfactant concentration on the interaction between drainage, coarsening and bubbles coalescence due to the limitation of the test system. In this study, we investigated the effect of CTAB concentration on foamability (i.e., foaming time) and foam stability (i.e., the evolution of liquid content of foam (drainage process) and evolution of bubble size (bubble coalescence and coarsening processes) using the modern foam performance testing method, Foam Scan method.
2. Experimental
2.1. Materials
Cetyltrimethylammonium bromide (> 99%, AR), a cationic surfactant, purchased from Sinopharm Chemical Reagent Co., Ltd (in China). Molecular structure of the surfactant Cetyltrimethylammonium bromide (CTAB) is shown in Figure 1.
Figure 1. Molecular structure of the surfactant Cetyltrimethylammonium bromide (CTAB).
In all experiments, CTAB solutions were prepared using
ultra–pure water. The water was obtained by purification with
a Milli–Q system, which consisted of a pre–filter, a carbon
cartridge, two mixed–bed ion exchange cartridges and an
ultra–filtration cartridge. Its surface tension was 72.8±0.1
mN/m with a specific conductivity not exceeding 1×10⁻⁶ S/cm.
All glassware were rinsed with HNO3, soaked in 4 mol/L
NaOH at 40–50°C for 30 s and rinsed with Milli–Q water,
followed by steam cleaning and drying in a clean oven. Each surfactant solution was equilibrated for at least 2 h before use. All measurements were conducted in a constant temperature room, maintained at 25±1°C.
2.2. Surface Properties of the Surfactant Solutions
The surface tension of the foaming solutions was measured by the Wilhelmy plate method [32], which employed the interaction of a small platinum plate with the surface of the surfactant solution. Surfactant solution was placed in a beaker on a mechanical stage. The stage was raised to bring the surfactant solution surface into contact with the plate attaching to a force–measuring sensor. The movement was immediately
stopped when the plate had come into contact with the solution surface and the plate remained at the same position during the course of the experiment. The wetting force was monitored with time. No changes in the force reading were observed after 3 min and these values were assumed to be equilibrium.
2.3. Foam Properties of the Surfactant Solutions
To study the foamability and foam stability of all tested surfactant solutions, we used a commercially available instrument, Foam Scan, with which foamability (foaming time, taken to produce a fixed foam volume), foam stability (foam volume, liquid content of foam and bubble size distribution as a function of time) can be determined. Briefly, foam is produced in a round glass column (inner diameter 35
mm) by sparging N2 gas through a fixed volume (60 mL) of
the surfactant solution via a porous glass disc (pore size 14–60 µm and thickness 3 mm). The gas flow rate is set and adjusted varying from 100 to 1000 mL/min to find out the optimum experimental conditions. A gas flow rate of 200 mL/min turned out to be a good choice and was used for all measurements. This flow rate allowed for a balance between N
C H
3 CH2 CH
2 CH
2 CH
2 CH
2 CH
2 CH
2 CH
2 CH 2 CH
3
CH 3
CH 2 CH
2 CH
2 CH 2
CH 2 CH
2 CH
3 Br
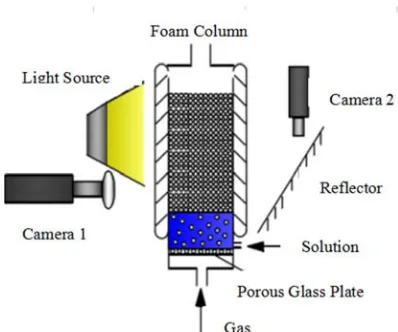
foam generation and foam destruction during foam (at too high gas flow rates significant shear forces act on the foam, which may lead to foam destruction during foam generation, while too low gas flow rates foam generation and destruction take place at similar time scales). The gas flow stopped automatically when the system had reached the preset foam volume. To ensure the accuracy of results, each experiment must be repeated at least two times and on an average. The operation schematic of Foam Scan is shown in Figure 2.
Figure 2. Operation schematic of Foam Scan.
2.4. Bubble Size Distribution
Note that this section mainly focuses on studying the effect of surfactant concentration on foam stability, therefore, the photographs of foam phase belong to the foam decay process. The bubble images in the foam phase were captured using a CCD camera 1, which was connected to a computer where the visual information was stored and processed. The images captured during the foam decay were automatically processed using cellsize analysis software of TECLIS. Bubble images of all tested surfactant solutions were captured and analyzed. Each measurement was repeated at least two times and on an average, over 500 bubbles were measured in each run.
3. Results and Discussion
3.1. Equilibrium Surface Tension
Figure 3. Equilibrium surface tension as a function of CTAB concentration.
The equilibrium surface tension as a function of CTAB concentration is shown in Figure 3. The error bars at each data point stand for the standard deviation from two repetitions. It clearly shows that the surface tension initially decreases with increasing CTAB concentration as CTAB molecules adsorb at
the air–solution interface, then reaches a stable region when
the tested concentrations exceed to a critical micelle concentration (CMC) which results in a break point in the curve and a plateau. The CMC of CTAB, about 0.9 mmol/L, is determined by the graphical method here is in agreement with the reported in the literature [33–34].
3.2. Foamability
Foaming time as a function of CTAB concentration is shown in Figure 4. The error bars at each data point stand for the standard deviation from two repetitions. Here, the foamability was evaluated as the foaming time taken to form a fixed foam volume, 200 mL, and all foams were produced at 200 mL/min. Figure 4 shows that the foaming time continuously decreases with increasing CTAB concentration, then reaches a minimum value at CMC and keeps a constant when the tested concentrations are larger than the CMC of CTAB.
Figure 4. Foaming time as a function of CTAB concentration.
Having in mind that small foaming times correspond to high foamability for forming a fixed foam volume in a certain foaming solution. As foamability depends on both the adsorbed amount of surfactant and the rate of transport of the surfactant to the air–solution interface [35]. The foaming time decreases with an increase in surfactant concentration indicates an increase in the amount of adsorbed surfactant molecule at the gas–solution interface. In other words, the foamability of CTAB solutions continues to increase until a critical micelle concentration (CMC) is reached at which the transport rate is high enough to allow for the formation of a densely packed layer in the foaming process.
3.3. Foam Stability
Foam stability is usually evaluated as the foam lifetime, which can be monitored by the evolution of liquid content of 35
40 45 50 55 60 65 70 75
10-2
10-3
10-4
10-5
10-6
10-7
S
u
rf
a
c
e
ten
si
o
n
,
m
N
/m
Concentration, mol/L
CMC
0.0 0.5 1.0 1.5 2.0
38 40 42 44 46 48 50 52 54 56 58
F
o
a
m
in
g
ti
m
e
,
s
foam as a function of time. There are three different mechanisms governing the lifetime of foam: (i) foam drainage (liquid drains out of the foam mainly through Plateau Borders and nodes under gravity), (ii) coarsening (enlargement of large bubbles by gas diffusion from smaller adjacent bubbles induced by the capillary pressure differences) and (iii) bubble coalescence (merging of neighboring bubbles due to the
rupture of the liquid films between them) [36–37]. Based on
above theory, we studied and analyzed the evolution of foam volume, the evolution of liquid content of foam (drainage process) and evolution of bubble size (bubble coalescence and coarsening processes) to explain the influence of CTAB concentration on foam stability.
3.3.1. Evolution of Foam Volume
Foam volume as a function of time with various CTAB concentrations at the range from 0.09 mmol/L to 1.80 mmol/L is shown in Figure 5. It is note worthy that the initial foam volume, 200 mL, is a fixed foam volume in this study. The figures clearly show that foam volume decreases with increasing time for all tested CTAB solutions, and the foam
volume decrease rate of low concentration solutions (c < 0.45
mmol/L) are faster than that of high concentration solutions. Moreover, there is a little decrease in foam volume when solution concentrations exceed the CMC.
Figure 5. Foam volume as a function of time for various CTAB concentrations (c = 0.09, 0.18, 0.36, 0.45, 0.90 and 1.80 mmol/L). A total foam volume of 200 mL was produced at a gas flow rate of 200 mL/min.
a)
b)
c)
d)
e)
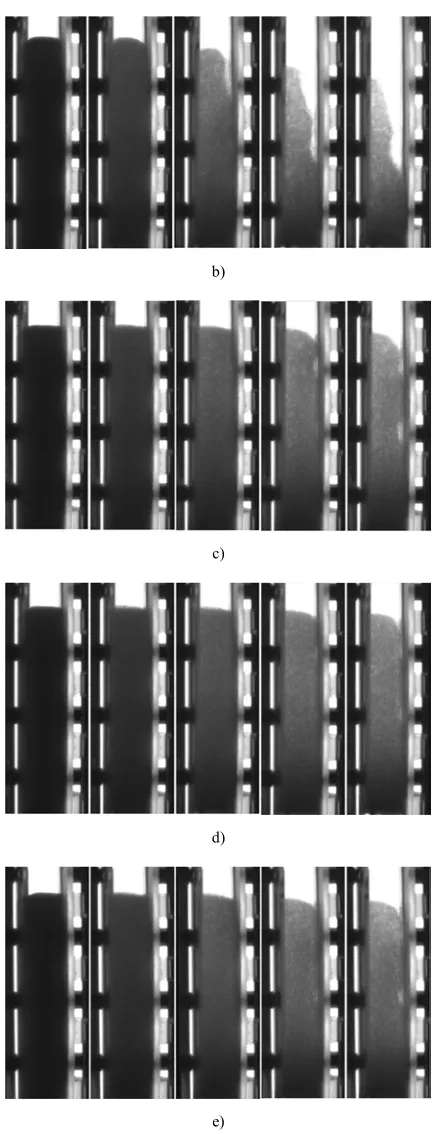
Figure 6. Observation by CCD camera 1 of the decay process of foams stabilized for various CTAB concentrations within 1800 s. A total foam volume of 200 mL was produced at a gas flow rate of 200 mL/min. a) 0.09 mmol/L (within 600 s), b) 0.45 mmol/L, c) 0.90 mmol/L, d) 1.35 mmol/L and e) 1.80 mmol/L.
Figure 6 shows the foam decay process for various concentration CTAB solutions within 1800 s using CCD camera 1 in which the change of foam height represents the evolution of foam volume. Obviously, foam volume continuously decreases with an increase in time. It is
0 100 200 300 400 500 600 700 800
0 40 80 120 160 200
F
o
a
m
v
o
lu
m
e
,
m
L
Time, s
interesting that the higher the CTAB concentration, the stronger the foam stability. In a word, the foam stability in this study is mainly dependent on surfactant concentration, however, this effect does not scale linearly with surfactant concentration.
3.3.2. Evolution of Liquid Content of Foam
Liquid content of foam as a function of time for various CTAB
concentrations (c = 0.09, 0.18, 0.36, 0.45, 0.90 and 1.80 mmol/L)
is shown in Figure 7. Figures clearly show that the liquid content of foam continuously decreases with increasing time for all tested CTAB solutions. Apparently, the foams produced with high
concentration solutions (c > 0.45 mmol/L) have more liquid and
become more stable compared with the foams generated with low concentration solutions. This behavior also can be seen from Figure 6, in which the degree of darkness indicates the liquid content of foam (the darker the picture the more liquid the foam contains). In addition, there is a little decrease in liquid volume of foam when solution concentrations exceed the CMC as shown in Figure 7.
Figure 7. Liquid content of foam as a function of time for various CTAB concentrations (c = 0.09, 0.18, 0.36, 0.45, 0.90 and 1.80 mmol/L). A foam volume of 200 mL was produced at a gas flow rate of 200 mL/min.
It also can be seen from Figure 7 that the liquid content of foam decreases quickly at the beginning of drainage process, which can be attributed to the redistribution of the liquid content along the foam column [30, 38], then become slow. The evolution trend of the liquid content of foam can be seen as the outcome of the combination of two causes [39]: (i) the reduction of liquid content due to drainage, (ii) the increase of bubble size due to coarsening and coalescence. The resistance of affecting liquid flow depends on the cross–sectional area of Plateau Border (PB). on the one hand, if the number of PB can be as a constant, the decrease of liquid content of foam will result in a decrease of PB’ s cross sections and, therefore, the decrease rate of liquid content of foam becomes slow. On the other hand, if the liquid content of foam can be as a constant, the reduction of the number of bubble because of coalescence and coarsening will result in a decrease of PB number and an increase of their cross–sectional area. Eventually, the decrease rate of liquid content of foam becomes very fast.
3.3.3. Evolution of Bubble Size
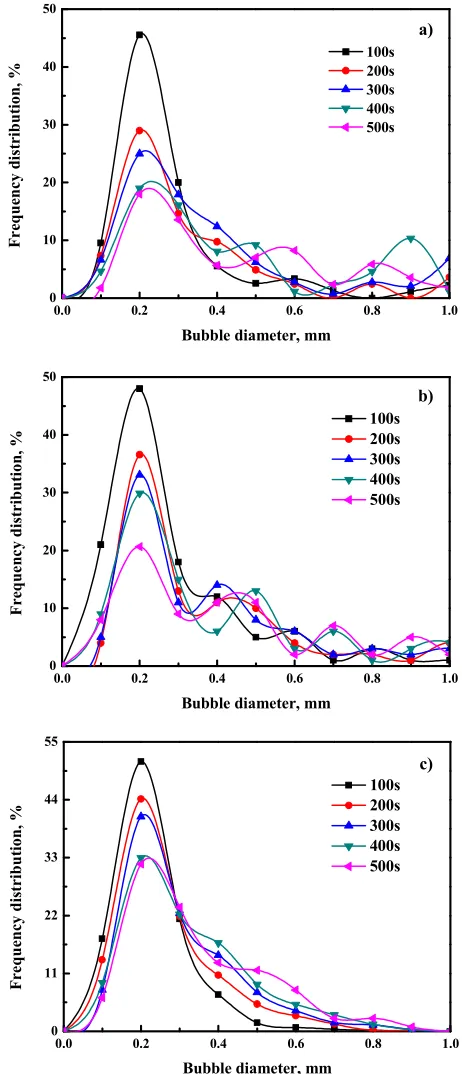
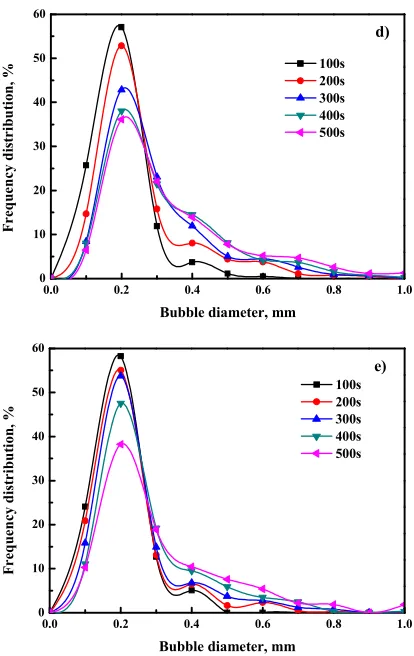
Bubble size distribution as a function of time for various CTAB concentrations is shown in Figure 8. Note that this section aims to study the evolution of bubble size during foam decay process. Figure 8 shows that bubble size mainly focuses on 0.1~0.3 mm and increases with an increase in time for all tested concentrations, which may be attributed to bubble coalescence and coarsening processes. Moreover, the small bubbles belonging to 0.1~0.3 mm increase with increasing surfactant concentration, but it seems to be no change when
the tested concentrations exceed CMC (Figure 8–d, e at 500 s).
0 100 200 300 400 500 600 700 800
0 10 20 30 40 50 L iqui d c o nt e nt o f fo a m , m L 0.09mmol/L 0.18mmol/L 0.36mmol/L 0.45mmol/L 0.90mmol/L 1.80mmol/L Time, s
0.0 0.2 0.4 0.6 0.8 1.0
0 10 20 30 40 50 F r eq u en c y d is tr ib u ti o n , %
Bubble diameter, mm 100s 200s 300s 400s 500s a)
0.0 0.2 0.4 0.6 0.8 1.0
0 10 20 30 40 50 b) F re q u e n c y d is tr ib u ti o n , %
Bubble diameter, mm
100s 200s 300s 400s 500s
0.0 0.2 0.4 0.6 0.8 1.0
0 11 22 33 44 55 F re q u en cy d is tr ib u ti o n , %
Bubble diameter, mm
Figure 8. Bubble size distribution as a function of time for various CTAB concentrations: a) 0.09 mmol/L, b) 0.18 mmol/L, c) 0.45 mmol/L, d) 0.90 mmol/L and e) 1.80 mmol/L.
As we all know, surfactants called as frothers can reduce bubble size by preventing bubble coalescence [40]. Moreover, the stronger the surface activity of surfactant and the higher its concentration, especially below its critical coalescence concentration (CCC) [41–43], the stronger the prevention effect. At low concentrations, the evolution of bubble size may be significantly attributed to bubble coalescence during foam destabilization [44]. In addition, some studies also have shown that the evolution of bubble size is caused by coarsening. Because the range of bubble size is considerately wide result in occurring both coalescence and coarsening processes. At high
concentrations (c > CMC), however, bubble coalescence is
significantly prevented and bubbles almost remain the equal size, meanwhile, coarsening process must be also weakened because the capillary pressure difference of adjacent bubbles decreases with decreasing difference of neighboring bubble size. All in all, the evolution of bubble size in a foam system can be attributed to both coalescence and coarsening processes.
4. Conclusion
The objective of this study is to investigate the effect of CTAB concentration on foam properties and bubble size. First of all, we studied the effect of CTAB concentration on foamability. The data shows that the foamability of CTAB depends on the amount of adsorbed surfactant molecule at the air–solution interface, that
is, foamability increases with an increase in surfactant concentration. In addition, there is a limitation in the increase of foamability with concentration when the tested surfactant concentrations exceed its CMC. Secondly, we studied the change of foam stability, based on the evolution of foam volume, the liquid content of foam and bubble size, with CTAB concentration. The results show that foam stability mainly depends on surfactant concentration, but this effect does not scale linearly with surfactant concentration. Besides, there is a little decrease when CTAB concentrations exceed its CMC. In this study, we realize that drainage process determines the liquid content of foam. However, the evolution of liquid content of foam also is affected by bubble coalescence and coarsening processes through bubble size. Therefore, it is essential to study the interaction between foam drainage, bubble coalescence and coarsening processes when studying the effect of surfactant on foam properties.
Acknowledgements
This research was supported by the National Nature Science Foundation of China (51574240; 51504254) and the Fundamental Research Funds for the Central Universities of China (2015XKMS039) for which the authors express their appreciation.
References
[1] R. P. King, Principles of Flotation, South african, 1982.
[2] A. Saintjalmes and D. Langevin, Time evolution of aqueous foams: drainage and coarsening, J. Phys. Condens. Matter, 2002, 14 (40), 9397–9412.
[3] S. N. Tan, D. Fornasiero, R. Sedev and J. Ralston, Marangoni effects in aqueous polypropylene glycol foams, Journal of Colloid and Interface Science, 2005, 286 (2), 719–729.
[4] S. N. Tan, D. Fornasiero, R. Sedev and J. Ralston. The role of surfactant structure on foam behaviour, Colloids and Surfaces A: Physicochem. Eng. Aspects, 2005, 263 (1–3), 233–238.
[5] Y. Xing, X. Gui, L. Pan, B. Pinchasik, Y. Cao, J. Liu, M Kappl and H Butt. Recent experimental advances for understanding bubble-particle attachment in flotation. Advances in Colloid and Interface Science, 2017, 246, 105–132.
[6] L. G. Wang and R. H. Yoon, Effects of surface forces and film elasticity on foam stability, Int. J. Miner. Process, 2008, 85 (4), 101–110.
[7] G. Bournival, Z. Du, S. Ata and G. J. Jameson, Foaming and gas dispersion properties of non-ionic surfactants in the presence of an inorganic electrolyte, Chemical Engineering Science, 2004, 116, 536–546.
[8] D. Kosior, J. Zawala and K. Malysa, Influence of n-octanol on the bubble impact velocity, bouncing and the three phase contact formation at hydrophobic solid surface, Colloids and Surfaces A: Physicochem. Eng. Aspects, 2014, 441 (3), 788–795.
[9] K. Hadle, N. Barbian and J. J. Cilliers, The relationship between froth stability and flotation performance down a bank of cells, In: Jameson, G. J., Yoon, R. H. (Eds.), Proceedings Centenary of Flotation Symposium. Aus IMM, 2005, 516–523.
0.0 0.2 0.4 0.6 0.8 1.0
0 10 20 30 40 50 60
F
r
e
q
u
e
n
c
y
d
is
tr
ib
u
ti
o
n
,
%
Bubble diameter, mm
100s 200s 300s 400s 500s
d)
0.0 0.2 0.4 0.6 0.8 1.0
0 10 20 30 40 50 60
e)
F
r
e
q
u
e
n
c
y
d
is
tr
ib
u
ti
on
,
%
Bubble diameter, mm
[10] F. Melo and J. S. Laskowski, Fundamental properties of flotation frothers and their effect on flotation, Minerals Engineering, 2006 (6-8), 19, 766–773.
[11] J. A. Finch, S. Gelinas and P. Moyo, Frother-related research at mcgill university, Minerals Engineering, 2006, 19 (6), 726– 733.
[12] P. Stevenson, Hydrodynamic theory of rising foams, Minerals Engineering, 2007, 20 (3), 282–289.
[13] B. A. Wills and J. A. Finch, Chapter 12–Froth Flotation, Wills Mineral Processing Technology, 2016, 265–380.
[14] J. J. Bikerman, Formation and Structure, Foams. Springer Berlin Heidelberg, 1973, 33–64.
[15] T. Tamura, Y. Kaneko and M. Ohyama, Dynamic surface tension and foaming properties of aqueous polyoxyethylene n– dodecyl ether solutions, J. Colloid Interface Sci., 1995, 173 (2), 493–499.
[16] S. A. Koehler, S. Hilgenfeldt and H. A. Stone, Foam drainage on the microscale II. modeling flow through single plateau borders, Journal of Colloid & Interface Science, 2004, 276 (2), 439–449.
[17] E. Carey and C. Stubenrauch, Foaming properties of mixtures of a non–ionic (C12DMPO) and an ionic surfactant (C12TAB), Journal of Colloid and Interface Science, 2010, 343 (1), 314–323.
[18] Y. L. GU, Q. M. FENG, L. M. OU and P. C. LÜ, A new method of testing frother performance, Trans. Nonferrous Met. Soc. China, 2013, 23 9), 2776–2780.
[19] S. N. Tan, D. Fornasiero, R. Sedev and J. Ralston, The interfacial conformation of polypropylene glycols and foam behaviour, Colloid and Surfaces A, 2004, 250 (1–3), 307–315.
[20] S. N. Tan, A. Jiang, J. J. Liau, S. R. Grano and R. G. Horn, The surface dilational viscosity of Polypropylene glycol solutions and its influence on water flow and foam behavior, Int. J. Miner. Process, 2009, 93 (2), 194–203.
[21] N. D. Denkov, S. Tcholakova, K. Golemanov, K. P. Ananthpad–manabhan and A. Lips, The role of surfactant type and bubble surface mobility in foam rheology, Soft Matter, 2009, 5 (18), 3389–3408.
[22] P. Stevenson, Foam Engineering: Fundamentals and Applications, John Wiley& Sons, Ltd., New York, NY, 2012.
[23] B. S. Murray, Stabilization of bubbles and foams, Current Opinion in Colloid & Interface Science, 2007, 12 (4–5), 232–241.
[24] M. Simjoo, T. Rezaei, A. Andrianov and P. L. J. Zitha, Foam stability in the presence of oil: Effect of surfactant concentration and oil type, Colloids and Surfaces A: Physicochem. Eng. Aspects, 2013, 438 (45), 174–185.
[25] R. Petkova, S. Tcholakova and N. D. Denkov. Role of polymer–surfactant interactions in foams: Effects of pH and surfactant head group for cationic polyvinylamine and anionic surfactants, Colloids and Surfaces A: Physicochem. Eng. Aspects, 2013, 438, 174–185.
[26] A. Britan, M. Liverts, G. Ben-Dor, S. A. Koehler and N. Bennani, The effect of fine particles on the drainage and coarsening of foam, Colloids and Surfaces A: Physicochem. Eng. Aspects, 2009, 344 (1), 15–23.
[27] N. Louvet, F. Rouyer and O. Pitois, Ripening of a draining
foam bubble, Journal of Colloid and Interface Science, 2009, 334 (1), 82–86.
[28] K. Malysa and K. Lunkenheimer. Foams under dynamic conditions, Current Opinion in Colloid & Interface Science, 2008, 13 (3), 150–162.
[29] A. Cervantes–Martínez, A. Saint–Jalmes, A. Maldonado and D. Langevin, Effect of cosurfactant on the freedrainage regime of aqueous foams, J. Colloid Interface Sci., 2005, 292 (2), 544– 547.
[30] J. Boos, W. Drenckhan and C. Stubenrauch, Protocol for studying aqueous foams stabilized by surfactant mixtures, J. Surfactants Deterg., 2012, 16 (1), 1–12.
[31] S. A. Magrabi, B. Z. Dlugogorski and G. J. Jameson, Free drainage in aqueous foams: model and experimental study, AICh E J., 2001, 47 (2), 314–327.
[32] A. W. Adamson and A. P. Gast, Physical Chemistry of Surfaces, sixth ed. John Wiley & Sons, Inc., New York, 1997.
[33] C. Stubenrauch, V. B. Fainerman, E. V. Aksenenko and R. Miller, Adsorption behavior and dilational rheology of the cationic alkyl trimethylammonium bromides at the water/air interface, J. Phys. Chem., 2005, B 109 (4), 1505–1509.
[34] T. N. Le, C. M. Phan, A. V. Nguyen and H. M. Ang, An unusual synergistic adsorption of MIBC and CTAB mixtures at the air/water interface, Minerals Engineering, 2012, 39 (6), 255– 261.
[35] R. J. Pugh, Foaming, foam films, antifoaming and defoaming, Advances in Colloid & Interface Science, 1996, 64 (95):67–142.
[36] I. Cantat, S. Cohen–Addad, F. Elias, F. Graner, R. Höhler and O. Pitois, et al., Foams: structure and dynamics, Dissertations & Theses – Gradworks, 2013, 424 (4–5):175–308.
[37] J. L. Wang, A. V. Nguyen and S. Farrokhpay, A critical review of the growth, drainage and collapse of foams, Advances in Colloid and Interface Science, 2016, 228, 55–70.
[38] P. Grassia, S. J. Neethling, C. Cervantes, H. T. Lee, The growth, drainage and bursting of foams, Colloids and Surfaces A: Physicochem. Eng. Aspects, 2006, 274, 110–124.
[39] J. S. Lioumbas, E. Georgiou, K. Kostoglou and T. D. Karapantsios, Foam free drainage and bubbles size for surfactant concentrations below the CMC, Colloids and Surfaces A: Physicochem. Eng. Aspects, 2015, 487, 92–103.
[40] F. Melo and J. S. Laskowski, Fundamental properties of flotation frothers and their effect on flotation, Minerals Engineering, 2006, 19 (6–8), 766–773.
[41] Y. S. Cho and J. S. Laskowski, Effect of flotation frothers on bubble size and foam stability, Int. J. Miner. Process, 2002, 64 (2–3), 69–80.
[42] Y. S. Cho and J. S. Laskowski, Bubble coalescence and its effect on dynamic foamability, Can. J. Chem. Eng., 2006, 80, 299–305.
[43] R. A. Grau, J. S. Laskowski and K. Heiskanen, Effect of frothers on bubble size, Int. J. Miner. Process, 2005, 76 (4), 225–233.