Dr. P.S.S Akilashri et al, International Journal of Computer Science and Mobile Applications, Vol.4 Issue. 4, April- 2016, pg. 20-27 ISSN: 2321-8363
Impact Factor: 4.123
©2016, IJCSMA All Rights Reserved, www.ijcsma.com 20
EFFICIENT SEGMENTATION
METHOD FOR TEXTURED
IMAGES BY USING SVD
Dr. P.S.S Akilashri
M.C.A, M. Phil., Ph.D.,Head, Dept of Computer Science, National College, Trichy, [email protected]
Abstract
This Work entitled as ―Efficient Segmentation method for textured images by using SVD‖ developed by using Matlab R2010a as front end and Windows 7/8 – 32 Bit OS as back end. In this paper various modules and techniques are implemented to improve the texture analysis such as Input image representation, Linear combination method, Segmentation with non – negative constraints, Illustration of Smoothing effect, Comparison between various methods of texture representation and also the graphical representation of the scattered plots. This paper introduces a factorizati on-based approach that efficiently segments textured images. We use local spectral histograms as features, and construct an M × N feature matrix using M -dimensional feature vectors in an N -pixel image. Based on the observation each feature can be approximated by a linear combination of several representative features, factor the feature matrix into two matrices—one consisting of the representative features and the other containing the weights of representative features at each pixel used for linear combination. The factorization method is based on singular value decomposition and nonnegative matrix factorization. The method uses local spectral histograms to discriminate region appearances in a computationally efficient way and at the same time accurately localizes region boundaries. The experiments conducted on public segmentation data sets show the promise of this simple yet powerful approach.
Keywords: Matrix factorization, texture segmentation, spectral histogram.
1. Introduction
Image segmentation S. Alpert et al [13] is a critical task for a wide range of applications including autonomous robots, remote sensing, and medical imaging. This work focus on segmentation of textured images, which partitions an image into a number of regions with similar texture appearance. As segmentation serves as an initial step for higher level image analysis tasks, such as recognition and classification, it aims to develop segmentation algorithms with low computational complexity. In addition, it does not use object-specific or scene-specific knowledge, which are typically not available. Texture segmentation J. Malik et al [9] literature addresses two main issues: 1) finding an image model that defines region homogeneity, and 2) designing a strategy for producing segments. These two issues should not be treated independently. A successful segmentation methodology generally couples a good image model with an effective segmentation strategy.
A broad family of texture segmentation approaches is to extract features from local image patches and then feed them to general clustering or segmentation algorithms. Various features are designed to characterize texture appearance.
Dr. P.S.S Akilashri et al, International Journal of Computer Science and Mobile Applications, Vol.4 Issue. 4, April- 2016, pg. 20-27 ISSN: 2321-8363
Impact Factor: 4.123
©2016, IJCSMA All Rights Reserved, www.ijcsma.com 21 Many widely used segmentation approaches, e.g., graph partitioning, curve evolution, and mean shift, heavily rely on measuring the distance among local features, and thus applying them to the texture J. Mao et al [3] descriptors requires a high computational cost for distance calculation. Moreover, it is always a thorny issue to select a proper distance measure for a high-dimensional space. Although dimensionality reduction techniques can be utilized, whether a technique is suitable for a feature often lacks theoretical justification. The second problem is attributed to the texture descriptors generated from the image windows across boundaries. Such windows generate uncharacteristic features, which causes difficulty in accurately localizing region boundaries. In order to address this problem, quadrant filters and other similar strategies are often employed, which compute features from shifted local windows around a pixel. Another popular technique is to use local windows of different sizes, also referred to as scales. Boundaries are then determined by analyzing information across scales. Despite their success, these methods are ad hoc to some extent (e.g., using a discrete set of shifts), or require additional computation to analyze multiscale information. In such situations, it would be desirable to find a segmentation approach that can utilize the texture Dr. Martin et al [5] descriptors to discriminate region appearances in a computationally efficient way and at the same time accurately localize region boundaries. This paper is categorized as five sections. The first section is introduction. The second section is Methodology. The third section is Data Flow Diagram followed by the fourth section is results and discussions and fifth section is implementation and ends with conclusion.
2. Methodology
2.1. Input image representation
Input image representation is done for the various types of input images in the file format such as jpg, bmp, gif, tif, png Dr. Martin et al [5].
2.2. Linear combination method
A linear combination of representative features, the rank of the feature matrix Y should be equal to the rank of Z. However, due to image noise, the matrix Y tends to be full rank. Hence, the noise-free feature matrix should be a matrix that has the rank equal to the number of representative features. It regards the feature at each pixel as a linear combination of representative features, which encodes a natural criterion to identify boundaries. By extending the above analysis, the feature of each pixel can be regarded as the linear combination of all the representative features weighted by the corresponding area coverage. In the case when a window is completely within one region, the weight of the representative feature for that region is close to one, while the other weights are close to zero.
2.3. Segmentation with non-negative constraints
Dr. P.S.S Akilashri et al, International Journal of Computer Science and Mobile Applications, Vol.4 Issue. 4, April- 2016, pg. 20-27 ISSN: 2321-8363
Impact Factor: 4.123
©2016, IJCSMA All Rights Reserved, www.ijcsma.com 22 Figure : 2(a),(b)
2.3.1. SVD (Singular Value Decomposition)
Singular Value Decomposition has two wonderful properties that make it very helpful and important for our work. First, it exists for any and all matrices: large, small, square, rectangular, singular, non-singular, sparse and dense. So, no matter what kind of term by document matrix the internet yields, it has single value decomposition.
s= svd (A) returns the singular values of matrix A in descending order.
[U,S,V] = svd (A) performs a singular value decomposition of matrix A, such that A = U*S*V'. [U,S,V] = svd (A,'econ') produces an economy-size decomposition of m-by-n matrix A: m > n — Only the first n columns of U are computed, and S is n-by-n.
m = n — svd (A,'econ') is equivalent to svd(A).
m < n — Only the first m columns of V are computed, and S is m-by-m. [U,S,V] = svd (A,0) produces a different economy-size decomposition of m-by-n matrix A:
Dr. P.S.S Akilashri et al, International Journal of Computer Science and Mobile Applications, Vol.4 Issue. 4, April- 2016, pg. 20-27 ISSN: 2321-8363
Impact Factor: 4.123
©2016, IJCSMA All Rights Reserved, www.ijcsma.com 23
Figure: 2(c)Various image representations by using the threshold level marking by SVD decomposition methods
2.4. Illustration of Smoothing effect:
The choice of integration scales has a direct effect on segmentation results. Specifically, as the integration scale increases, the proposed method produces smoother boundaries. To illustrate such an effect, it shows an image containing jagged boundaries in Fig. 4(a), where a square window is used to compute a local feature. According to the coverage of the two regions within the window, the proposed method segments the corresponding pixel (the dot) into the darker region, as shown in Fig. 4(b). With the integration scale sufficiently large, it obtains a segmentation result shown in Fig. 4(c), where the boundary is close to a straight line.
2.5. Texture & Comparison Method:
A novel and efficient texture-based method for modeling the background and detecting moving objects from a video sequence. Each pixel is modeled as a group of adaptive local binary pattern histograms that are calculated over a circular region around the pixel. The approach provides many advantages compared to the state-of-the-art. Experimental results clearly justify our model.
2.6. Graphical Representation Method:
It needs a co-ordinate system to describe an image, the co-ordinate system used to place elements in relation to each other is called user space, since this is the co-ordinates the user uses to define elements and position them in relation to each other. The co-ordinate system used for all examples in this document has the origin in the upper left, with the x axis extending to the right and y axis extending downwards.
2.7. Non negative segmentation method with sampling:
Sandler and Lindenbaum propose a segmentation method based on non-negative matrix factorization D. Comaniciu et al [12]. In this method, an image is divided into small tiles, and the histograms of all the tiles comprise the original matrix. Under this formulation, segmentation is performed based on tiles, and thus additional efforts are required to refine boundaries. Apart from a very different factorization algorithm, the factored matrices in their method cannot directly yield accurate segmentation, and anisotropic diffusion is performed to obtain final results. As reported in D.Comaniciu et al [12], their method gives a GFM score of 0.55 on the BSD and has a fairly high computational cost (it takes minutes to obtain a useful factorization for a small matrix of size 32×256). Compared with their method, the proposed method gives better results with higher efficiency.
Dr. P.S.S Akilashri et al, International Journal of Computer Science and Mobile Applications, Vol.4 Issue. 4, April- 2016, pg. 20-27 ISSN: 2321-8363
Impact Factor: 4.123
©2016, IJCSMA All Rights Reserved, www.ijcsma.com 24 foranyandallmatrices: large, small, square, rectangular, singular, non-singular, sparse and dense. So, no matter what kind of term by document matrix the internet yields, it has singular value decomposition. The next helpful property is the optimality property. This property basically tells that, how to find a rank-k approximation of the matrix, the best one can be found using singular value decomposition.
For identifying Sobel Operator is applied
The Sobel operator performs a 2-D spatial gradient measurement on an image and so emphasizes regions of high spatial frequency that correspond to edges. Typically it is used to find the approximate absolute gradient magnitude at each point in an input grayscale image.
Gaussian Filter is used to blur the image. It is used to reduce the noise and the image details. A white noise signal (process) is constituted by a set of independent and identically distributed (i.i.d) random variables. In discrete sense, the white noise signal constitutes a series of samples that are independent and generated from the same probability distribution.
3. DATA FLOW DIAGRAM
Testing is an integral part of developing quality software. To guide software development and monitor for regressions in code functionality, it can write unit tests for the programs. To measure the time it takes for code (or tests) to run, it uses performance tests.
Script-Based Unit Tests: Write and run test scripts
Function-Based Unit Tests: Write tests using qualifications; customize test runner; select and run tests Class-Based Unit Tests: Write class-based tests; parameterize tests; apply fixtures; select and run tests Performance Testing Framework: Measure performance of MATLAB code
4. RESULTS & DISCUSSION
Dr. P.S.S Akilashri et al, International Journal of Computer Science and Mobile Applications, Vol.4 Issue. 4, April- 2016, pg. 20-27 ISSN: 2321-8363
Impact Factor: 4.123
©2016, IJCSMA All Rights Reserved, www.ijcsma.com 25 decomposition rule of histograms on boundaries is not utilized, to mitigate the boundary localization problem the method uses a small local window, which causes the difficulty in dealing with large texture.
5. IMPLEMENTATION
5.1 TABLE STRUCTURE
Table5.1: Table Structure shows the random factorization method that is applied for the mxn matrix variations
Figure 5.1: Input image representation by using data base verification
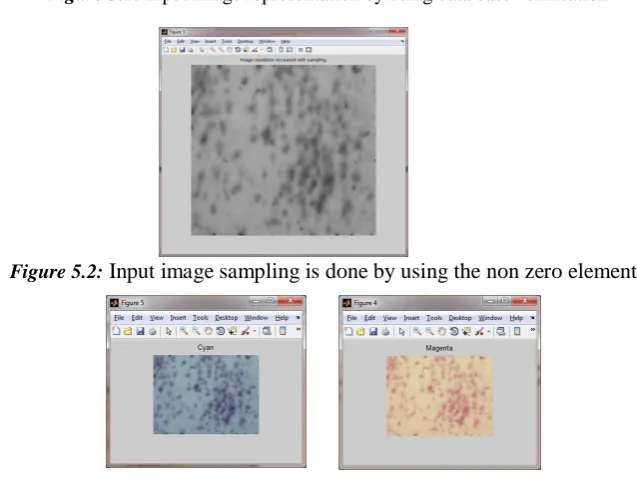
Figure 5.2: Input image sampling is done by using the non zero elements
Dr. P.S.S Akilashri et al, International Journal of Computer Science and Mobile Applications, Vol.4 Issue. 4, April- 2016, pg. 20-27 ISSN: 2321-8363
Impact Factor: 4.123
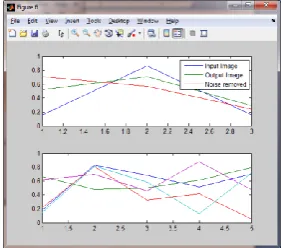
©2016, IJCSMA All Rights Reserved, www.ijcsma.com 26 Figure 5.4: Graphical representation is done for the input, Output & Noise removed images.
6. CONCLUSION
This Paper have presented a simple and intuitive, yet powerful method for segmenting textured [9] images. Using local spectral histograms as features, it frames the segmentation problem as a matrix factorization task. An efficient algorithm is proposed to produce factored matrices that give meaningful segmentation. The experiments demonstrate that the proposed method performs consistently well on different datasets.
The proposed method extends the RS method. The feature sub-space analysis and the factorization method result in significant improvements over the RS method. More importantly, this paper explicitly relates segmentation to matrix factorization, more specifically to non-negative matrix factorization. This important connection makes it possible to leverage extensively studied factorization techniques for improving segmentation results or adapting the method for specific tasks.
7. FUTURE ENHANCEMENTS
This work compares the proposed method with algorithms that report leading performance on this dataset, including the Texel-based Segmentation algorithm (TS), Segmentation by Weighted Aggregation (SWA), Gaussian MRF Model (GMRF), 3D Auto Regressive Model (AR3D), Texture Fragmentation and Reconstruction (TFR), and its enhanced version (TFR+). Their accuracy scores are given. It also includes a recent method, the voting representativeness -Priority Multi-Class Flooding Algorithm (PMCFA), which reports the state-of-the-art performance. 3 In addition, it compares with the Regression-based Segmentation algorithm (RS), which builds on the same image model.
REFERENCES:
[1] A. K. Jain and F. Farrokhnia, “Unsupervised texture segmentation using Gabor filters,”Pattern Recognit., vol. 24, no. 12, pp. 1167–1186, 1991.
[2] H. Ji, X. Yang, H. Ling, and Y. Xu, “Wavelet domain multifractal analysis for static and dynamic texture classification,” IEEE Trans. Image Process., vol. 22, no. 1, pp. 286–299, Jan. 2013.
[3] J. Mao and A. K. Jain, “Texture classification and segmentation using multiresolution simultaneous autoregressive models,”Pattern Recognit., vol. 25, no. 2, pp. 173–188, 1992.
[4] M. Tuceryan and A. K. Jain, “Texture analysis,” in The Handbook of Pattern Recognition and Computer Vision, C. H. Chen, L. F. Pau, and P. S. P. Wang, Eds. River Edge, NJ, USA: World Scientific, 1998, pp. 207–248.
[5] D. R. Martin, C. C. Fowlkes, and J. Malik, “Learning to detect natural image boundaries using local brightness, color, and texture cues,” IEEE Trans. Pattern Anal. Mach. Intell., vol. 26, no. 5, pp. 530–549, May 2004.
[6] M. Crosier and L. D. Griffin, “Using basic image features for texture classification,”Int. J. Comput. Vis., vol. 88, no. 3, pp. 447–460, 2010.
[7] L. Liu and P. W. Fieguth, “Texture classification from random features,” IEEE Trans. Pattern Anal. Mach. Intell., vol. 34, no. 3, pp. 574–586, Mar. 2012.
Dr. P.S.S Akilashri et al, International Journal of Computer Science and Mobile Applications, Vol.4 Issue. 4, April- 2016, pg. 20-27 ISSN: 2321-8363
Impact Factor: 4.123
©2016, IJCSMA All Rights Reserved, www.ijcsma.com 27
[9] J. Malik, S. Belongie, T. Leung, and J. Shi, “Contour and texture analysis for image segmentation,” Int. J. Comput. Vis., vol. 43, no. 1, pp. 7–27, 2001.
[10] J. Shi and J. Malik, “Normalized cuts and image segmentation,” IEEE Trans. Pattern Anal. Mach. Intell., vol. 22, no. 8, pp. 888–905, Aug. 2000.
[11] T. F. Chan and L. A. Vese, “Active contours without edges,”IEEE Trans. Image Process., vol. 10, no. 2, pp. 266–277, Feb. 2001.
[12] D. Comaniciu and P. Meer, “Mean shift: A robust approach toward feature space analysis,”IEEE Trans. Pattern Anal. Mach. Intell., vol. 24, no. 5, pp. 603–619, May 2002.
[13] S. Alpert, M. Galun, A. Brandt, and R. Basri, “Image segmentation by probabilistic bottom-up aggregation and cue integration,”IEEE Trans. Pattern Anal. Mach. Intell., vol. 34, no. 2, pp. 315–327, Feb. 2012.