ISSN 0015–5659 www.fm.viamedica.pl
The challenge of extra-intra craniometry:
a computer-assisted three-dimensional
approach on the equine skull
A. Lang
1,
P.
Brucker
1,
M. Ludwig
1, T. Wrede
2, J. Theunert
2, H. Gasse
1 1Institute of Anatomy, University of Veterinary Medicine Hannover, Hanover, Germany2Faculty II — Mechanical Engineering and Bio Process Engineering, University of Applied Sciences and Arts, Hanover, Germany
[Received: 11 October 2016; Accepted: 8 November 2016]
Background: The topographical correlations between certain extracranial and intracranial osseous points of interest (POIs), and their age-related changes, are indispensable to know for a diagnostical or surgical access to intracranial structures; however, they are difficult to assess with conventional devices. Materials and methods: In this pilot study, the 3-dimensional coordinates of extra-/intracranial POIs were determined, thus avoiding perspective distortions that used to be intrinsic problems in 2-dimensional morphometry. The data sets were then analysed by creating virtual triangles. The sizes, shapes, and positions of these triangles described the extent and the directions of the age-related shifts of the POIs. A selection of extracranial and intracranial POIs were marked on half skulls of four warmblood horses in two age groups (young: 6 weeks, n = 2; old: 14 and 17 years, n = 2). The x-, y-, and z-coordinates of these POIs were determined with a measurement arm (FaroArm Fusion, FARO Europe®). Direct distances between the POIs as well as their indirect distances on the x-, y-, and z-axis, and angles were calculated.
Results: The analysed virtual triangles revealed that some parts of the skull grew in size, but did not change in shape/relative proportions (proportional type of growth, as displayed by POI A and POI B at the Arcus zygomaticus). The same POIs (A and B) remained in a very stable relationship to their closest intracranial POI at the Basis cranii on the longitudinal axis, however, shifted markedly in the dorso-lateral direction. In contrast, a disproportional growth of other parts of the cranium was, for example, related to POI C at the Crista nuchae, which shifted strongly in the caudal direction with age. A topographically stable reference point (so-called anchor point) at the Basis cranii was difficult to determine. Conclusions: Two candidates (one at the Synchondrosis intersphenoidalis, another one at the Synchondrosis sphenooccipitalis) were relatively stable in their positions. However, the epicentre of (neuro-)cranial growth could only be pinpointed to an area between them. (Folia Morphol 2017; 76, 3: 458–472)
Key words: osseous landmarks, cranial cavity, horse, age, growth, size, geometry, shift, direction, triangles, anchor point, reference point
INTRODUCTION
The techniques applied in osteometry of the skull — although conventional in terms of measuring de-vices like rulers, slide gauges, and callipers [5, 11, 12, 14] — have yielded very precise and most valuable data regarding the external surface of the skull. And yet, as emphasised by Brucker [1], these classical pro-cedures were subject to an essential limitation: They were not able to perform similarly reliable measure- ments from a point at the outside of the skull to a point at its inside (unless bony structures had been removed). However, metrical data relating the outside to the inside may be desirable [1, 15] for a diagnostic or surgical access to intracranial neurological and/or vascular structures, even more so as stereotactic data for extra-intracranial manoeuvres on the equine skull are still lacking [1]. Consequently, first attempts have been made to cope with the challenge of extra-intra measurements by means of a computer-assisted, 3-dimensional (3D) measuring device [1]. (A similar device had been used for craniometry on canine skulls [3, 4], however, with exclusive attention to the exterior surface of the skulls.) In the present study, the dem-onstration of this promising technical tool is one of two major issues.
The second issue of this study is related to the fact that osteometrical studies on the equine skull have been performed for various purposes, e.g. archeozoo-logical [2, 18, 19] or ontogenetic ones [14, 22, 23], but with hardly any clinical focus on the location of the brain and its adjacent structures within the Cavum cranii. Within their intentional scope, these previous studies had focused either on the dimensions of the skull in relation to the dimensions of the bones of legs or trunk [2, 11], or they described the proportions of Facies and Cranium (Splanchno-/Viscerocranium and Neurocranium in older terminology) [6, 7, 11, 14, 17, 22, 23], however, with very few measurements on the Cranium itself.
It is commonly known that the ontogenetic growth of the skull results in a marked change in the ratio of Facies to Cranium in horses, which is due to an abundant elongation of the Facies (i.e. Splanchno-/ /Viscerocranium). So far, measurements on the relative extent of growth of the Cranium (i.e. Neurocranium) have yielded data on the length of the Basis cranii of perinatal foetuses and of very young newborn foals [14]. The variability of cranial morphology has been elaborated on in order to describe different constitu-tion types of horses [11] with exclusive focus on certain
extracranial landmarks (points of interest [POIs]); no particular attention has so far been paid to intracranial POIs. Accordingly, the ontogenetic shifts of different osseous landmarks at the inside of the Cranium and their topographical relations to external landmarks (or vice versa) have not yet been documented.
While some notion of the direction of such shifts during the growth process could be deduced from comparative evaluations of several measured distanc-es on the equine Cranium [1], a much more specific method was elaborated on by Onar and Günes [16] in order to describe age-related changes in the skulls of dogs: A combination of three POIs were connected by two lines forming an angle, which changed its size in relation to the age-related changes in the positions of one or more of these three points. This tempting geometrical approach, designed by the authors [16] in order to describe the shape of the entire skull, might be a useful tool also for the study of the topographi-cal relations of external to internal landmarks of the equine Cranium. Accordingly, the second major issue of the pilot study presented here was the application of a geometrical approach resembling that of Onar and Günes [16] in combination with the aforemen-tioned computer-assisted measuring device, as was previously attempted by Ludwig [15]. The key feature of this approach was the formation and evaluation of virtual triangles composed of selected osseous POIs, which were used to analyse the relationships of intra- and extracranial POIs.
MATERIALS AND METHODS
Animalsto a virtual 3D coordinate system, thereby enabling calculations with the data of these POIs. Maintain-ing originally 3D data in a (virtual) 3D environment avoids the problem of differentperspective distor-tions, which occur in 2-dimensional (2D) (photo-graphic) representations of 3D objects (Fig. 2). In the latter case, different perspectives may generate mistakable/deceiving impressions of the positions of the POIs, even though they have remained in the same location.
The device used for this purpose was the com-puter-assisted measurement arm FaroArm Fusion (FARO Europe®, Stuttgart, Germany). The arm (Fig. 3) was mobile in 7 axes and — equipped with a nar-row tip (inset in Fig. 3) — facilitated access even to POIs in intracranial positions that were difficult or impossible to reach with conventional methods [1, 15]. The measurement procedure involved 7 steps.
Calibration of the system and compilation of the protocol
The measurement arm and the associated soft-ware DELCAM PowerINSPECT (DELCAM Birmingham, UK) were calibrated prior to the examination of each skull according to the procedure described in detail by Brucker [1] and Ludwig [15]. Then, a protocol was compiled, defining both the order in which the POIs had to be touched, and the calculations to be made with the resulting data.
Positioning of the skulls
For the measurements, the skull was placed on a polystyrene mat and adjusted in a standardised Accordingly, notice of the horses’ euthanasia for
the purpose of organ removal from the dead animals (for subsequent anatomical studies) was given to The Animal Welfare Officer of the University of Veterinary Medicine Hannover prior to euthanasia, and was recon-firmed in the annual reports on all animals used within the period of the respective year. In accordance with the German Federal Law, i.e. the Protection of Animals Act (Tierschutzgesetz §7), explicit permission to perform this study was not necessary because no medical proce-dures or experiments were performed while the animals were alive, except intravenous injection for euthanasia. Euthanasia was performed by qualified and authorised medical staff by means of an initial general anaesthesia by 2% Isofluran (Isofluran CP 1 mL/mL, CP-Pharma, Burgdorf, Germany) and a consecutive administration of 60 mg/kg Pentobarbital i.v. (Euthadorm® 400 mg/mL, CP-Pharma, Burgdorf, Germany).
Points of interest
After maceration according to a protocol de-scribed in detail by Brucker [1] and Ludwig [15], the skulls were cut in the median plane, and one half of each skull (randomly either left or right) was used for the study. Six POIs were defined and marked on each half skull with a pencil: (1) three external points easily and reproducibly palpable on a living horse; (2) three points at the inside of the Cavum cranii related to distinct neurological structures (Table 1, Fig. 1).
Procedure of measurement/calculation
The idea of the measurement setup was the transfer of the positions of the POIs on the skulls
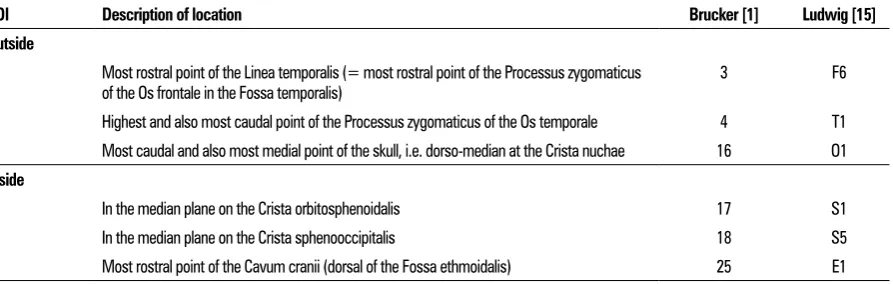
Table 1. Selected points of interest (POIs), designated by capital letters at the outside (A, B, C) and small letters at the inside (a, b, c) of the equine skull. Previous publications [1, 15] had referred to the same POIs, but had done so by using numbers or combinations of letters and numbers (see columns to the right; F, T, O, S, E: Os frontale, Os temporale, Os occipitale, Os sphenoidale, Os ethmoidale)
POI Description of location Brucker [1] Ludwig [15]
Outside
A Most rostral point of the Linea temporalis (= most rostral point of the Processus zygomaticus
of the Os frontale in the Fossa temporalis) 3 F6 B Highest and also most caudal point of the Processus zygomaticus of the Os temporale 4 T1 C Most caudal and also most medial point of the skull, i.e. dorso-median at the Crista nuchae 16 O1
Inside
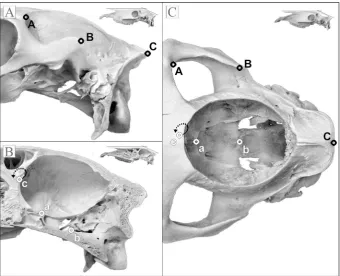
Figure 1. Photographical representation of equine skulls, all placed in a standardised position (note the horizontal line on the plane of the nose and forehead in the insets). Six points of interest (POIs), i.e. a, b, c, A, B, C, were selected; they are marked either in black (external surface) or in white (internal surface); A. Lateral aspect; B. Medial aspect; C. Dorsal aspect; here, the Calvaria has been removed in order to allow for a view onto the Basis cranii. Note that due to this positioning of the skull, the Basis cranii is always tilted caudo-ventrally, as is indicated by POIs a and b in the medial aspect (B).
Figure 2. Illustration of the problem of perspective distortion created by the display of a 3-dimensional object in a 2-dimensional plane. Three
position — i.e. with the dorsal plane of the nose and forehead parallel to the surface of the table and with the median plane parallel to the edge of the table. This standard position was meticulously observed, because a tilt of the skull in any direction in space (Fig. 2) would have negatively influenced some of the parameters (e.g. the so-called indirect distances; see below). Therefore, the skulls were fixed in the proper position (Fig. 3) and kept immobile during the measuring process.
Read-in of the data
All six POIs on the skull were touched with the tip of the measurement arm in the predefined order of the protocol, thereby transferring their x-, y-, and z-coordinates to the DELCAM PowerINSPECT software and automatically initialising the calculations. These coordinates of the POIs were precise to three decimal places. All consecutive calculations were performed with these original data in order to avoid inaccura-cies caused by rounding effects. However, for the presentation in the tables, the calculated data were rounded to a biologically meaningful degree of pre-cision. (No statistical analyses were performed, as this pilot study aimed at demonstrating the applied technique of craniometry rather than the features of equine skull growth. For this reason, in order to keep things as simple as possible, only a small sample size was chosen, which, however, was not large enough to provide adequate data for a statistical analysis.)
Calculation of the direct distances (rdir)
The DELCAM PowerINSPECT software calculated the so-called direct distances (rdir), i.e. the shortest distance connecting two POIs, using the read-in x-, y-, and z-coordinates of the touched POIs.
Formation of virtual triangles and calculation of angles
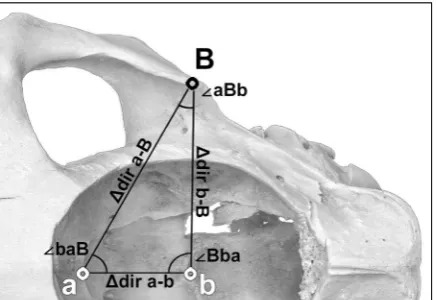
The combination of the direct distances between three POIs yielded virtual triangles (Fig. 4). Every triangle was characterised by the length of its sides (representing the direct distances rdirbetween the POIs) and by the triangle’s three inner angles. The sizes of these inner an-gles were also calculated by the DELCAM PowerINSPECT software. In the tables and figures, these geometrical features were referred to by the following terminology: the triangle was named according to the designation of the POIs involved (Table 1), e.g. triangle a-b-B (Fig. 4); two of its sides, representing for instance the direct distance rdir a-b and the adjacent rdir b-B, enclosed the inner angle named ∠Bba; in this term, the letter in the middle position indicated the POI forming the vertex of this angle (here: POI b). The related figures display drawings of the triangles of the two age groups in order to visualise the extent of the shifts of the POIs.
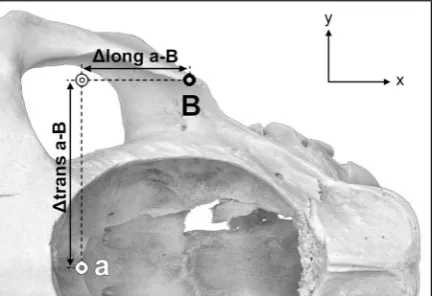
Calculation of the indirect distances (rlong, rtrans, rvert)
The so-called indirect distances (Fig. 5) indicated how far a POI was located in front of another POI or
Figure 3. The FaroArm Fusion (FARO Europe®, Stuttgart, Germany)
and the experiment setup, with the right half of an equine skull
placed and fixed (black fixation tape) on a polystyrene mat in a standardised position. Inset in the red box: magnified image
of the tip of the measurement arm.
Figure 4. Dorsal aspect of the right half of an equine skull (Calvaria removed). The external point of interest (POI) B and the internal POIs a and b, respectively, were connected to form the virtual triangle a-b-B. The sides of the triangle represent the shortest, i.e. the direct, distances (rdir) between the respective POIs, e.g.
rdir a-b. Two such distances form an inner angle, e.g. the angle
behind it, how far above or below it, or how far me-dial or lateral of it (in other words: How far two POIs were separated from each other in the three spatial directions, i.e. on the x-, y- or z-axis). The indirect distances were named rlong (in the longitudinal direction, x-axis), rtrans (in the transversal direction, y-axis) and rvert (in the vertical direction, z-axis) and were calculated with Microsoft EXCEL (Office 2010, Microsoft Corporation, Redmond, WA, USA) accord-ing to the procedure described in detail by Brucker [1].
Graphical representation of the indirect distances between the POIs
The coordinates of the POIs of each age group were averaged using Microsoft EXCEL. The resulting two sets of coordinates (i.e. the mean values of the young group, and the mean values of the old group) were then transferred to the software GeoGebra 5.0 (freeware, Markus Hohenwarter, Salzburg, Austria), which graphically illustrated the positions of these averaged POIs in a 3D coordinate system. Within this software, the two sets of coordinates could then be shifted alongside one another, and were adjusted in two different positions: either with POI a in a hypo-thetically fixed position (hypothetical anchor point POI a), or with POI b in a hypothetically fixed position (hypothetical anchor point POI b). The figures created with the GeoGebra software present the positions of the POIs from four different aspects, and also
illustrate the lengths of the indirect distances con-necting these POIs.
RESULTS
Marked growth-related shifts of some POIs were detected, e.g. of the extracranial POI C, while shifts of others, e.g. of the intracranial POIs a and b, were rela-tively small. The shifts were characterised by distinct geometrical features of the virtual triangles, i.e. (1) by the size and shape of the triangles, thereby visualis-ing the extent of a shift of a POI; (2) by the position of the triangles in 3D space (x-, y-, z-coordinates of the triangles’ corners), indicating the direction of the shifts along the longitudinal, transversal, and horizontal axis of the skull.
Extent of shifts as indicated by changes in size and shape of the virtual triangles
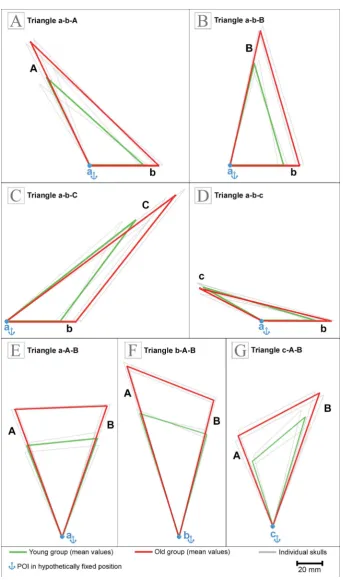
The virtual triangles (Fig. 6), drawn with reference to the calculated direct distances (Table 2) and the cor-responding calculated angles (Table 3), demonstrated whether the growth (extent of shifts of all three POIs of a triangle) was proportional or disproportional. These two kinds of growth were distinguished when comparing the outlines of the triangles in Figure 6 — green outlines representing the mean values of the young skulls, and red outlines representing the mean values of the old skulls (Fig. 6).
A proportional growth had taken place when all POIs of a triangle had shifted apart from each other to the same relative extent. Accordingly, a proportional growth was indicated by a parallel course of the green and red outlines of the triangles (Fig. 6). The impres-sion of a parallel course depended on two features: firstly, on a close similarity of the inner angles of a green triangle and the corresponding red triangle; secondly, on the correlation between the size of an angle and the length of the related direct distances as follows. In a large triangle (with long sides, i.e. large direct distances between POIs), a small age-related difference in the size of an angle had a great effect on the position of the POIs at the ends of the corresponding triangle’s sides (see for instance the position of the extracranial POI C in triangle a-b-C in Fig. 6C). The opposite correlation applied for small triangles: When the sides of a triangle were short (small direct distances between the respective POIs), a large difference in angle size only accounted for small changes in the positions of the correspond-ing POIs (see the intracranial POI c in triangle a-b-c Figure 5. Dorsal aspect of the right half of an equine skull (Calvaria
Figure 6. Graphical representation of the changes in size and shape of the triangles, demonstrating age-related shifts of points of interest (POIs) on the equine skull. The triangles were drawn according to both the measured direct distances (rdir) between the POIs (Table 2) and the corresponding calculated angles (Table 3); the size of the representation is approx. 50% of the original scale (see scale bar). Note that
in this figure — like in any other 2-dimensional representation — the drawn object (in this case: the triangle) is placed in a graphical plane
which neglects the objects 3-dimensional position in space. Consequently, the visible changes in size and shape illustrate the extent of a shift (compare the green and the red triangles), but cannot show the true spatial direction of the shifts. For reasons of better comparison,
the triangles within each figure were arranged as follows: a hypothetically fixed anchor point was assigned (marked by a blue anchor
in Fig. 6D). According to these geometrical items, a proportional growth had occurred in the triangles displayed in Figures 6A, B, E, and F.
In contrast, non-parallel outlines of green or red triangles (Figs. 6C, D, G) were taken as a graphical equivalent of a disproportional growth. The latter was particularly distinct in triangle c-A-B (Fig. 6G): its inner angles differed with age by as much as 14.79° at POI A (∠cAB, see Table 3), and 4.95° and 9.84°, respectively, at the other two POIs of this triangle (Table 3). The significance of the proportional or disproportional shifts of the aforementioned POIs shall be discussed with regard to the anatomical characteristics of these POIs.
The differences between the individual skulls, i.e. inter-individual differences between the triangles within the same age group, were generally relatively large. In particular, the data of the two skulls of the young group differed more than the data of the two old skulls — especially as far as the sizes of the angles were concerned (Table 3), but also regarding
the sizes of the direct distances (Table 2). The great-est individual differences in terms of shape (indicated by differences in the angles) was observed in the triangles a-b-C and c-A-B (compare their angle sizes within the young group in Table 3, and also compare the shapes of the grey triangles in Figs. 6C and 6G). The greatest individual difference in size wasfound in the trianglea-b-C of the young group: the length of its direct distances rdir a-C and rdir b-C (Table 2) varied strongly within the age groups — even though these inter-individual variations were smaller than the aforementioned age-related differences (Table 2) in this triangle. The special involvement of the extracra-nial POI C (at the Crista nuchae) in these cases of large inter-individual variability will be explained from the anatomical point of view in the discussion section.
Direction of shifts as indicated by the x-, y-, z-coordinates of the triangles (Figs. 7, 8; Table 4)
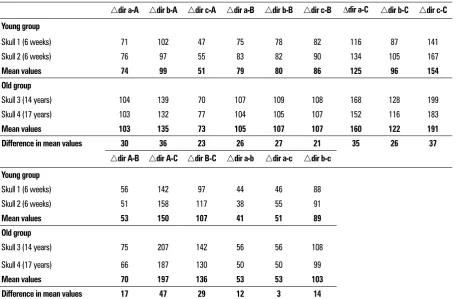
The comparative inspection of the different as-pects (medial, rostral, dorsal) in Figures 7 and 8 Table 2. Direct, i.e. shortest distances (∆dir) between the points of interest (POIs) on the skulls of four horses in two age groups (young: n = 2; 6 weeks; old: n = 2; 14 and 17 years). All distances are given in millimetres (mm). The calculations in this table were performed with the original measured values (which were precise to three decimal places). This fact explains the seeming discrepancies in the rounded presentation of some of the calculated values
rdir a-A rdir b-A rdir c-A rdir a-B rdir b-B rdir c-B ∆dir a-C rdir b-C rdir c-C
Young group
Skull 1 (6 weeks) 71 102 47 75 78 82 116 87 141 Skull 2 (6 weeks) 76 97 55 83 82 90 134 105 167
Mean values 74 99 51 79 80 86 125 96 154
Old group
Skull 3 (14 years) 104 139 70 107 109 108 168 128 199 Skull 4 (17 years) 103 132 77 104 105 107 152 116 183
Mean values 103 135 73 105 107 107 160 122 191
Difference in mean values 30 36 23 26 27 21 35 26 37
rdir A-B rdir A-C rdir B-C rdir a-b rdir a-c rdir b-c
Young group
Skull 1 (6 weeks) 56 142 97 44 46 88 Skull 2 (6 weeks) 51 158 117 38 55 91
Mean values 53 150 107 41 51 89
Old group
Skull 3 (14 years) 75 207 142 56 56 108 Skull 4 (17 years) 66 187 130 50 50 99
Mean values 70 197 136 53 53 103
revealed that certain POIs remained in a constant topographical relationship with each other on at least one of the three spatial axes (longitudinal, transversal, vertical).
For instance, the extracranial POI B was located on almost the same transversal plane as the intracranial POI b in both age groups. This was independent of
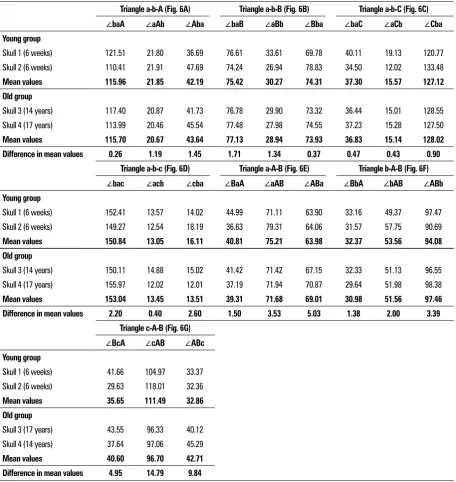
the chosen fixed anchor point (compare Figs. 7A and 7C, and Figs. 8A and 8C, respectively): The longitudi-nal distance rlong b-B was only 2 mm in the young group and 5 mm in the old group (Table 4); the arith-metic difference between these values indicated an age-related caudal shift of the extracranial POI B by as little as 3 mm. (This situation applied when POI b was Table 3. Angles within the four triangles displayed in Figure 6. The point of interest (POI) at the vertex of the angle is located in the centre of the SYNTAX, e.g. ∠baA: inner angle at POI a in the triangle a-b-A. Data on the skulls of four horses in two age groups (young: n = 2; 6 weeks; old: n = 2; 14 and 17 years); all angles are expressed in degrees (°). The calculations in this table were performed with the original measured values (which were precise to three decimal places). This fact explains the seeming discrepancies in the rounded presentation of some of the calculated values
Triangle a-b-A (Fig. 6A) Triangle a-b-B (Fig. 6B) Triangle a-b-C (Fig. 6C)
∠baA ∠aAb ∠Aba ∠baB ∠aBb ∠Bba ∠baC ∠aCb ∠Cba
Young group
Skull 1 (6 weeks) 121.51 21.80 36.69 76.61 33.61 69.78 40.11 19.13 120.77 Skull 2 (6 weeks) 110.41 21.91 47.69 74.24 26.94 78.83 34.50 12.02 133.48
Mean values 115.96 21.85 42.19 75.42 30.27 74.31 37.30 15.57 127.12
Old group
Skull 3 (14 years) 117.40 20.87 41.73 76.78 29.90 73.32 36.44 15.01 128.55 Skull 4 (17 years) 113.99 20.46 45.54 77.48 27.98 74.55 37.23 15.28 127.50
Mean values 115.70 20.67 43.64 77.13 28.94 73.93 36.83 15.14 128.02
Difference in mean values 0.26 1.19 1.45 1.71 1.34 0.37 0.47 0.43 0.90
Triangle a-b-c (Fig. 6D) Triangle a-A-B (Fig. 6E) Triangle b-A-B (Fig. 6F)
∠bac ∠acb ∠cba ∠BaA ∠aAB ∠ABa ∠BbA ∠bAB ∠ABb
Young group
Skull 1 (6 weeks) 152.41 13.57 14.02 44.99 71.11 63.90 33.16 49.37 97.47 Skull 2 (6 weeks) 149.27 12.54 18.19 36.63 79.31 64.06 31.57 57.75 90.69
Mean values 150.84 13.05 16.11 40.81 75.21 63.98 32.37 53.56 94.08
Old group
Skull 3 (14 years) 150.11 14.88 15.02 41.42 71.42 67.15 32.33 51.13 96.55 Skull 4 (17 years) 155.97 12.02 12.01 37.19 71.94 70.87 29.64 51.98 98.38
Mean values 153.04 13.45 13.51 39.31 71.68 69.01 30.98 51.56 97.46
Difference in mean values 2.20 0.40 2.60 1.50 3.53 5.03 1.38 2.00 3.39
Triangle c-A-B (Fig. 6G)
∠BcA ∠cAB ∠ABc
Young group
Skull 1 (6 weeks) 41.66 104.97 33.37 Skull 2 (6 weeks) 29.63 118.01 32.36
Mean values 35.65 111.49 32.86
Old group
Skull 3 (17 years) 43.55 96.33 40.12 Skull 4 (14 years) 37.64 97.06 45.29
Mean values 40.60 96.70 42.71
taken as the fixed anchor point, as is the case in Fig -ure 8. When POI a was taken as the anchor point, as shown in Figure 7, the relation between POI B and POI b within each age group however still remained the same because both POIs shifted together to the same extentwith age.) And yet, the topographical relation between POI B and POI b did not remain constant because, at the same time, POI B shifted away from POI b both in the dorsal direction (Fig. 7A, 8A) and in the lateral direction (Fig. 7C, 8C), each by approx. 20 mm (Table 4). The resulting oblique, dorso-lateral shift of POI B is indicated by the different sizes of the green and red triangles a-b-B in Figures 7B and 8B.
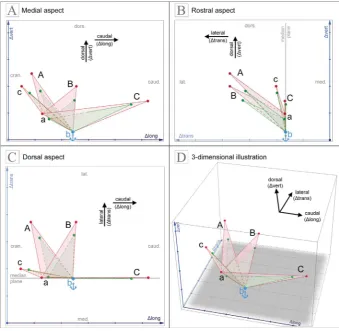
The aforementioned situation was in principle also true for the topographical relationship between the ex-tracranial POI A and the inex-tracranial anchor point POI a. There was, however, one exception concerning their position on transversal planes (Figs. 7A, 7C; 8A, 8C): irrespective of age, the extracranial POI A was always located rostral of the intracranial POI a: rlong a-A was 12 mm in the young group and 16 mm in the old group. Accordingly, the shift of POI A away from POI a was very small (the difference in rlong a-A of the young group and of the old group was only 4 mm, see Table 4). How-ever, like in POI B, there was a marked age-related shift of POI A in the dorso-lateral direction (Figs. 7B, 8B). Figure 7. Graphical illustration to demonstrate the directions of shifts of points of interest (POIs) on equine skulls of different ages (created with the software GeoGebra 5.0); A. Medial aspect to display shifts in the longitudinal and the vertical direction; B. Rostral aspect to display shifts in the transversal and the vertical direction; C. Dorsal aspect to display shifts in the longitudinal and the transversal direction; D. Graphical synopsis of panels A–C in order to display the graphical relation of POIs in 3-dimensional space. Keep in mind the perspective distortions in size and shape due to the oblique aspect chosen for this illustration. Each aspect displays four triangles that are the same as in Figures 6A–D, i.e. they are made up of POI c, POI A, POI B, or POI C and are mounted on the baseline a-b. However, they are presented in their true (tilted) position in space, viewed from four different aspects, i.e. medial (A), rostral (B), dorsal (C), dorso-medio-caudal (3-dimensional illustration, D). Green triangles illustrate the mean values of the young group (n = 2; 6 weeks), red triangles illustrate those of the old group (n = 2; 14 and 17 years). Dashed lines and different shades of colour indicate overlapping areas of triangles (e.g. darker green areas are in
front of pink areas, lighter green areas are behind). In all four aspects of this figure (A–D), POI a has been placed in a hypothetically fixed
position (blue anchor symbol) and therefore remains in the same position in the two age groups. The differences in the positions of the green and red POIs c, A, B, and C indicate the extent and directions of their age-related shifts in the topographical relation to the (hypothetically
The largest age-related change in position was made by the extracranial POI C (Figs. 7A, 7C, 8A, 8C). Its shift occurred strictly in the caudal direction, as hardly any increase was measured in the vertical distance from the closest intracranial POI b (rlong b-C = 26 mm vs. rvert b-C = 5 mm; see Table 4). The extent of this shift on the longitudinal axis was large enough to maintain its caudal direc-tion irrespective of the chosen intracranial anchor point POI a or POI b (compare Figs. 7A, 7C, 8A, 8C). (No shift of POI C on the transversal axis was to be expected because — per definition (Table 1) — POI C, POI a, and POI b were all located on the median
plane. Small transversal distances between these POIs, reported in Table 4, were due to inaccuracies in either the positioning of the skulls during the measurement procedure, or to slight inaccuracies in the position of the cut edge of the halves of the skull; the cut edge was supposed to represent the median plane of the entire skull.)
In contrast to the aforementioned extracranial POIs A, B, C, the topographical relation of the intrac-ranial POI c to its closest intracranial anchor point POI a (Fig. 7) was nearly independent of age: The indirect distances rlong a-c, rtrans a-c, and rvert a-c differed by no more than 2 mm with age (see Figure 8. Graphical illustration to demonstrate the directions of shifts of points of interest (POIs) on equine skulls of different ages (created with the software GeoGebra 5.0); A. Medial aspect to display shifts in the longitudinal and the vertical direction; B. Rostral aspect to display shifts in the transversal and the vertical direction; C. Dorsal aspect to display shifts in the longitudinal and the transversal direction; D. Graphical synopsis of panels A–C in order to display the graphical relation of POIs in 3-dimensional space. Keep in mind the perspective distortions in size and shape due to the oblique aspect chosen for this illustration. Each aspect displays four triangles that are the same as in Figures 6A–D, i.e. they are made up of POI c, POI A, POI B, or POI C and are mounted on the baseline a-b. However, they are presented in their true (tilted) position in space, viewed from four different aspects, i.e. medial (A), rostral (B), dorsal (C), dorso-medio-caudal (3-dimensional illustration, D). Green triangles illustrate the mean values of the young group (n = 2; 6 weeks), red triangles illustrate those of the old group (n = 2; 14 and 17 years). Dashed lines and different shades of colour indicate overlapping areas of triangles (e.g. darker green areas are in
front of pink areas, lighter green areas are behind). In all four aspects of this figure (A–D), POI b has been placed in a hypothetically fixed
position (blue anchor symbol) and therefore remains in the same position in the two age groups. The differences in the positions of the green and red POIs c, A, B, and C indicate the extent and directions of their age-related shifts in the topographical relation to the (hypothetically
Table 4). However, the inter-individual differences in these distances were markedly larger than the age-related differences (Table 4). In contrast, the distance between POI c and anchor point POI b on the longi-tudinal axis increased much more with age than the aforementioned distance between POI c and POI a
(the age-related difference in rlong b-c was 11 mm; Table 4). The direction (rostral or caudal) of the shift of POI c in relation to POI a and POI b remained hy-pothetical, as it depended on the suggested anchor point (i.e. POI a or POI b): Either POI c moved rostrally
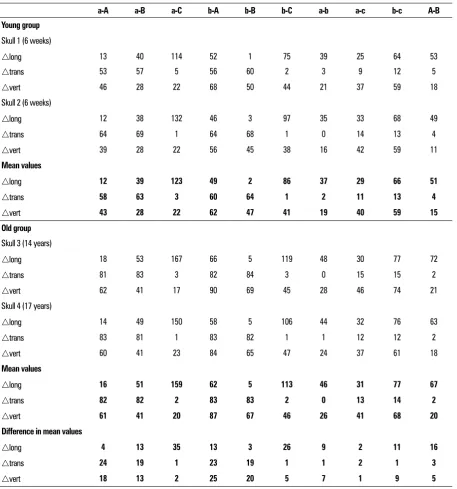
(together with POI a) — if POI b was in a fixed position Table 4. Selection of indirect distances between points of interest (POIs) a, b, c, A, B, C, of four equine skulls in two age groups (young = 6 weeks; old = 14 and 17 years). The indirect distance
r
long is the distance on the x-axis (longitudinal direction); the indirect distancer
trans is the distance on the y-axis (transversal direction); the indirect distancer
vert is the distance on the z-axis (vertical direction). All distances are given in millimetres (mm). The calculations in this table were performed with the original measured values (which were precise to three decimal places). This fact explains the seeming discrepancies in the rounded presentation of some of the calculated valuesa-A a-B a-C b-A b-B b-C a-b a-c b-c A-B
Young group
Skull 1 (6 weeks)
rlong 13 40 114 52 1 75 39 25 64 53
rtrans 53 57 5 56 60 2 3 9 12 5
rvert 46 28 22 68 50 44 21 37 59 18
Skull 2 (6 weeks)
rlong 12 38 132 46 3 97 35 33 68 49
rtrans 64 69 1 64 68 1 0 14 13 4
rvert 39 28 22 56 45 38 16 42 59 11
Mean values
rlong 12 39 123 49 2 86 37 29 66 51
rtrans 58 63 3 60 64 1 2 11 13 4
rvert 43 28 22 62 47 41 19 40 59 15
Old group
Skull 3 (14 years)
rlong 18 53 167 66 5 119 48 30 77 72
rtrans 81 83 3 82 84 3 0 15 15 2
rvert 62 41 17 90 69 45 28 46 74 21
Skull 4 (17 years)
rlong 14 49 150 58 5 106 44 32 76 63
rtrans 83 81 1 83 82 1 1 12 12 2
rvert 60 41 23 84 65 47 24 37 61 18
Mean values
rlong 16 51 159 62 5 113 46 31 77 67
rtrans 82 82 2 83 83 2 0 13 14 2
rvert 61 41 20 87 67 46 26 41 68 20
Difference in mean values
rlong 4 13 35 13 3 26 9 2 11 16
rtrans 24 19 1 23 19 1 1 2 1 3
(Fig. 8C); or POI b shifted caudally, away from POI c, and away from the anchor point POI a (Fig. 7C).
In summary, the directions of the shifts depended on the chosen anchor point, unless the shifts were very large, i.e. larger than the increase in the distance between the two intracranial anchor points POI a and POI b (Table 4): Regarding shifts of POIs on the longitudinal axis, their extent had to exceed a criti-cal value of 9 mm (i.e. the age-related difference in rlong a-b = 9 mm; Table 4) in order to distinguish a shift in the rostral direction from a shift in the caudal direction. Regarding shifts on the vertical axis, their extent had to exceed a critical value of 7 mm (i.e. the age-related increase in rvert a-b = 7 mm; Table 4) to in order to distinguish a ventral from a dorsal shift.
DISCUSSION
The technique and the specimensThis 3D morphometrical investigation was de-signed to focus on the technical and geometrical features of extra-intra craniometry. It was not meant at this time to elaborate on and present ontogenetic data of equine skull growth. This purpose required a choice of samples that was both small enough (in number) to remain easy to display, and at the same time differ enough (in size and shape of the skulls) to allow for a clear and straightforward demonstration of the technique itself. Accordingly, two skulls each were chosen from the two age groups which had been reported in previous studies [1, 15] to exhibit the strongest age-related differences: very young (6 weeks post partum) and old (14 and 17 years) horses.
The presentation of a 3D object (e.g. a skull) in a 2D display system (printed page, or monitor) is submitted to severe graphical limitations, as the task of visualisation has to cope with the inherent problem of perspective distortions. Such problems occur when geometrical data are taken from photographs, as was performed by Onar and Günes [16]. Working with the FaroArm Fusion avoids this problem because the data are true coordinates in 3D space. And yet, the problem reappears anyhow when it comes to display-ing the data, e.g. the virtual triangles, in graphical representations. This may challenge the eye and the imagination of the beholder, especially when looking at images of virtual triangles that lie in an oblique position in space (i.e. in a position non-parallel to the three main spatial planes).
The precision and the technical reliability of the worldwide established FaroArm Fusion (www.faro.
com) has been successfully demonstrated in pre-vious, elaborate craniometrical studies [1, 15]. An important potential source of error, however, lies in the experiment setup: correct positioning of the skull on the measurement table of the FaroArm Fusion is crucial for an accurate recording of the data for the so-called indirect distances (distances along/parallel to the three main axes of space, i.e. longitudinal, transversal, vertical planes [x-, y-, z-axis]). Even a slight tilting out of one of these planes will influence the measured value of the related indirect distances.
Shifts of POIs
The concept of analysing virtual triangles made up of three POIs is a further development of a technique introduced by Onar and Günes [16]. Their study was performed on photographs of the dorsal aspects of the skulls and, due to this technical approach, could only demonstrate shifts on the longitudinal and on the transversal axis, while shifts on the vertical axis could not be detected. Moreover, shifts in oblique 3D direc-tions could not be appropriately recognised in these 2D photographs. Three-dimensionally oblique shifts, however, are supposed to reflect the true biological situ -ation best [15]. The technique applied in this study was capable of detecting such oblique shifts. For instance, POI A and POI B (both on the Arcus zygomaticus) were both found to shift markedly in a latero-dorsal direction while remaining in an almost stable position on the lon-gitudinal axis if analysed in relation to POI a and POI b (these topographical relationships were clearly displayed by the virtual triangles a-b-A and a-b-B).
Proportional versus disproportional growth Combining three POIs in a virtual triangle, and evaluating all of the three angles (i.e. one inner angle at each of the three POIs) yielded data that was suited to distinguish between so-called proportional and disproportional types of growth. Proportional growth occurred when all of the three sides of a triangle grew by approximately the same relative extent, meaning that the respective parts of the skull increased in size, but did not change in their relative proportions. This applied, for instance, to POI B on the caudal edge of the Arcus zygomaticus in relation to the Basis cranii (POI a and POI b). The same was true for POI A (most rostral point of the Arcus zygomaticus) in relation to POI a and POI b.
direction (indicated by the disproportional change of triangle a-b-C). This is in line with the functional relevance of this part of the skull: Differences in the prominence of the Crista nuchae have for instance been described in different breeds of dogs (muscular versus miniature breeds) to be correlated with the mass of the neck muscles of an animal [9].
The triangle a-b-c also displayed a disproportional type of growth, which was related to the intracra-nial POI c (the most rostral part of the Cavum cranii, dorsal to the Fossa ethmoidalis). In contrast to the extracranial POI C, however, the differences in the shape of this triangle marking this disproportional growth were not clearly age-related. Instead, they were caused by large individual differences in the position of POI c, which was located in a relatively large fossa, and was thus much more difficult to precisely determine than a POI on a well demarcated crista (like POI a and POI b).
The anchor point(s)
In this study, the description of the directions of shifts was always topographically relative, i.e. it focussed on the position of a selected POI in relation to the other two POIs forming one virtual triangle. Intrinsically, the change in the position of such a tri-angleas a whole within the skull’s outline remained unclear, as there was a lack of knowledge about a biologically (phylogenetically) truly stable centre point of the skull. The concept of using centroid size and Procrustes superimposition, as employed by Drake and Klingenberg [3], Drake [4], and Ge et al. [8] when comparing skulls of dogs and lagomorphs all in their adult state, was not adopted in our study in order not to neglect the age-related differences in size of the skulls. Consequently, the choice of an appropriate, i.e. topographically stable reference point was most desirable, but had to be attempted by a different approach. An ideal reference point (called anchor point in this study) would remain in its position, with the (Neuro-)Cranium growing around it. This prob-lem was addressed by hypothetically choosing two alternatives of anchor points in the median plane of the Basis cranii, i.e. POI a (on the Crista orbitosphe-noidalis) and POI b (on the Crista sphenooccipitalis), respectively (both with a strong clinical relevance due to their topographical relation to the pituitary gland and to most significant intracranial blood vessels).
The virtual triangles related to these hypothetical anchor points did prove both POI a and POI b to be
remarkably stable in their positions (both in inter-individual and age-group comparisons) in relation to the POIs surrounding them. However, there were still some age-related differences of their positions, namely in the longitudinal direction, as indicated by the measures of the distance between them (i.e. ∆long a-b). The size of this distance increased by 9 mm when the values of the young group and of the old group were compared. Assuming that POI a was stable, POI b would have moved (by 9 mm) in the caudal direction; assuming the contrary, POI a would have moved in the rostral direction. Between these extremes, the com-mon overlapping range might be referred to as the reference area (anchor area) representing the fixed, i.e. unchanging part of the Basis cranii.
In order to further investigate this hypothesis, the consideration of histological data may be useful, as both POIs are related to synchondroses relevant for skull growth (POI being related to the Synchondrosis intersphenoidalis, POI b to the Synchondrosis sphe-nooccipitalis). The Synchondrosis intersphenoidalis is known to ossify prior to the Synchondrosis sphe-nooccipitalis in horses, i.e. at the age of 2–2.5 years vs. 3.25–6 years according to Ussow [22, 23]. The bi-polar structure of the Synchondrosis sphenooccipitalis in the growing skull of dogs [10] indicated a growth both in the rostral and in the caudal direction. A simi-lar situation was seen in a preliminary study of these synchondroses in the skull of a warmblood foal [13].
Combining geometrical and (preliminary) histologi-cal findings one may suggest that prior to the time of closure of the Synchondrosis intersphenoidalis (i.e. up to 2–2.5 years), (neuro-)cranial growth originates from both synchondroses; this is the period when most of the growth of the neurocranium occurs [1, 14, 15]. Under the assumption that both synchondroses were equally active/productive, POI a and POI b would drift apart from each other to the same extent, and the true resting point (anchor point) would lie at half their dis-tance, i.e. in the middle of the aforementioned anchor area. In horses older than 2.5 years (after ossification of the Synchondrosis intersphenoidalis) POI b may be regarded as the epicentre of growth processes and of shifts in the base of the Neurocranium.
CONCLUSIONS
of this pilot study, although limited in their biological validity due to the small sample size, were suited to rule out some POIs (e.g. POI C and POI c) as appropriate ref-erence landmarks, and to recommend some others. For instance, from a practical point of view, the pair of POI A and POI a can serve as valuable reference points for the rostral part of the Cavum cranii, while the combination of POI B and POI b are suited to refer to the caudal part of the Cavum cranii. As indicators for the probability of location of adjacent neurological structures and blood vessels, these POIs are proposed as valuable landmarks that can help to optimise medical imaging procedures by employing a clearly defined approach. In this context, minimising the necessary acquisition time is a most desirable key issue in high quality magnetic resonance imaging of the equine brain [20, 21].
REFERENCES
1. Brucker P. Morphometrische Untersuchung des Hirn-schädels vom Pferd mit einem computergestützten 3-dimensionalen Messsystem (doctoral dissertation). University of Veterinary Medicine, Hannover 2015. 2. Chrószcz A, Janeczek M, Pasicka E, et al. Height at the
withers estimation in the horses based on the internal dimension of cranial cavity. Folia Morphol. 2014; 73(2):
143–148, doi: 10.5603/FM.2014.0021, indexed in
Pubmed: 24902091.
3. Drake AG, Klingenberg CP. The pace of morphologi-cal change: historimorphologi-cal transformation of skull shape in St Bernard dogs. Proc Biol Sci. 2008; 275(1630):
71–76, doi: 10.1098/rspb.2007.1169, indexed in
Pubmed: 17956847.
4. Drake AG. Dispelling dog dogma: an investigation of heterochrony in dogs using 3D geometric morphometric analysis of skull shape. Evol Dev. 2011; 13(2): 204–213,
doi: 10.1111/j.1525-142X.2011.00470.x, indexed in
Pubmed: 21410876.
5. Driesch A. von den. A guide to the measurement of ani-mal bones from archaeological sites. Bulletins 1, Peabody Museum Bulletins, Harvard University. 1976: Harvard. 6. Duerst JU. Vergleichende Untersuchungsmethoden am
Skelett bei Säugern. In: Abderhalden E (ed.). Handbuch der biologischen Arbeitsmethoden Abt VII, Methoden der vergleichenden morphologischen Forschung. Heft 2. Urban u. Schwarzberg, Berlin, Wien. 1926.
7. Evans KE, McGreevy PD. Conformation of the equine skull: a morphometric study. Anat Histol Embryol. 2006;
35(4): 221–227, doi: 10.1111/j.1439-0264.2005.00663.x,
indexed in Pubmed: 16836585.
8. Ge D, Yao L, Xia L, et al. Geometric morphometric analysis of skull morphology reveals loss of phylogenetic signal
at the generic level in extant lagomorphs (Mammalia: Lagomorpha). Contrib Zool. 2015; 84: 267–284. 9. Klatt B. über den Einflu\ der Gesamtgrö\e auf das SchÄdel
-bild nebst Bemerkungen über die Vorgeschichte der Haus-tiere. Archiv für Entwicklungsmechanik der Organismen.
1913; 36(3): 387–471, doi: 10.1007/bf02266725. 10. Klingler M. Retrospektive Betrachtung des
Fugenschlus-ses der Synchondrosen der Schädelbasis bei Hunden verschiedener Rassen unter besonderer Berücksichtigung des Cavalier King Charles Spaniels (doctoral dissertation). University of Giessen 2013.
11. Komosa M, Moliński K, Godynicki S. The variability of
cranial morphology in modern horses. Zoolog Sci. 2006;
23(3): 289–298, doi: 10.2108/zsj.23.289, indexed in
Pubmed: 16603822.
12. Krahmer R. Messungen am Kopfskelett des Pferdes. Ein Beitrag zur Bedeutung der Kraniologie, Leipzig 1963. 13. Lang A, Gasse H. Preliminary histological study on
syn-chondroses in the skull of a warmblood foal. Unpublished data. 2016.
14. Löffler K. Untersuchungen über die Wachstumsverhält -nisse der Kopfknochen des Pferdes (doctoral dissertation). University of Giessen 1919.
15. Ludwig M. Computergestützte Craniometrie beim Pferd unter Berücksichtigung altersabhängiger Lageverschie-bungen osteologischer Landmarks (doctoral dissertation). University of Veterinary Medicine, Hannover 2015. 16. Onar V, Güneş H. On the variability of skull shape in
German shepherd (Alsatian) puppies. Anat Rec A Discov
Mol Cell Evol Biol. 2003; 272(1): 460–466, doi: 10.1002/ ar.a.10052, indexed in Pubmed: 12704704.
17. Osborn HF. Craniometry of the equidae. In: Memoirs of the American Museum of natural history. New Series, Vol. 1, Part III. 1912: 55–100.
18. Radinsky L. Allometry and reorganization in horse skull propor-tions. Science. 1983; 221(4616): 1189–1191, doi: 10.1126/ science.221.4616.1189, indexed in Pubmed: 17811522. 19. Reeve E, Murray P. Evolution in the horse’s skull. Nature.
1942; 150(3805): 402–403, doi: 10.1038/150402a0. 20. Stuckenschneider K. Magnetresonanztopograhische
Untersuchungen der Gehirnregion gesunder und neurolo-gisch erkrankter Pferde mit einer Feldstärke von 3 Tesla (doctoral dissertation). University of Veterinary Medicine, Hannover 2013.
21. Stuckenschneider K, Hellige M, Feige K, et al. 3-Tesla mag-netic resonance imaging of the equine brain in healthy horses – Potentials and limitations. Pferdeheilkunde
Equine Medicine. 2014; 30(6): 657–670, doi: 10.21836/ pem20140605.
22. Ussow SS. Über Alters- und Wachstumsveränderungen am Knochengerüst der Haussäuger. Arch Wiss Prakt Tierhk. 1901; 27: 339–394.