Development and validation of analytical methods for simultaneous estimation of sitagliptin phosphate and metformin hydrochloride in bulk and tablets by using UV-spectroscopy
9
0
0
Full text
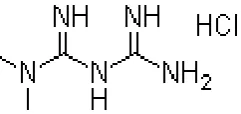
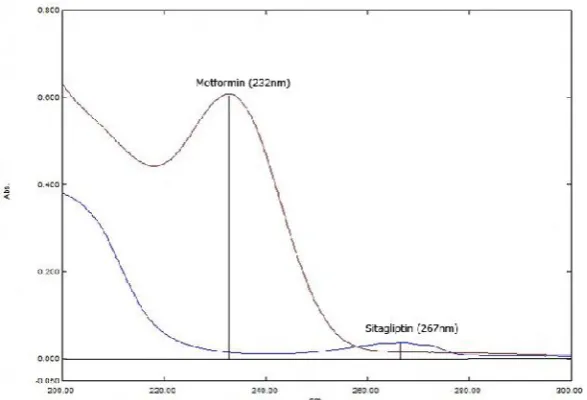
(2) 300. Surendra kumar N. et al., Int. Journal of Pharmacy & Industrial Research Vol – 02 Issue – 03 Jul – Sep 2012. inactivation of incretins, particularly glucagon-. Materials and methods. like peptide-1 (GLP-1) and gastric inhibitory. Materials. polypeptide. improving. Pure drug samples of sitagliptin phosphate and. glycemic control. Metformin is a biguanide. metformin hydrochloride were obtained from. drug effective in patients who lack functioning. Hetero drugs Limited, Hyderabad. JANUMET. islet cells as it act by simulations of glycolysis. tablets. in peripheral tissues. The combination of. metformin. sitagliptin and metformin is available as a. purchased from the local pharmacy. All the. tablet formulation in the ratio 50:500 mg. chemicals and reagents were of analytical. sitagliptin: metformin. The combination of. grade purchased from the SD Fine chemicals,. metformin. Mumbai.. (GIP),. and. a. thereby. dipeptidyl. peptidase. (Sitagliptin. phosphate. hydrochloride. 500. 50mg. and. mg). were. 4inhibitor has been shown to be safe, effective and well-tolerated treatment for type 2. Equipments and apparatus. diabetes. The literature survey reveals that. A double-beam Shimadzu 1800 UV-Visible. there are some of the methods have been. spectrophotometer, with spectral bandwidth of. reported for the estimation of sitagliptin by. 2 nm and a pair of 1-cm matched quartz cells. spectrophotometry. [1]. , UV. [2-3],. HPLC. [4-5]. [6]. and. determination of metformin by UV , HPLC 11]. [7-. . Among the various methods available for. was used to measure absorbance of resulting. solution.. balance,. micropipette,. the determination of drugs, spectrophotometry. glassware’s. continues to be very popular, because of their. experiment.. were. Analytical used. the. weighing. sonicator. and. throughout. the. simplicity, specificity and low cost and the basic objective of the present study was to. Preparation of stock solution. develop a new spectrophotometric method. Standard. involving both simultaneous equation method. metformin were prepared by dissolving 10 mg. and. the. of each drug in 100ml of distilled water and. sitagliptin. the resulting solution gives a concentration of. second. simultaneous. order. derivative. estimation. of. for. phosphate and metformin hydrochloride in. stock solution of sitagliptin and. 100µg/ml.. bulk and tablet dosage forms. Determination of Absorption Maxima 10µg/ml of sitagliptin and 10µg/ml of metformin were prepared from the stock solution by appropriate dilution with distilled water. The resulting solutions were scanned Figure 01: Structure of sitagliptin phosphate. separately in the range of 200-400 nm to determine. the. wavelength. of. maximum. absorption for both the drugs. Sitagliptin showed absorbance maxima at 267 nm and metformin at 276 nm (Fig. 3). Figure 02: Structure of metformin Hcl. www.ijpir.com.
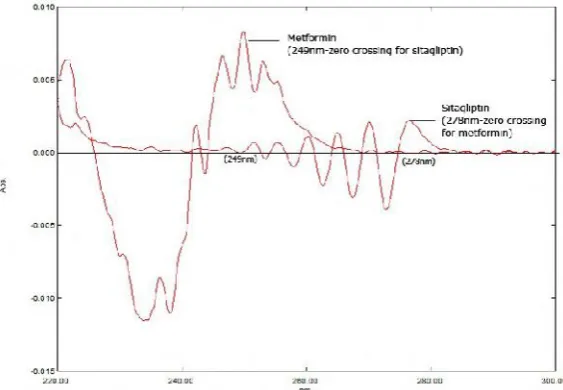
(3) 301. Surendra kumar N. et al., Int. Journal of Pharmacy & Industrial Research Vol – 02 Issue – 03 Jul – Sep 2012. Figure 03: Overlain spectra of Sitagliptin phosphate and Metformin hydrochloride Simultaneous equation method (Method I). point for metformin) and 249.0 nm for. From the stock solution (100μg/ml), working. metformin. standard solutions of 5-50µg/ml of sitagliptin. sitagliptin). The concentration ranging from 5-. and metformin were prepared by appropriate. 50µg/ml of sitagliptin and metformin were. dilutions. scanned. prepared from the standard stock solutions.. separately in entire UV range to determine the. The absorbances of these standard solutions. λmax. The absorbances of these standard. were measured at 278 nm and 249 nm and. solutions were measured at 267 nm and 232. calibration curves of sitagliptin and metformin. nm and calibration curves were plotted. The. were plotted. The concentration. summary. and. individual drug present in the mixture was. calibration data were presented in table.1. determined against the calibration curve in. respectively.. quantitation mode. The calibration data were. with. of. water. and. analytical. were. parameters. (zero. crossing. point. for. of the. presented in table.1. Second order derivative spectroscopy (Method II) In. this. method. Application of proposed method for solutions. of sitagliptin. pharmaceutical formulation. (10μg/ml) and metformin (10μg/ml), were. For the estimation of sitagliptin and metformin. prepared. separately by appropriate. in the commercial formulations, twenty tablets. dilution of standard stock solution with the. (JANUMET) were weighed and average. distilled water and. weight was calculated. The. scanned in the spectrum. tablets were. mode from 400 nm to 200 nm. The absorption. crushed in a mortar to obtain fine powder.. spectra thus obtained were derivatized from. Tablet powder equivalent to 10 mg of drug was. first to fourth order. Second order derivative. dissolved in water and to it 9mg of sitagliptin. spectra were selected for analysis of both. (standard). drugs. From the overlain spectra of both drugs. method) and diluted up to the mark with. (Fig. 4), wavelengths selected for quantitation. distilled water to get a concentration of. were 278.0 nm for sitagliptin (zero crossing. 100µg/ml each of sitagliptin and metformin.. www.ijpir.com. was. added. (standard. addition.
(4) 302. Surendra kumar N. et al., Int. Journal of Pharmacy & Industrial Research Vol – 02 Issue – 03 Jul – Sep 2012. The resulting solution was ultra sonicated for. sample were determined by using simultaneous. 10 minutes and filtered through a Whatmann. equation (Method-I). The concentration of. filter paper (No. 41). From the filtrate 1.0 ml. both sitagliptin and metformin were determined. was transferred to a 10.0 ml volumetric flask. by measuring the absorbance of the sample at. and diluted to the mark with the same solvent. 278 nm and 249 nm in second order spectrum. to obtain 10μg/ml of sitagliptin and 10μg/ml of. mode. The results of the formulation analysis. metformin. Absorbances of sample solutions. were calculated against the calibration curve in. were measured at nm and 276.0 nm and 232. quantitation mode (Method II).The results were. nm. The concentration of two drugs in the. tabulated in table.1.. Figure 04: Overlain second order derivative spectra of Sitagliptin and Metformin. Table No. 01: Results of analysis of tablet formulation Method I II. Tablet content. Label claim (mg/tab). sitagliptin metformin sitagliptin metformin. 50 500 50 500. Amount found* (in mg) (in %) 49.90 mg 503.2 mg 49.34 mg 505.4 mg. Mean of three observations*. %RSD. 99.8 100.64 98.69 101.08. 0.24 0.19 0.31 0.41. second. order. Validation The proposed method was validated as per. method. International Conference on Harmonisation. spectrophotometric. (ICH) guidelines. [12-14]. .. and. method,. derivative the. Beer-. Lambert’s law obeyed in the concentration range o f 5-50μg/ml for both sitagliptin and. Linearity. metformin.. The linearity of measurement was evaluated. sitagliptin and metformin for both the. by analyzing different concentrations of the. methods were shown in the figures (5 to 8).. standard. The results of their calibration data were. solutions. of. sitagliptin. and. metformin. For both simultaneous equation. The. calibration. shown in the table no: 2.. www.ijpir.com. graphs. of.
(5) 303. Surendra kumar N. et al., Int. Journal of Pharmacy & Industrial Research Vol – 02 Issue – 03 Jul – Sep 2012. Figure 05: Calibration graph of Sitagliptin phosphate in simultaneous equation method. Figure 06: Calibration graph of Metformin hydrochloride in simultaneous equation method. Figure 07: Second order derivative calibration graph of Sitagliptin phosphate. www.ijpir.com.
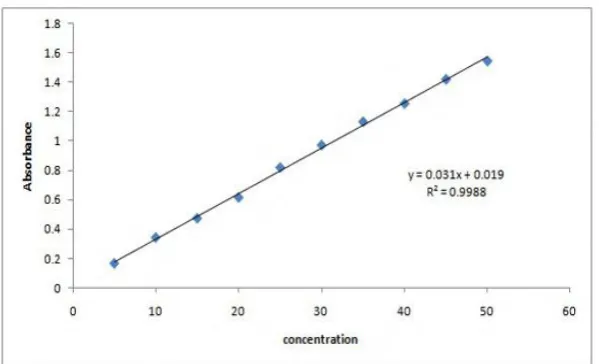
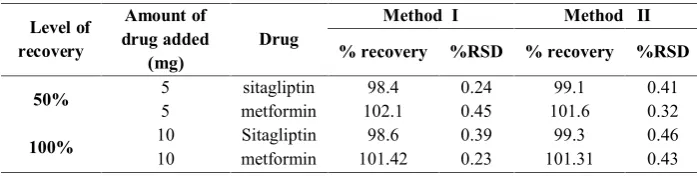
(6) 304. Surendra kumar N. et al., Int. Journal of Pharmacy & Industrial Research Vol – 02 Issue – 03 Jul – Sep 2012. Figure 08: Second order derivative calibration graph of Metformin hydrochloride Table No. 02: Linear regression analysis of calibration curves Parameters Beer’s law limit (µg/ml) Correlation coefficient (r) Slope Intercept Limit of Detection (µg/ml) Limit of Quantitation (µg/ml). Method 1 Sitagliptin Metformin 5-50µg/ml 5-50µg/ml 0.9992 0.9987 0.004 0.058 0.002 0.057 0.825 0.086 2.5 0.263. Method 2 Sitagliptin Metformin 5-50µg/ml 5-50µg/ml 0.9988 0.9984 0.031 0.008 0.019 0.001 0.106 0.630 0.322 1.91. Accuracy In order to ensure the suitability and. and metformin. Then a known quantity of. reliability of the proposed method, recovery. standard sitagliptin and metformin were. studies were carried out. Recovery studies. added to 50% and 100% level and the. were carried out by standard addition method. contents were reanalyzed by the proposed. at two different levels 50% and 100% To an. method. The % recovery and % RSD were. equivalent quantity of formulation powder. calculated. The results of recovery data for. (10 mg), 9 mg of standard sitagliptin was. both simultaneous equation method and. added to it (standard addition method), such. second order derivative spectroscopic method. that sample contains 10 mg each of sitagliptin. were shown in the table.3.. Table No. 03: Results of recovery studies Level of recovery 50% 100%. Amount of drug added (mg) 5 5 10 10. Drug sitagliptin metformin Sitagliptin metformin. Method I. Method II. % recovery. %RSD. % recovery. %RSD. 98.4 102.1 98.6 101.42. 0.24 0.45 0.39 0.23. 99.1 101.6 99.3 101.31. 0.41 0.32 0.46 0.43. Mean of three observations*. www.ijpir.com.
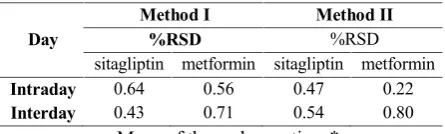
(7) 305. Surendra kumar N. et al., Int. Journal of Pharmacy & Industrial Research Vol – 02 Issue – 03 Jul – Sep 2012. Precision The precision of the developed method was. same drug concentrations. The % R.S.D. expressed in terms of % relative standard. values found to be less than 2 for both. deviation (% RSD). The precision was done. sitagliptin. at two levels (intraday, interday). Intraday. simultaneous equation method and second. precision was done by analyzing the two. order derivative spectroscopic method. Low. concentrations of each drug (sitagliptin 25. RSD values indicate that this method is. and 30 µg/ml and metformin 25 and 30. precise for the determination of sitagliptin and. µg/ml) for three times. Interday precision was. metformin. The results of precision studies. measured over three consecutive days for the. were shown in the table.4.. and. metformin. in. both. Table No. 04: Results of intermediate precision Day Intraday Interday. Method I %RSD sitagliptin metformin 0.64 0.56 0.43 0.71. Method II %RSD sitagliptin metformin 0.47 0.22 0.54 0.80. Mean of three observations* Limit of detection (LOD) and Limit of. quantitation were 267nm (λmax of sitagliptin). quantitation (LOQ). and 232nm (λmax of metformin). In second. The LOD and LOQ of sitagliptin phosphate. order. and metformin hydrochloride were calculated. wavelengths selected for quantitation were. by mathematical equation.. 278nm for sitagliptin (zero crossing point for. LOD = 3.3×standard deviation ÷ slope. metformin) and 249nm for metformin (zero. LOQ = 10×standard deviation ÷slope. crossing point for sitagliptin).The summary of. The LOD of sitagliptin and metformin were. analytical parameters. found to be 0.825µg/ml and 0.086µg/ml in. data were presented in (table: 2). Percent label. simultaneous equation method and 0.106µg/ml. claim for sitagliptin and metformin in tablet. and 0.630µg/ml in second order derivative. analysis was found to be 99.81% and. spectroscopic method. The LOQ of sitagliptin. 100.64% in simultaneous equation method. and metformin were found to be 2.5µg/ml and. 98.69% and 101.08% in second order. 0.263µg/ml in simultaneous equation method. derivative. and 0.322µg/ml and 1.91µg/ml in second order. respectively(table:1).The. derivative spectroscopic method.. precision studies were calculated for both the. derivative. spectroscopic. method,. with their calibration. spectroscopic %. method RSD. for. methods and the low RSD values obtained. Results and discussion. indicate that the methods were precise(table:. The methods discussed in the present work. 4). Accuracy. provide a simple, precise, rapid and accurate. ascertained by recovery studies and the results. way. were expressed. for. simultaneous. determination. of. of. proposed as. %. methods was. recovery. Percent. sitagliptin and metformin. In simultaneous. recovery for sitagliptin and metformin in. equation method, wavelength selected for. simultaneous equation method was found to be 98.6% and 101.42% and 99.3% and 101.31%. www.ijpir.com.
(8) 306. Surendra kumar N. et al., Int. Journal of Pharmacy & Industrial Research Vol – 02 Issue – 03 Jul – Sep 2012. in second order derivative spectroscopic method (table: 3).. 2011, 62–69. 4.. Ramzia IE, Ehab FE, Bassam MA. Liquid Chromatographic. Determination. of. Conclusion. Sitagliptin either alone or in Ternary. The proposed methods are simple, accurate,. Mixture with Metformin and Sitagliptin. precise, reproducible and economical and can. Degradation Product. Talanta. 85, 2011,. be employed for routine quality control of. 673–680.. sitagliptin. phosphate. and. metformin. in. 5.. Ramakrishna N, et al. Sensitive Liquid Chromatography. combined dose tablet formulation.. Spectrometry. Tandem Method. Mass for. the. Acknowledgements. Quantification of Sitagliptin, a DPP-4. The authors are thankful to the management,. Inhibitor, in Human Plasma using Liquid. Anurag group of institutions for providing the. Liquid Extraction. Biomed. Chromatogr.. equipment and facilities for entire duration of. 22, 2008, 214–222.. the work and to Hetero Pharmaceuticals,. 6.. Ajithdas A, Nancy K.. Simultaneous. Hyderabad, for providing gift samples of and. Estimation of Metformin Hydrochloride. sitagliptin. and Glipizide in Solid Dosage Forms by. phosphate. and. metformin. Ultraviolet. hydrochloride pure drugs.. Spectrophotometry.. Indian. Drugs. 37(11), 2000, 533-6. 7.. References 1.. Development and Validation of RP-HPLC. Ramzia I El-Bagary, Ehab F Elkadyand,. Method for the Analysis of Metformin.. Bassam M Ayoub. Spectrophotometric Methods. for. the. Determination. of. Sitagliptin and Pioglitazone in Bulk and. Pak J. Pharm. Sci. 9(3), 2006, 231-235. 8.. Hydrochloride. 55-61.. Method. for. the. Pharm. Sci. 70(3), 2008, 383-386. 9.. in. Binary. Mixture. Metformin. and. Sitagliptin. Alkaline. Kadam. A.. 10. Yuen KH, Peh KK. Simple HPLC Method for the Determination of Metformin in Human Plasma. J. Chromator. B. 710(1-. with. Metformin and Ternary Mixture with. S,. 43(1), 2006, 16-20.. metric Methods for Determination of Sitagliptin. Kulkarni. Reverse Phase HPLC. Indian Drugs.. Res. 4(3), 2011, 871-873. Spectroflourometric and Spectrophoto -. R,. Metformin in Pharmaceutical Dosage by. Bulk and Target Dosage Form. J. Pharm. Ramzia IE, Ehab FE, Bassam MA.. Bhanu. Simultaneous Estimation of Gliclazide and. Estimation of Sitagliptin Phosphate in. 3.. Pioglitazone. Combined Tablet Dosage form. Indian J.. and Yogesh Ahire. Development and Spectrophotometric. and. Hydrochloride by RP-HPLC Method from. Parag Pathade, Md Imran, Vion Bairagi Validation of Stability Indicating UV. Sahoo PK, Sharma R and Chaturvedi SC. Simultaneous Estimation of Metformin. Dosage Form. Int J. Biomed. Sci. 7, 2011, 2.. Arayne MS, Sultana N, Zuberi MH.. 2), 1998, 243-6. 11. Jain D, Jain S, Amin M. Simultaneous. Degradation Product. Int J. Biomed. Sci. 7,. www.ijpir.com. Estimation of Metformin Hydrochloride,.
(9) 307. Surendra kumar N. et al., Int. Journal of Pharmacy & Industrial Research Vol – 02 Issue – 03 Jul – Sep 2012. Pioglitazone. and. 13. International conference on Harmonization.. Tablet. Photo stability testing of new drug. Formulation. J. Chromatogr. Sci. 46(6),. substance and products Q1B. International. 2008, 501-504.. Conference on Harmonization, IFPMA,. Glimepride. Hydrochloride by. RP-HPLC. in. Geneva, 1996.. 12. ICH Q2 (R1). Validation of Analytical Procedures:. Text. and. Methodology.. 14. ICH Guidance on Analytical Method. International conference on Harmonization. Validation,. of. the. International Convention on Quality for. Registration of Pharmaceutical for Human. the Pharmaceutical Industry, Toronto,. Use, Geneva, Switzerland. (2005).. Canada and September 2002.. Technical. Requirements. for. www.ijpir.com. in:. Proceedings. of. the.
(10)
Figure
+3
Related documents
attenuated virus, as it is clear from the tissue culture studies that this virus replicates well; direct comparisons in which the two isolates are used to infect a compatible cell
Higher concentrations of both caspase-cleaved CK18 and total CK18 were measured in bile samples compared to serum samples, suggesting that cell death is prominent in the
circumstances, estimates of transpiration made from changes in soil moisture content will be erroneous, some areas have been identified where caution is required if a soil
Im Rahmen dieser Studie trat weder eine allergische Reaktion noch ein anaphylaktischer Schock nach der wiederholten Gabe von HAL im gleichen Patienten auf weder während
AIC, Akaike information criterion; ALC, absolute lym- phocyte count; ALP, alkaline phosphatase; C-index, con- cordance index; circRNAs, circular RNAs; CONUT score,
For the year 1976, the probability of being the warmest in terms predicted indoor warmth is only about 32% for the full parametric Sample "i"; while this probability
Main Fuel Line Reserve Fuel Line Fuel outlet Fuel Control Knob Tank to change over the.. position of the
