O R I G I N A L R E S E A R C H
CONUT Score or/and Peripheral Blood
CD4+/CD8+ Ratio-Based Web Dynamic
Nomograms to Predict the Individualized Survival
of Patients with Advanced Osteosarcoma
This article was published in the following Dove Press journal: Cancer Management and Research
Qian-Kun Yang 1,* Yan-Na Su2,* Wei Wang1,* Nan Wang3
Zhong-Xiang Yao4,* Xiao-Jing Zhang1
1Department of Bone and Soft Tissue
Surgery, Cancer Hospital of China Medical University, Liaoning Cancer Hospital and Institute, Shenyang, Liaoning
110042, People’s Republic of China;
2Clinical Laboratory, The First Affiliated
Hospital of China Medical University,
Shenyang, Liaoning 110042, People’s
Republic of China;3Department of
Radiotherapy, Cancer Hospital of China Medical University, Liaoning Cancer Hospital and Institute, Shenyang, Liaoning
110042, People’s Republic of China;
4Department of Physiology, Army
Medical University, Chongqing 400038,
People’s Republic of China
*These authors contributed equally to this work
Background:Nutritional and immune status is paramount for the overall survival (OS) of patients with advanced osteosarcoma. Comprehensive prognostic predictors based on the two indices are scarce. This study aimed to construct and validate individualized web dynamic nomograms based on CONUT score or/and peripheral blood CD4+/CD8+ ratio for OS in patients with advanced osteosarcoma.
Materials and Methods: The clinical data of 376 advanced osteosarcoma patients from January 2000 to December 2019 were retrospectively collected. Data from the 301 patients (diagnosed in the first 15 years) were used as the development set and data from the remaining 75 patients were assigned as the validation set. Multivariate Cox regression analyses were conducted and three prediction models were constructed, namely, CD4 +/CD8+ ratio univariate model (model 1), CONUT score univariate model (model 2), and CD4+/CD8+ ratio plus CONUT score (model 3). These models were visualized by conven-tional nomograms and individualized web dynamic nomograms, and their performances were further evaluated by C-index, calibration curve, receiver operating characteristic (ROC) curve, and decision curve analysis (DCA), respectively.
Results:In multivariate Cox analysis, age, metastasis, ALP, CD4+/CD8+ ratio, chemother-apy, and CONUT score were identified as independent prognostic factors for OS. The calibration curves of the three models all showed good agreement between the actual observation and nomogram prediction for 1-year overall survival. In the development set, the C-index and area under the curve (AUC) of model 3 (0.837, 0.848) were higher than that of model 1 (0.765, 0.773) and model 2 (0.712, 0.749). Similar trends were observed in the validation set. The net benefits of model 3 were better than the other two models within the threshold probability of 36–80% in DCA.
Conclusion: CONUT score and peripheral CD4+/CD8+ ratio are easily available, reliable, and economical prognostic predictors for survival prediction and stratification in patients with advanced osteosarcoma, but the two predictors combined can establish a better prog-nosis prediction model.
Keywords:CONUT score, osteosarcoma, survival, nomogram
Introduction
Osteosarcoma is a highly malignant mesenchymal tumor that primarily occurred in bone and characterized by adolescent onset, obvious disease heterogeneity, and high susceptibility of early lung metastasis.1The development and utilization of modern Correspondence: Xiao-Jing Zhang
Department of Bone and Soft Tissue Surgery, Cancer Hospital of China Medical University, Liaoning Cancer Hospital and Institute, Shenyang, Liaoning
110042, People’s Republic of China
Email zhangxiaojing@cancerhosp-ln-cmu. com
Cancer Management and Research
Dove
press
open access to scientific and medical research
Open Access Full Text Article
Cancer Management and Research downloaded from https://www.dovepress.com/ by 118.70.13.36 on 24-Aug-2020
multidisciplinary therapy (MDT) have significantly improved the prognosis of osteosarcoma, and the 5-year overall survival (OS) rate has significantly increased from less than 20% to approximately 70% in patients with non-metastatic disease.2,3 However, regarding patients with metastatic osteosarcoma, not all the patients can benefit from MDT due to the heterogeneity of the disease, and the prognosis was still dismal, with the 5-year survival rate being less than 30%.4One of the primary obstacles for this failure was the lack of effective and reliable prognostic predictive biomarkers to guide pre-treatment risk stratifi -cation and treatment protocol selection.
A series of factors have revealed their predictive or prognostic values in multiple malignancies and they can be roughly categorized into two types: traditionally estab-lished prognostic factors and newly-identified predictive factors. Clinicopathologic features, inflammatory indices, nutritional indices, immune indices, and metabolic indices were the most commonly used and conventionally estab-lished prognostic indicators.5–10 In contrast, some differ-entially expressed and tissue-specific proteins, micro-RNAs (mimicro-RNAs), long non-coding micro-RNAs (lncmicro-RNAs), and circular RNAs (circRNAs) can also serve as reliable prognosticators in various neoplasms.11–14 It is undoubt-edly that all these predictors inherently and ineluctably harbor their merits and drawbacks. Generally, traditionally established predictors are more accessible and affordable than the newly-identified prognosticators, but they cannot rival the latter in predictive specificity and accuracy. Therefore, how to identify an ideal prognostic predictor is a hard nut pending to be conquered. An economic and pragmatic approach to circumvent such dilemma is to establish new prognostic predictors with the currently identified prognosticators.
For patients with advanced malignant diseases, nutri-tional and immune status is the most pivotal prognostic factors for survival.15,16 A favorable nutritional condition is the prerequisite to perform any therapeutic regimen, such as chemotherapy, radiotherapy, or targeted therapy. Malnourished patients usually cannot withstand these treatments and thus are more prone to obtain worse out-comes. Actually, malnutrition or undernourishment is an already identified prognosticator for unfavorable outcomes in various malignancies, including osteosarcoma.17–20The Controlling Nutritional Status (CONUT) score, calculated from serum albumin, total cholesterol, and total lympho-cyte counts (TLC), is an objective nutrition scoring system that has been extensively utilized to assess nutritional
status in various malignant diseases, such as renal cell carcinoma, hepatocellular carcinoma, and gastric cancer.21–24 A notable advantage of this scoring system is that all the data for its constituent parameters can be readily calculated from routine biochemical or blood tests, and their dynamic changes can be easily monitored by clinicians. Unfortunately, although CONUT score is a reliable prognosticator for various cancers, its prognostic and predictive significance in osteosarcoma remains undetermined.
Immune function, another vital prognosticator for advanced neoplasms, participates in multiple biological processes of tumors, including tumorigenesis, progression, and metastasis. Numerous immune predictors have exhib-ited their prognostic values in cancers, including absolute lymphocyte count (ALC), platelet–lymphocyte ratio (PLR), lymphocyte–monocyte ratio (LMR), neutrophil– lymphocyte ratio (NLR), peripheral blood lymphocyte subsets analysis (PBLSA), tumor-infiltrating lymphocytes (TILs), tumor-associated macrophages (TAMs), and other immune infiltrations in the tumor microenvironment (TME).25–34 Regarding osteosarcoma, higher NLR or PLR, and lower LMR or ALC were significantly asso-ciated with inferior outcomes.25–27 Besides, pre-treatment intratumoral CD8+/FOXP3+-ratio≤3.08, decreased circu-lating CD8+ T cells to T-regulatory cells (Tregs) (CD8 +/Tregs) ratio, or increased percentage of peripheral blood CD4+CXCR5+ T cells usually portend unfavorable survival or metastasis, while early recovery of peripheral blood lymphocytes during chemotherapy is associated with better prognosis in osteosarcoma.1,28,35 Among all these immune prognostic predictors, PBLSA is the most convenient and pragmatic prognosticator for tumors. Especially, CD4+/CD8+ ratio, a commonly used parameter of PBLSA, has already revealed its prognostic values in various tumors, including laryngeal cancer, renal cell car-cinoma, melanoma, and breast cancer.36–39However, simi-lar to CONUT score, the clinical significance of CD4 +/CD8+ ratio in osteosarcoma also remains uncertain.
Given the paramount role of immunity and nutrition, as well as the potent prognostic values of CONUT score and CD4+/CD8+ ratio in other malignancies, it is reasonable to speculate that prognostic systems based on them may harvest optimal and reliable predictive performances in osteosarcoma. Therefore, our study aimed to study the predictive and prognostic values of CONUT score or/and peripheral blood CD4+/CD8+ ratio-based prediction mod-els in patients with advanced osteosarcoma.
Cancer Management and Research downloaded from https://www.dovepress.com/ by 118.70.13.36 on 24-Aug-2020
Patients and Methods
Patient Selection and Study Design
This retrospective observational study was scrutinized and approved by the ethical committee of Cancer Hospital of China Medical University (also named Liaoning Cancer Hospital and Institute). The requirement for informed con-sent was waived in this study due to the nature of retro-spective design and anonymization of the data. By reviewing the electronic medical records, the clinical data of 376 advanced osteosarcoma patients admitted to the department of bone and soft tissue surgery from January 2000 to December 2019 were retrospectively col-lected. Inclusion criteria of participants were as follows: (i) pathologically confirmed as osteosarcoma; (ii) the exis-tence of at least one metastatic lesion beyond the primary tumor site determined by the image examination or with late stage disease; and (iii) with detailed and completed extractable medical data and were not lost to follow-up. Patients who met the following criteria were excluded from the study: (i) any history of other malignancies; (ii) pulmonary nodules or metastatic lesions derived from other malignant diseases; and (iii) incomplete or unextract-able medical data and laboratory results.
In this study, 301 patients from January 2000 to December 2014 were utilized as the development set, while the remaining 75 patients from January 2014 to December 2019 were assigned as the validation set.
CONUT Score De
fi
nition and Peripheral
Blood Lymphocyte Subsets Analysis
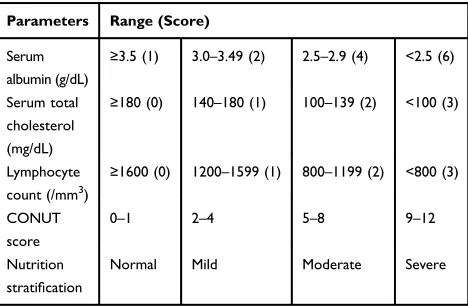
CONUT score is a comprehensive nutritional and immune index calculated from serum albumin, serum total choles-terol concentration, and peripheral TLC, as previously reported.40 The three constituent parameters of CONUT score were scored based on the cut-off values reported in previous studies,41–43 and the sum of the score was the CONUT score. Patients were stratified into four groups according to the CONUT score listed in Table 1.Peripheral whole blood samples were taken before breakfast in the morning and collected into heparinized tubes for PBLSA. Before the conduction of flow cyto-metric analysis, a series of treatments for heparinized blood were performed, including mixed withfl uorescence-labeled monoclonal antibodies, incubated for 30 minutes, washed by phosphate-buffered saline (PBS), centrifuged at 1500 rpm for 5 minutes, discarded the supernatant and resuspended the remaining pellet. Finally, an eligible
sample was obtained for flow cytometric analysis. The examinations for each patient were performed three times and the average of the three outcomes was used forfinal statistical analysis. The detailed steps for PBLSA can refer to the descriptions in relevant literature.44–46
Data Collection
The baseline demographics and variables listed below were obtained at diagnosis, including age, gender, NLR, PLR, metastasis, primary tumor site, tumor size, alkaline phospha-tase (ALP), anti-angiogenesis therapy, peripheral blood CD4 +/CD8+ ratio, chemotherapy, and CONUT score.
Follow-Up
The follow-up started when the patients were diagnosed with advanced, late stage, or metastatic disease, and it ended until death or December 2019. The end-point for this study was overall survival (OS), which can be calcu-lated from the date of the initial diagnosis of advanced or metastatic disease to death (event) from any cause or the last date of follow-up (censored).
Statistical Analyses
Patient Characteristics and Continuous Variable Grouping
The Shapiro–Wilk test was conducted to determine the normal-ity of the measurement data. The continuous variables were presented as median (interquartile range) while the categorical variables were presented as frequencies (percentages).
Comparisons of clinical characteristics between the development set and validation set were conducted by Fisher’s exact test or chi-squared test for categorical data, and Wilcoxon’s rank-sum test for measurement data. Table 1The Details of CONUT Score
Parameters Range (Score)
Serum
albumin (g/dL)
≥3.5 (1) 3.0–3.49 (2) 2.5–2.9 (4) <2.5 (6)
Serum total
cholesterol
(mg/dL)
≥180 (0) 140–180 (1) 100–139 (2) <100 (3)
Lymphocyte
count (/mm3)
≥1600 (0) 1200–1599 (1) 800–1199 (2) <800 (3)
CONUT
score
0–1 2–4 5–8 9–12
Nutrition
stratification
Normal Mild Moderate Severe
Abbreviation:CONUT score, controlling nutritional status score.
Cancer Management and Research downloaded from https://www.dovepress.com/ by 118.70.13.36 on 24-Aug-2020
For the continuous variables of age, NLR, PLR, ALP and CD4+/CD8+ ratio, their optimal cut-off points were identified by the method of the receiver operating charac-teristic (ROC) curve analyses based on the maximal Youden’s index. These variables were then dichotomized into two groups based on the optimal cut-off points. The survival differences between groups for the variables of CD4+/CD8+ ratio and CONUT score were examined by the Kaplan–Meier survival curve and Log-rank test.
Model Construction and Visualization
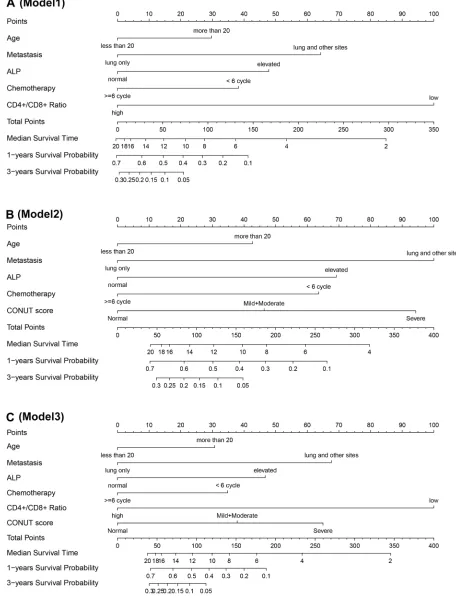
The Cox proportional hazards model and the stepwise selection method based on minimal Akaike information criterion (AIC) were used to determine thefinal predictors from the potential variables. The Schoenfeld residual plots and variance inflation factor (VIF) were also performed to examine the Cox proportional hazards model assumption and multicollinearity of variables, respectively. Based on the results from Cox analyses, three predictive models (Model 1–3) and nomograms to predict median survival time (MST), 1-year survival probability, and 3-year survi-val probability were constructed. Furthermore, the three predictive models were visualized in two ways, including conventional nomograms and the newly developed inter-active web dynamic nomograms.
Model Evaluation
After the establishment of the nomograms, their predictive performances were evaluated, including discrimination and calibration. Discrimination represents the ability to distinguish survivors from non-survivors at specific time nodes, which is often evaluated by plotting the ROC curve and then calculating and comparing its related parameters, such as the area under curve (AUC). Therefore, wefirstly drew three ROC curves at the time point of 1-year overall survival and then calculated its related evaluating indices of the three models in the development and validation cohort, including AUC, sensitivity (Sen), specificity (Spe), positive predictive value (PV+), negative predictive value (PV-), positive likelihood ratio (LR+), and negative likelihood ratio (LR-). Moreover, the Harrell’s concor-dance index (C-index) was also calculated and compared among the three models in both sets.
The calibration curves were also plotted to assess the concordance between the predicted survival and observed survival. Furthermore, decision curve analysis (DCA) was utilized to compare the performance and superiority of the three predictive models. Besides, survival differences in
the entire cohort based on quartile groupings of the total predictive scores calculated from the three established prediction models were also compared.
Software
All statistical analysis was performed by R software (ver-sion 3.6.0) with the assistance of several essential R packages, including rms, foreign, nomogramEx, stdca. R, survival, survminer, survivalROC, pROC, dplyr, pec, devtools, DynNom, shiny, rsconnect, and ggplot2 package. A two-tailed P-value lower than 0.05 was considered as statistically significant.
Results
Patient Characteristics
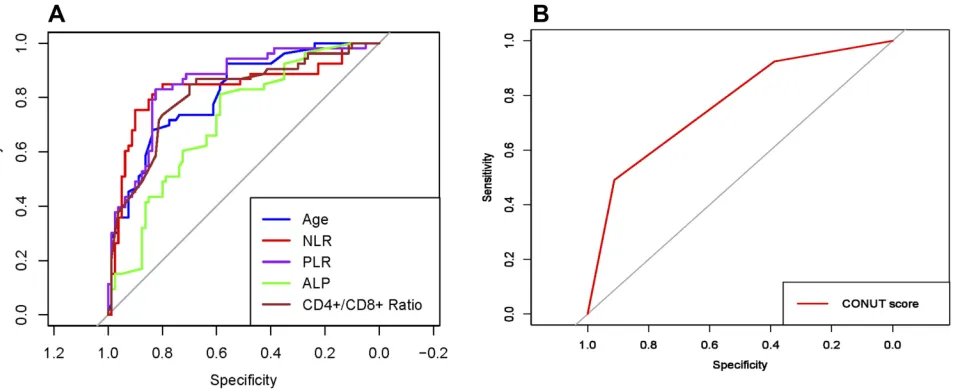
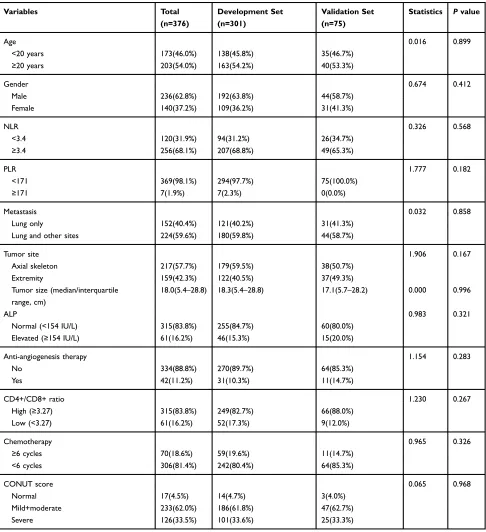
The ROC curves for variables of age, NLR, PLR, ALP, CD4+/CD8+ ratio, and CONUT score are presented in Figure 1. The optimal cut-off points for the first five continuous variables were 20, 3.4, 171, 154, and 3.27, respectively. The clinical characteristics of the develop-ment and validation set are presented in Table 2. A total of 376 advanced osteosarcoma patients were finally enrolled in this study, including 301 patients in the devel-opment set and 75 patients in the validation set. In the development set, the median follow-up time was 8.9 months (range: 0.5–90.1 months) and the median survival time was 8.1 months (95% CI: 6.1–10.7 months). In the validation set, the median follow-up time and the median survival time were 8.6 months (range: 0.5–88.7 months) and 8.2 months (95% CI: 5.7–11.6 months), respectively. No significant differences were found among all the vari-ables between the development set and validation set (all
P>0.05).
Identi
fi
cation of Prognostic Factors,
Construction, and Visualization of
Predictive Models
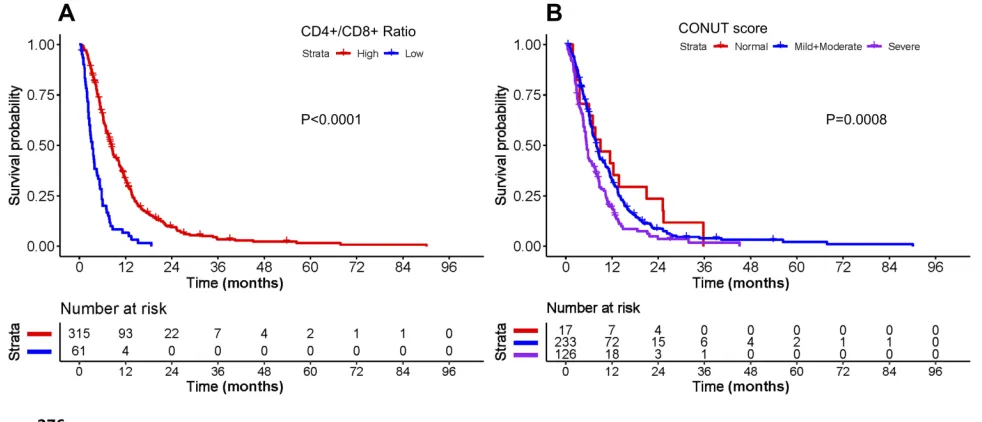
The results of univariate and multivariate Cox regression analysis for overall survival are shown inTable 3. In the univariate Cox regression analyses, variables of age (P=0.022), gender (P=0.027), NLR (P=0.033), metastasis (P=0.000), ALP (P=0.000), anti-angiogenesis therapy (P=0.000), CD4+/CD8+ ratio (P=0.000), chemotherapy (P=0.000) and CONUT score (P=0.002) were significantly associated with OS in the development set. The Kaplan– Meier analyses and Log-rank tests for CD4+/CD8+ ratio and CONUT score also confirmed the results from
Cancer Management and Research downloaded from https://www.dovepress.com/ by 118.70.13.36 on 24-Aug-2020
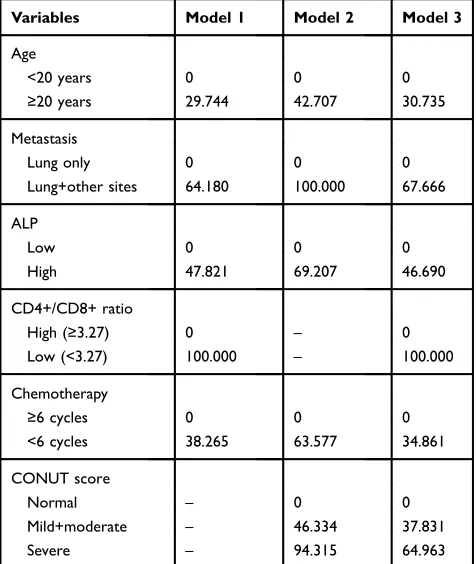
univariate Cox analysis. The survival curves of the two variables are shown in Figure 2. Regarding multivariate Cox regression analyses, age (P=0.000), metastasis (P=0.000), ALP (P=0.004), CD4+/CD8+ ratio (P=0.000), chemotherapy (P=0.001) and CONUT score (P=0.000) were confirmed as independent prognostic factors for OS. Three prediction models were established to predict the MST, 1-year, and 3-year survival probability in patients with advanced osteosarcoma. The details of the parameters of the three models are presented inTable 4, and the detailed point for each predictor included in the prediction models is shown inTable 5. Furthermore, the variables used to establish pre-diction models together with websites for web dynamic nomograms are presented in Table 6. In this study, two methods were used to visualize the three predictive models, including conventional nomograms and the newly developed interactive web dynamic nomograms. The conventional nomograms are presented inFigure 3, and the websites for interactive web dynamic nomograms are shown inTable 6.
Prediction Model Validation and
Performance Assessment
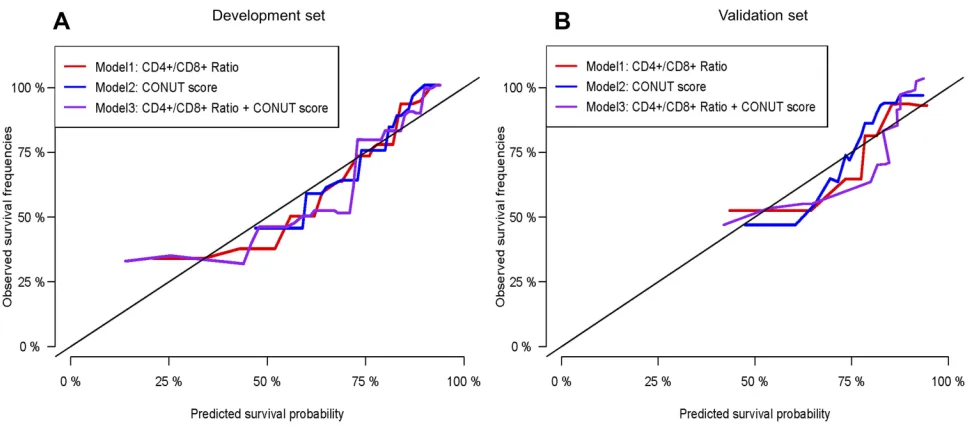
Calibration curves to predict the 1-year OS probability in both sets are plotted and shown inFigure 4. All calibration curves showed good consistency between the actual survi-val and nomogram predicted survisurvi-val. ROC curves and its related parameters were also performed to further validate the discrimination ability of three prediction models at the time point of 1-year OS. The ROC curves are shown in
Figure 5 and the parameters reflecting the accuracy of ROC curves are presented inTable 7.
In the development set, the C-indexes of model 1, model 2 and model 3 were 0.765 [95% CI, 0.712–0.828], 0.712 [95% CI, 0.738–0.908] and 0.837 [95% CI, 0.735–0.908], respectively, and significant differences were found among the three models (model 1 vs model 2,P=0.043; model 3 vs model 1,P=0.015; model 3 vs model 2, P=0.003). In the validation set, the C-indexes of the three models were 0.771 [95% CI, 0.654–0.827], 0.723 [95% CI, 0.667–0.876] and 0.841 [95% CI, 0.766–0.927], respectively. Similar trends in the differences of C-indexes were also found for the three models (model 1 vs model 2,P=0.047; model 3 vs model 1,
P=0.023; model 3 vs model 2,P=0.004).
Decision Curve Analysis
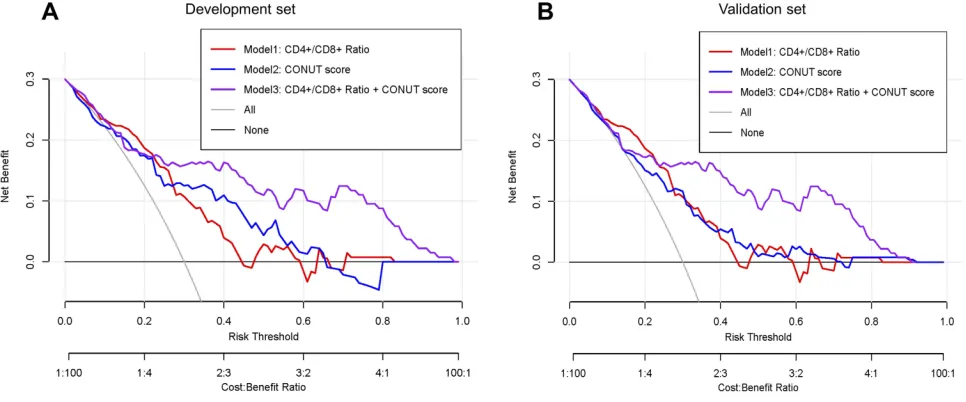
Figure 6 illustrates the decision curve analyses of three prediction models to discriminate survivors and non-survivors at the time point of 1-year OS. All models remained effective and reliable between the threshold probabilities of 36–80%, and the net benefit for model 3 was better than that of the other two models within the same threshold probabilities.
Kaplan
–
Meier Survival Analysis Based on
Risk Strati
fi
cation
The entire cohort was categorized into four groups based on the quartiles of total prognostic scores calculated from the three predicting models. The Kaplan–Meier analyses Figure 1The receiver operating characteristic (ROC) curve analyses for (A) age, NLR, PLR, ALP, CD4+/CD8+ ratio, and (B) CONUT score.
Abbreviations: NLR, neutrophil to lymphocyte ratio; PLR, platelet to lymphocyte ratio; ALP, alkaline phosphatase; CD, cluster of differentiation; CONUT score, controlling nutritional status score.
Cancer Management and Research downloaded from https://www.dovepress.com/ by 118.70.13.36 on 24-Aug-2020
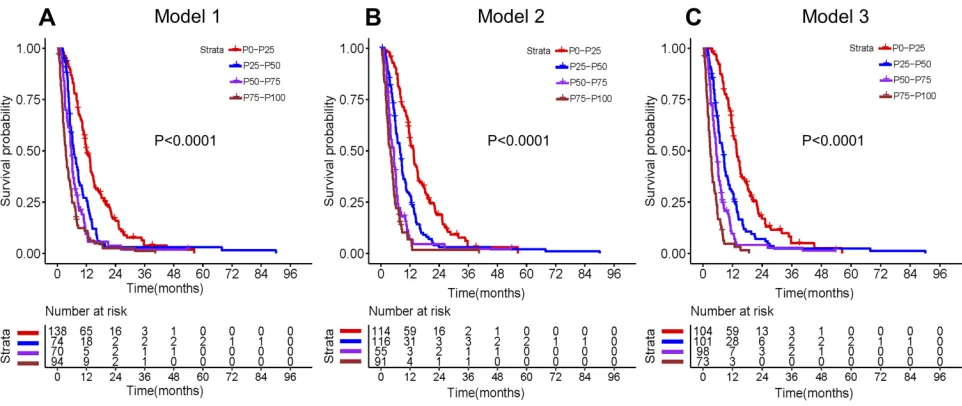
and Log-rank tests were performed to compare the differ-ences in OS among the four groups.Figure 7 presents the Kaplan–Meier survival curves for the three models based on quartile groupings. Significant differences in survival were found among the four subgroups in the three models (all P<0.001). However, survival curves of model 3
separate more significantly than those from the other two models, indicating a better discrimination ability.
Discussion
The present study is the first to elucidate the relationship between CONUT score and peripheral Table 2Baseline Characteristics of the Development Set and Validation Set
Variables Total
(n=376)
Development Set (n=301)
Validation Set (n=75)
Statistics Pvalue
Age 0.016 0.899
<20 years 173(46.0%) 138(45.8%) 35(46.7%)
≥20 years 203(54.0%) 163(54.2%) 40(53.3%)
Gender 0.674 0.412
Male 236(62.8%) 192(63.8%) 44(58.7%)
Female 140(37.2%) 109(36.2%) 31(41.3%)
NLR 0.326 0.568
<3.4 120(31.9%) 94(31.2%) 26(34.7%)
≥3.4 256(68.1%) 207(68.8%) 49(65.3%)
PLR 1.777 0.182
<171 369(98.1%) 294(97.7%) 75(100.0%)
≥171 7(1.9%) 7(2.3%) 0(0.0%)
Metastasis 0.032 0.858
Lung only 152(40.4%) 121(40.2%) 31(41.3%)
Lung and other sites 224(59.6%) 180(59.8%) 44(58.7%)
Tumor site 1.906 0.167
Axial skeleton 217(57.7%) 179(59.5%) 38(50.7%)
Extremity 159(42.3%) 122(40.5%) 37(49.3%)
Tumor size (median/interquartile range, cm)
18.0(5.4–28.8) 18.3(5.4–28.8) 17.1(5.7–28.2) 0.000 0.996
ALP 0.983 0.321
Normal (<154 IU/L) 315(83.8%) 255(84.7%) 60(80.0%)
Elevated (≥154 IU/L) 61(16.2%) 46(15.3%) 15(20.0%)
Anti-angiogenesis therapy 1.154 0.283
No 334(88.8%) 270(89.7%) 64(85.3%)
Yes 42(11.2%) 31(10.3%) 11(14.7%)
CD4+/CD8+ ratio 1.230 0.267
High (≥3.27) 315(83.8%) 249(82.7%) 66(88.0%)
Low (<3.27) 61(16.2%) 52(17.3%) 9(12.0%)
Chemotherapy 0.965 0.326
≥6 cycles 70(18.6%) 59(19.6%) 11(14.7%)
<6 cycles 306(81.4%) 242(80.4%) 64(85.3%)
CONUT score 0.065 0.968
Normal 17(4.5%) 14(4.7%) 3(4.0%)
Mild+moderate 233(62.0%) 186(61.8%) 47(62.7%)
Severe 126(33.5%) 101(33.6%) 25(33.3%)
Abbreviations:NLR, neutrophil to lymphocyte ratio; PLR, platelet to lymphocyte ratio; ALP, alkaline phosphatase; CD, cluster of differentiation; CONUT score, controlling nutritional status score.
Cancer Management and Research downloaded from https://www.dovepress.com/ by 118.70.13.36 on 24-Aug-2020
blood CD4+/CD8+ ratio and survival in patients with advanced osteosarcoma. We found that higher CONUT score and lower peripheral blood CD4+/CD8+ ratio was associated with shorter OS and increased risks of death. Both of the two indices can serve as prognostic predic-tors for OS, but the combined use of them can obtain better predictive performances. Especially, the most paramount prognosticators for advanced osteosarcoma
at present were integrated by a novel tool of interactive web dynamic nomogram, making it a more representa-tive and reflective predictor for survival prediction. Simultaneously, compared with previously identified prognostic predictors for osteosarcoma, the features of easy availability, high predictive performances, and con-veniences in dynamic monitoring of the two predictive indicators have fully exhibited their superiorities as Table 3Univariate and Multivariate Cox Regression Analyses for Overall Survival in the Development Set
Variables Univariate Analysis Multivariate Analysis
HR 95% CI Pvalue HR 95% CI Pvalue
Age 1.258 1.037–1.592 0.022 1.523 1.217–1.907 0.000
Gender 0.781 0.627–0.973 0.027 0.930 1.205–1.509 0.768
NLR 1.283 1.021–1.611 0.033 1.219 0.732–2.030 0.446
PLR 0.809 0.334–1.957 0.638 0.793 0.319–1.973 0.618
Metastasis 2.184 1.749–2.728 0.000 2.537 2.002–3.214 0.000
Tumor site 0.903 0.729–1.120 0.354 0.917 0.727–1.158 0.469
Tumor size 1.006 0.985–1.028 0.561 1.020 0.998–1.042 0.082
ALP 1.950 1.465–2.594 0.000 1.787 1.200–2.662 0.004
Anti-angiogenesis therapy 2.260 1.619–3.154 0.000 1.103 0.696–1.748 0.675
CD4+/CD8+ ratio 3.132 2.347–4.178 0.000 3.008 2.218–4.080 0.000
Chemotherapy 1.734 1.308–2.299 0.000 1.661 1.245–2.216 0.001
CONUT score 0.002 0.000
Normal Ref Ref Ref Ref
Mild+moderate 1.186 0.722–1.950 0.501 1.657 0.994–2.761 0.053
Severe 1.788 1.068–2.994 0.027 2.597 1.527–4.417 0.000
Abbreviations:NLR, neutrophil to lymphocyte ratio; PLR, platelet to lymphocyte ratio; ALP, alkaline phosphatase; CD, cluster of differentiation; HR, hazard ratio; Ref, reference; CONUT Score, controlling nutritional status score.
Figure 2Kaplan–Meier survival curves for overall survival based on (A) CD4+/CD8+ ratio and (B) CONUT score stratification. Abbreviations:CD, cluster of differentiation; CONUT score, controlling nutritional status score.
Cancer Management and Research downloaded from https://www.dovepress.com/ by 118.70.13.36 on 24-Aug-2020
pragmatic and cost-effective biomarkers for survival stratification in osteosarcoma.
Nutritional and immune status has been proven to cor-relate with therapeutic effects and long-term prognosis in various tumors, including osteosarcoma.5,6,20,47A series of nutrition- and immune-based indices or scoring systems were developed and utilized as prognostic predictors,6,48-51
with the CONUT score being the most commonly used one among them. As an immune-nutritional marker, CONUT score has included the information of serum levels of albu-min, cholesterol, and TLC. Albualbu-min, reflecting the protein synthesis ability of liver and forming a large proportion of all plasma protein, is the most abundant blood plasma protein. Serum albumin level is the most fundamental factor to evaluate a patient’s nutritional status, and it has been proven to significantly associate with the survival of multi-ple malignancies.52–55Cholesterol, another vital component of CONUT score, is also a major indicator of nutritional status and represents the lipid metabolism ability as well as a patient’s caloric reserves.56 By integrating into the Table 4Parameters of Each Variable Selected for the Three Models
Variables Model 1 Model 2 Model 3
Coef. HR(95% CI) Pvalue Coef. HR(95% CI) Pvalue Coef. HR(95% CI) Pvalue
Age 0.380 1.463(1.146–1.868) 0.002 0.355 1.427(1.116–1.825) 0.004 0.391 1.479(1.157–1.890) 0.001
Metastasis 0.821 2.274(1.769–2.922) 0.000 0.832 2.299(1.788–2.957) 0.000 0.861 2.367(1.839–3.048) 0.000
ALP 0.612 1.844(1.330–2.557) 0.000 0.576 1.779(1.280–2.473) 0.000 0.594 1.812(1.303–2.519) 0.000
Chemotherapy 0.489 1.632(1.199–2.222) 0.001 0.529 1.698(1.248–2.309) 0.000 0.444 1.559(1.142–2.126) 0.005
CD4+/CD8+ ratio 1.279 3.596(2.601–4.972) 0.000 – – – 1.273 3.574(2.581–4.948) 0.000
CONUT score
Mild+moderate – – – 0.385 1.471(0.844–2.563) 0.173 0.481 1.619(0.928–2.824) 0.089
Severe – – – 0.785 2.193(1.230–3.909) 0.007 0.827 2.287(1.284–4.075) 0.004
AIC 2524.100 2561.900 2516.7
Abbreviations:Coef, coefficient; HR, hazard ratio; CD, cluster of differentiation; ALP, alkaline phosphatase; AIC, Akaike information criterion; CONUT score, controlling nutritional status score.
Table 5 Detailed Point of Each Predictor in the Three Established Nomograms
Variables Model 1 Model 2 Model 3
Age
<20 years 0 0 0
≥20 years 29.744 42.707 30.735
Metastasis
Lung only 0 0 0
Lung+other sites 64.180 100.000 67.666
ALP
Low 0 0 0
High 47.821 69.207 46.690
CD4+/CD8+ ratio
High (≥3.27) 0 – 0
Low (<3.27) 100.000 – 100.000
Chemotherapy
≥6 cycles 0 0 0
<6 cycles 38.265 63.577 34.861
CONUT score
Normal – 0 0
Mild+moderate – 46.334 37.831
Severe – 94.315 64.963
Abbreviations:ALP, alkaline phosphatase; CD, cluster of differentiation; CONUT score, controlling nutritional status score.
Table 6 Variables Included in the Prediction Models and Websites for the Individualized Dynamic Nomograms
Model Variables Websites
Model 1 (Overall survival, Survival
status) ~ Age + Metastasis + ALP + Chemotherapy + CD4 +/CD8+ Ratio
https://conquerera.shi nyapps.io/
DynNomapp1/
Model 2 (Overall survival, Survival
status) ~ Age + Metastasis + ALP + Chemotherapy + CONUT Score
https://conquerera.shi nyapps.io/
DynNomapp2/
Model 3 (Overall survival, Survival
status) ~ Age + Metastasis + ALP + Chemotherapy + CD4 +/CD8+ Ratio + CONUT Score
https://conquerera.shi nyapps.io/
DynNomapp3/
Abbreviations:ALP, alkaline phosphatase; CD, cluster of differentiation; CONUT score, controlling nutritional status score.
Cancer Management and Research downloaded from https://www.dovepress.com/ by 118.70.13.36 on 24-Aug-2020
Figure 3Nomograms of the established three prediction models to predict median survival time, 1-, and 3-year survival probabilities. (A) CD4+/CD8+ ratio model (model 1); (B) CONUT score model (model 2); (C) combined model of CD4+/CD8+ ratio and CONUT score (model 3).
Abbreviations:ALP, alkaline phosphatase; CD, cluster of differentiation; CONUT score, controlling nutritional status score.
Cancer Management and Research downloaded from https://www.dovepress.com/ by 118.70.13.36 on 24-Aug-2020
specialized lipid-protein membrane micro-domains, choles-terol forms the signaling transduction machinery and parti-cipates in various biological processes of tumor cells, including cytoskeleton alteration, cell polarity, and angiogenesis.57–60 Similar to hypoalbuminemia, hypocho-lesterolemia is also associated with undesirable outcomes in numerous cancers, such as renal cell carcinoma, lung can-cer, hematologic malignancies, etc.61–64Furthermore, hypo-cholesterolemia can cripple the functions of immune cells by disturbing the normal operation of cell membrane
fluidity and obstructing cell surface receptors mobility.65It is noteworthy that cholesterol is the main difference between CONUT score and other prognostic markers. It is undeniable that albumin is the most prominent indicator for nutrition, but one obvious drawback for albumin is that its serum concentration can be easily influenced by inadequate nutrients intake, inflammation factor-induced exhaustion, and changes of body fluid volume. By contrast, serum cholesterol circumvents such weaknesses and remains much more stable. Therefore, the inclusion of cholesterol Figure 4The calibration plots of the established three prediction models to predict 1-year survival in the (A) development set and (B) validation set. The X-axis represents the predicted survival from the established prognostic models and the Y-axis reflects the actual survival in the real world. The color curve closest to the 45° tilting solid line symbolizes the most accurate prediction model and behave the best in predictive performance.
Abbreviations:CD, cluster of differentiation; CONUT score, controlling nutritional status score.
Figure 5The receiver operating characteristic (ROC) curve analyses of the three prediction models for 1-year survival in the (A) development set and (B) validation set. Abbreviations:CD, cluster of differentiation; CONUT score, controlling nutritional status score.
Cancer Management and Research downloaded from https://www.dovepress.com/ by 118.70.13.36 on 24-Aug-2020
into CONUT score can achieve optimization of this scoring system. The last important constituent parameter of CONUT score is TLC, which is an indicator of a patient’s immunocompetence and also a paramount player in anti-tumor immune response. TLC consists of numerous cell subsets, including CD4+ T cell, CD8+ T cell, NK cells,γδ T cells, B cells, Tregs, etc. TLC has been reported to be closely related to tumor activities and prognosis. Generally, quantity change or disproportionality of lymphocytes in peripheral blood or TME is a potent predictor for impaired tumor immunity. For example, reduced ratio of CD4+/CD8+ in TME,66 low densities of tumor-associated plasma cells,67 low ratio of FOXP3+/CD4+ TILs,68 and decreased ratio of intratumoral FOXP+ Tregs are all indi-cative of unfavorable prognosis in patients with neoplasms.69 Considering the strong associations between
albumin, cholesterol, and TLC and the prognosis in various tumors, it may be reasonable for us to speculate that a multidimensional prognosticator based on these predictors would also obtain optimal performances in survival predic-tion. Consistent with our anticipation, our study suggested that CONUT score was an independent risk factor for OS and a higher CONUT score was significantly correlated with shorter OS. Furthermore, a prediction model based on CONUT score also obtained favorable predictive perfor-mances, including a desirable C-index of 0.712 (95% CI: 0.738–0.908) and 0.723 (95% CI: 0.667–0.876) in the development and validation set, as well as good consistency between nomogram predicted survival and actual observed survival in both sets.
Scarce information can be found in previous studies that focused on elucidating the prognostic values of peripheral Table 7Accuracy of the Three Models to Predict 1-Year Survival Probability in Advanced Osteosarcoma Patients
Variable Model 1 Model 2 Model 3
Development Set Validation Set Development Set Validation Set Development Set Validation Set
Cut-off point 77.564 102.445 158.247 209.911 119.382 140.357
AUC 0.773 0.780 0.749 0.700 0.848 0.835
Sen (%) 0.927 0.818 0.683 0.613 0.707 0.779
Spe (%) 0.526 0.689 0.807 0.714 0.895 0.756
PV+ (%) 94.565 93.548 93.401 93.333 93.627 94.118
PV- (%) 11.965 15.909 10.577 15.556 11.340 17.073
LR+ 1.956 2.630 3.539 2.143 6.733 3.193
LR- 0.139 0.264 0.393 0.542 0.327 0.292
Abbreviations:AUC, area under curve; Sen, sensitivity; Spe, specificity; PV+, positive predictive value; PV-, negative predictive value; LR+, positive likelihood ratio; LR-, negative likelihood ratio.
Figure 6Decision curve analysis of the three prediction models in the (A) development set and (B) validation set. Abbreviations:CD, cluster of differentiation; CONUT score, controlling nutritional status score.
Cancer Management and Research downloaded from https://www.dovepress.com/ by 118.70.13.36 on 24-Aug-2020
blood or intratumoral lymphocyte subsets in sarcomas. Our study was thefirst to uncover the prognostic significance of peripheral blood CD4+/CD8+ ratio in osteosarcoma. In sum-mary, the prognostic values of lymphocyte subsets for tumors mainly display in three aspects: quantitative changes, distur-bance of proportions, and aberrant gene expression profile. Usually, increased circulating or intratumoral immunosup-pressive immune cells or decreased immunity-boosting lym-phocytes are more prone to result in undesirable OS. Similarly, a ratio of two specific lymphocyte subsets within which anti-tumor lymphocytes predominate over pro-tumor lymphocytes is also more likely to obtain a shorter OS. For example, elevated intratumoral CD163+ M2-type TAM,31 lower intratumoral CD8+ cytotoxic lymphocytes,32 intratu-moral CD8+/FOXP3+-ratio <3.08,1delayed peripheral lym-phocyte recovery,28decreased CD8+/Tregs ratio,35M1/M2 polarized-macrophages tilt to M2 subtype,34low CD4+/CD8 + ratio,38 and decreased pre-treatment TLC70 all forebode worse prognosis. In our study, we found that lower peripheral CD4+/CD8+ ratio was indicative of poorer prognosis, and prediction model based on CD4+/CD8+ ratio and clinical features has revealed good predictive performances for patients with advanced osteosarcoma. Noteworthily, although CONUT score has taken TLC into consideration to reflect a patient’s immune status, the information obtained from TLC is rather rough, inadequate, and imprecise for the reason that TLC is composed of various cell subsets. Given this, the information from the overall change of TLC pro-vided by CONUT score is rather limited. To guide clinical
decisions, more elaborate information about the dynamic variations of lymphocyte subsets is thus needed. In this context, we attempt to integrate CONUT score and peripheral CD4+/CD8+ ratio together to establish a new prognostic prediction model. Fortunately, the combined model (model 3) of CONUT score, peripheral CD4+/CD8+ ratio, and clinical parameters behaves better in prediction perfor-mances than prediction models based on CONUT score or peripheral CD4+/CD8+ ratio only, which can be deduced from the following facts. Firstly, the combined model gets admirable accuracy in calibration plots when compared with that from the other two prediction models. Secondly, the combined model has reached higher AUCs of 0.848 and 0.835 in the development set and validation set as opposed to relatively lower AUCs of 0.773 and 0.780 in model 1, and 0.749 and 0.700 in model 2, respectively. Thirdly, the com-bined model has shown better ability in risk stratification based on the quartiles of total prediction scores calculated from the established prediction models. Finally, model 3 obtains better net benefit than the other two models within the same threshold probabilities of 36–80%. All these facts mentioned above suggested that CONUT score combined with peripheral CD4+/CD8+ ratio was an ideal prognostic biomarker for survival prediction in patients with advanced osteosarcoma.
The precise mechanisms for the negative correlation of lower CD4+/CD8+ ratio and unfavorable OS in osteosar-coma remain uncertain, but preclinical and clinical evidences from other malignancies may account for this phenomenon. Figure 7Kaplan–Meier survival curves of the entire cohort stratified by the quartiles of the calculated total prognostic scores from the three prediction models. (A) CD4+/CD8+ ratio model (model 1); (B) CONUT score model (model 2); (C) combined model of CD4+/CD8+ ratio and CONUT score (model 3).
Abbreviations:CD, cluster of differentiation; CONUT score, controlling nutritional status score.
Cancer Management and Research downloaded from https://www.dovepress.com/ by 118.70.13.36 on 24-Aug-2020
Generally, except for the engagement of tumor neo-antigen and T-cell receptor, the initial activation of CD8+ cytotoxic lymphocytes induced anti-tumor immune response is also highly depended on the co-stimulatory signaling from CD4 + type 1 helper T cells (Th1). In other words, CD4+ T-cell help initiates and amplifies signals for primary CD8+ T-cell immunity via multiple ways, such as secretion of interleukin-2, expression of co-stimulating molecules B7, production of interleukin-12 and interferon-γ, and so on.71Therefore, per-ipheral and intratumoral ratio of CD4+/CD8+ T cells, as a surrogate marker of immunosenescence, may indepen-dently predict OS in patients with malignant diseases. Depletion or decrease of peripheral and intratumoral CD4+ T cells is more prone to inactivate the anti-tumor response and lead to deterioration and progression of the disease. Actually, various previous studies have already elucidated and verified that CD4+/CD8+ ratio can serve as independent prognostic predictors in multiple cancers, including laryngeal squamous cell carcinoma,45renal cell cancer,72 nasopharyn-geal carcinoma,46 gastric cancer,73 cervical cancer,74 etc. Similarly, our study also demonstrated that CD4+/CD8+ ratio is a reliable and accurate prognostic predictor for patients with advanced osteosarcoma.
Our study also exists several limitations. Firstly, due to the nature of retrospective analysis and single-institution study, a kind of selection bias may be inevitable. So, prospective and larger studies to further verify the general-izability of the established prognostic models in this study are necessarily needed. Secondly, although the relationship between peripheral blood CD4+/CD8+ ratio and survival in osteosarcoma has been clarified in this study, the asso-ciation of intratumoral CD4+/CD8+ ratio and survival still remains unclear. Thirdly, despite the advantages of easy availability and convenience in dynamic monitoring for CONUT score and peripheral CD4+/CD8+ ratio, it is undeniable that the two predictors are all non-specific predictive factors for osteosarcoma, which may unavoid-ably lose a partial of specificity in survival prediction. One possible way to improve the specificity is to incorporate some newly-identified specific biomarkers into these prog-nostic prediction models, such as tissue-specific mark pro-teins, miRNAs, lncRNAs, or circRNAs, but the feasibility still needs further verification.
In conclusion, CONUT score and peripheral CD4+/CD8+ ratio are easily available, reliable, and economical prognostic predictors for survival prediction and stratification in patients with advanced osteosarcoma, but the two predictors com-bined can establish a better prognosis prediction model.
Simultaneously, the newly developed interactive web dynamic nomogram based on CONUT score and peripheral CD4+/CD8+ ratio is a more convenient and practical tool for clinicians to perform individualized treatment decision-making and evaluate survival at the initial diagnosis.
Abbreviations
AIC, Akaike information criterion; ALC, absolute lym-phocyte count; ALP, alkaline phosphatase; C-index, con-cordance index; circRNAs, circular RNAs; CONUT score, controlling nutritional status score; DCA, decision curve analysis; EDTA, ethylenediaminetetraacetic acid; FACS, fluorescent activated cell sorting; LMR, lymphocyte– monocyte ratio; lncRNAs, long non-coding RNAs; LR-, negative likelihood ratio; LR+, positive likelihood ratio; McAb, monoclonal antibodies; MDT, multidisciplinary therapy; miRNAs, micro-RNAs; MST, median survival time; NK cell, natural killer cell; NLR, neutrophil– lym-phocyte ratio; OS, overall survival; PLR, platelet– lympho-cyte ratio; PV-, negative predictive value; PV+, positive predictive value; RBC, red blood cell; Sen, sensitivity; Spe, specificity; TAMs, tumor-associated macrophages; TILs, tumor-infiltrating lymphocytes; TLC, total lympho-cyte counts; TME, tumor microenvironment; Tregs, T-regulatory cells; VIF, variance inflation factor.
Data Sharing Statement
The datasets to replicate the results of this study are available from the corresponding author only on reason-able request.
Ethics Approval and Consent to
Participate
The present study was performed in accordance with the World Medical Association Declaration of Helsinki and was approved by the Ethics Committee of Cancer Hospital of China Medical University. This study was a retrospective study and all the data used for the final statistical analysis was anonymous. Therefore, informed consent from the enrolled patients was waived. The insti-tutional review board of our hospital gave ethical approval for this study.
Acknowledgments
The authors thank Dr Chen Tong from the Department of Bone and Soft Tissue Surgery at Cancer Hospital of China Medical University for providing assistance in data
Cancer Management and Research downloaded from https://www.dovepress.com/ by 118.70.13.36 on 24-Aug-2020
collection and statistical analyses. We also thank KGSupport (http://www.kgsupport.com/) for English lan-guage editing. This work was supported by grants from the National Natural Science Foundation of China (No. 31371147).
Disclosure
The authors have no conflicts of interest to disclose in this work.
References
1. Fritzsching B, Fellenberg J, Moskovszky L, et al. CD8(+)/FOXP3(+)-ratio in osteosarcoma microenvironment separates survivors from non-survivors: a multicenter validated retrospective study.
Oncoimmunology.2015;4(3):e990800. doi:10.4161/2162402X.2014. 990800
2. Bacci G, Ferrari S, Bertoni F, et al. Long-term outcome for patients with nonmetastatic osteosarcoma of the extremity treated at the istituto ortopedico rizzoli according to the istituto ortopedico rizzoli/osteosarcoma-2 protocol: an updated report. J Clin Oncol.
2000;18(24):4016–4027. doi:10.1200/JCO.2000.18.24.4016 3. Isakoff MS, Bielack SS, Meltzer P, et al. Osteosarcoma: current
treatment and a collaborative pathway to success. J Clin Oncol.
2015;33(27):3029–3035. doi:10.1200/JCO.2014.59.4895
4. Harris MB, Gieser P, Goorin AM, et al. Treatment of metastatic osteosarcoma at diagnosis: a pediatric oncology group study.J Clin Oncol.1998;16(11):3641–3648. doi:10.1200/JCO.1998.16.11.3641 5. Tenardi RD, Frühwald MC, Jürgens H, et al. Nutritional status of
children and young adults with Ewing sarcoma or osteosarcoma at diagnosis and during multimodality therapy. Ped Blood Cancer.
2013;60(1):166. doi:10.1002/pbc.24304
6. Huang X, Hu H, Zhang W, et al. Prognostic value of prognostic nutritional index and systemic immune-inflammation index in patients with osteosarcoma. J Cell Physiol. 2019;234(10):1840 8–18414. doi:10.1002/jcp.28476
7. Liu B, Huang Y, Sun Y, et al. Prognostic value of inflammation-based scores in patients with osteosarcoma. Sci Rep. 2016;6:39862. doi:10.1038/srep39862
8. Chui MH, Kandel RA, Wong M, et al. Histopathologic Features Of Prognostic Significance In High-Grade Osteosarcoma.Arch Pathol Lab Med.2016;140(11):1231–1242. doi:10.5858/arpa.2015-0389-OA 9. Ren L, Hong ES, Mendoza A, et al. Metabolomics uncovers a link between inositol metabolism and osteosarcoma metastasis.
Oncotarget.2017;8(24):38541–38553. doi:10.18632/oncotarget.15872 10. Zhang Z, Qiu Y, Hua Y, et al. Serum and urinary metabonomic study
of human osteosarcoma. J Proteome Res. 2010;9(9):4861–4868. doi:10.1021/pr100480r
11. Shi JH, Hao YJ. DDX10 overexpression predicts worse prognosis in osteosarcoma and its deletion prohibits cell activities modulated by MAPK pathway. Biochem Biophys Res Commun. 2019;510 (4):525–529. doi:10.1016/j.bbrc.2019.01.114
12. Berlanga P, Mu OL, Piqueras M, et al. miR-200c and phospho-AKT as prognostic factors and mediators of osteosarcoma progression and lung metastasis. Mol Oncol. 2016;10(7):1043–1053. doi:10.1016/j. molonc.2016.04.004
13. Zhang Y, Meng W, Cui H. LncRNA CBR3-AS1 predicts unfavorable prognosis and promotes tumorigenesis in osteosarcoma. Biomed Pharmacother.2018;102:169–174. doi:10.1016/j.biopha.2018.02.081 14. Nie WB, Zhao LM, Guo R, et al. Circular RNA circ-NT5C2 acts as a potential novel biomarker for prognosis of osteosarcoma.Eur Rev Med Pharmco. 2018;22(19):6239–6244. doi:10.26355/eurrev_2018 10_16030
15. Gonda K, Shibata M, Sato Y, et al. Elevated neutrophil-to-lymphocyte ratio is associated with nutritional impairment, immune suppression, resistance to S-1 plus cisplatin, and poor prognosis in patients with stage IV gastric cancer. Mol Clin Oncol. 2017;7 (6):1073–1078. doi:10.3892/mco.2017.1438
16. van Bokhorst-de VDSM, von Blomberg-van DFB, Riezebos RK, et al. Differences in immune status between well-nourished and malnourished head and neck cancer patients. Clin Nutri. 1998;17 (3):107–111. doi:10.1016/s0261-5614(98)80003-4
17. Omura Y, Toiyama Y, Okugawa Y, et al. Crohn’s-like lymphoid reaction is associated with oncological prognosis and nutritional status in patients with pathological Stage II/III gastric cancer.Ann Surg Oncol.2020;27(1):259–267. doi:10.1245/s10434-019-07709-w 18. Tobberup R, Thoresen L, Falkmer UG, et al. Effects of current
parenteral nutrition treatment on health-related quality of life, physi-cal function, nutritional status, survival and adverse events exclu-sively in patients with advanced cancer: A systematic literature review. Crit Rev Oncol Hematol. 2019;139:96–107. doi:10.1016/j. critrevonc.2019.04.014
19. Kirov KM, Xu HP, Crenn P, et al. Role of nutritional status in the early postoperative prognosis of patients operated for retroperitoneal liposarcoma (RLS): a single center experience.Eur J Surg Oncol.
2019;45(2):261–267. doi:10.1016/j.ejso.2018.07.001
20. Takagi K, Umeda Y, Yoshida R, et al. Preoperative controlling nutri-tional status score predicts mortality after hepatectomy for hepato-cellular carcinoma. Digestive Surgery.2019;36(3):226–232. doi:10. 1159/000488215
21. Kang HW, Seo SP, Kim WT, et al. Prognostic impact of nutritional status assessed by the Controlling Nutritional Status (CONUT) score in patients with surgically treated renal cell carcinoma.Nutri Cancer.
2018;70(6):886–894. doi:10.1080/01635581.2018.1490448 22. Harimoto N, Yoshizumi T, Inokuchi S, et al. Prognostic significance
of preoperative Controlling Nutritional Status (CONUT) score in patients undergoing hepatic resection for hepatocellular carcinoma: a multi-institutional study.Ann Surg Oncol.2018;25(11):3316–3323. doi:10.1245/s10434-018-6672-6
23. Kuroda D, Sawayama H, Kurashige J, et al. Controlling Nutritional Status (CONUT) score is a prognostic marker for gastric cancer patients after curative resection. Gastric Cancer. 2018;21(2):20 4–212. doi:10.1007/s10120-017-0744-3
24. Takagi K, Yagi T, Umeda Y, et al. Preoperative Controlling Nutritional Status (CONUT) score for assessment of prognosis fol-lowing hepatectomy for hepatocellular carcinoma.World Journal of Surgery.2017;41(9):2353–2360. doi:10.1007/s00268-017-3985-8 25. Liu T, Fang XC, Ding Z, et al. Pre-operative
lymphocyte-to-monocyte ratio as a predictor of overall survival in patients suffering from osteosarcoma.FEBS Open Bio.2015;5:682–687. doi:10.1016/j. fob.2015.08.002
26. Xia WK, Liu ZL, Shen D, et al. Prognostic performance of pre-treatment NLR and PLR in patients suffering from osteosarcoma. World Journal of Surgical Oncology. 2016;14:127. doi:10.1186/s12957-016-0889-2
27. Vasquez L, Leon E, Beltran B, et al. Pretreatment neutrophil-to-lymphocyte ratio and neutrophil-to-lymphocyte recovery: independent prognostic factors for survival in pediatric sarcomas.J Pediatr Hematol Oncol.
2017;39(7):538–546. doi:10.1097/MPH.0000000000000911 28. De Angulo G, Hernandez M, Morales-Arias J, et al. Early
lympho-cyte recovery as a prognostic indicator for high-risk Ewing sarcoma.
J Pediatr Hematol Oncol. 2007;29(1):48–52. doi:10.1097/MPH.0b 013e31802d3e3e
29. Machado I, Lopez-Guerrero JA, Scotlandi K, et al. Immunohistochemical analysis and prognostic significance of PD-L1, PD-1, and CD8+ tumor-infiltrating lymphocytes in Ewing’s sar-coma family of tumors (ESFT). Virchows Archiv. 2018;472 (5):815–824. doi:10.1007/s00428-018-2316-2
Cancer Management and Research downloaded from https://www.dovepress.com/ by 118.70.13.36 on 24-Aug-2020
30. Heymann MF, Lezot F, Heymann D. The contribution of immune infiltrates and the local microenvironment in the pathogenesis of osteosarcoma.Cellular Immunology.2019;343:103711. doi:10.1016/ j.cellimm.2017.10.011
31. Han Q, Shi H, Liu F. CD163(+) M2-type tumor-associated macro-phage support the suppression of tumor-infiltrating T cells in osteosarcoma. Int Immunopharmacol. 2016;34:101–106. doi:10.10 16/j.intimp.2016.01.023
32. Gomez-Brouchet A, Illac C, Gilhodes J, et al. CD163-positive tumor-associated macrophages and CD8-positive cytotoxic lympho-cytes are powerful diagnostic markers for the therapeutic stratifi ca-tion of osteosarcoma patients: an immunohistochemical analysis of the biopsies from the French OS2006 Phase 3 trial.oncoimmunology.
2017;6(9):e1331193. doi:10.1080/2162402X.2017.1331193 33. Buddingh EP, Kuijjer ML, Duim RA, et al. Tumor-infiltrating
macro-phages are associated with metastasis suppression in high-grade osteosarcoma: a rationale for treatment with macrophage activating agents.Clin Cancer Res.2011;17(8):2110–2119. doi:10.1158/1078-0432.CCR-10-2047
34. Dumars C, Ngyuen JM, Gaultier A, et al. Dysregulation of macro-phage polarization is associated with the metastatic process in osteosarcoma. Oncotarget. 2016;7(48):78343–78354. doi:10.18632/ oncotarget.13055
35. Biller BJ, Guth A, Burton JH, et al. Decreased ratio of CD8+ T cells to regulatory T cells associated with decreased survival in dogs with osteosarcoma. J Veterinary Intern Med. 2010;24(5):1118–1123. doi:10.1111/j.1939-1676.2010.0557.x
36. Sevcikova L, Hunakova L, Chorvath B, et al. T-lymphocyte subsets (CD4/CD8 ratio) in breast cancer patients. Neoplasma. 1992;39 (4):219–222. PMID: 1436231.
37. Hernberg M, Muhonen T, Pyrhonen S. Can the CD4+/CD8+ ratio predict the outcome of interferon-alpha therapy for renal cell carcinoma?Ann Oncol.1997;8(1):71–77. doi:10.1023/a:1008293117223
38. Hernberg M, Muhonen T, Turunen JP, et al. The CD4+/CD8+ ratio as a prognostic factor in patients with metastatic melanoma receiving chemoimmunotherapy.J Clin Oncol.1996;14(5):1690–1696. doi:10. 1023/a:1008293117223
39. Hoesli R, Birkeland AC, Rosko AJ, et al. Proportion of CD4 and CD8 tumor infiltrating lymphocytes predicts survival in persistent/ recurrent laryngeal squamous cell carcinoma. Oral Oncol.
2018;77:83–89. doi:10.1016/j.oraloncology.2017.12.003
40. Ohba T, Takamori S, Toyozawa R, et al. Prognostic impact of the Controlling Nutritional Status score in patients with non-small cell lung cancer treated with pembrolizumab. J Thor Dis. 2019;11 (9):3757–3768. doi:10.21037/jtd.2019.09.29
41. Takagi K, Domagala P, Polak WG, et al. Prognostic significance of the controlling nutritional status (CONUT) score in patients under-going gastrectomy for gastric cancer: a systematic review and meta-analysis.BMC Surg.2019;19(1):129. doi:10.1186/s12893-019-0593-6
42. Xu H, Tan P, Jin X, et al. Validation of the preoperative controlling nutritional status score as an independent predictor in a large Chinese cohort of patients with upper tract urothelial carcinoma.Cancer Med.
2018;7(12):6112–6123. doi:10.1002/cam4.1902
43. Sun X, Luo L, Zhao X, Ye P. Controlling Nutritional Status (CONUT) score as a predictor of all-cause mortality in elderly hypertensive patients: a prospective follow-up study. BMJ Open.
2017;7(9):e15649. doi:10.1136/bmjopen-2016-015649
44. Hu FJ, Ge MH, Li P, et al. Unfavorable clinical implications of circulating CD44+ lymphocytes in patients with nasopharyngeal car-cinoma undergoing radiochemotherapy.Clin Chim Acta.2012;413 (1–2):213–218. doi:10.1016/j.cca.2011.09.026
45. Zhang D, Tang WJ, Tang D, et al. The ratio of CD4/CD8 T-cells in human papillomavirus-positive laryngeal squamous cell carcinoma accounts for improved outcome.Acta Oto-Laryngologica.2016;136 (8):826–833. doi:10.3109/00016489.2016.1164341
46. Tao CJ, Chen YY, Jiang F, et al. A prognostic model combining CD4/ CD8 ratio and N stage predicts the risk of distant metastasis for patients with nasopharyngeal carcinoma treated by intensity modu-lated radiotherapy.Oncotarget.2016;7(29):46653–46661. doi:10.18 632/oncotarget.9695
47. Loan B, Nakahara S, Tho BA, et al. Nutritional status and post-operative outcomes in patients with gastrointestinal cancer in Vietnam: a retrospective cohort study. Nutrition (Burbank, Los Angeles County, Calif). 2018;48:117–121. doi:10.1016/j.nut.2017. 11.027
48. Hu S, Chen L, Lin C, et al. The prognostic value of preoperative geriatric nutritional risk index in patients with pancreatic ductal adenocarcinoma.Cancer Manag Res. 2020;12:385–395. doi:10.21 47/CMAR.S229341
49. Li YJ, Yao K, Lu MX, et al. Prognostic value of the C-reactive protein to albumin ratio: a novel inflammation-based prognostic indicator in osteosarcoma.Onco Targets Ther.2017;10:5255–5261. doi:10.2147/OTT.S140560
50. Nakagawa N, Yamada S, Sonohara F, et al. Clinical implications of naples prognostic score in patients with resected pancreatic cancer.
Ann Surg Oncol. 2020;27(3):887–895. doi:10.1245/s10434-019-08 047-7
51. Galizia G, Auricchio A, de Vita F, et al. Inflammatory and nutritional status is a predictor of long-term outcome in patients undergoing surgery for gastric cancer. Validation of the Naples prognostic score.Ann Ital Chir.2019;90:404–416. PMID: 31814602.
52. Gupta D, Lis CG. Pretreatment serum albumin as a predictor of cancer survival: a systematic review of the epidemiological literature.Nutri J.2010;9:69. doi:10.1186/1475-2891-9-69
53. Willegger M, Posch F, Schieder S, et al. Serum creatinine and albumin predict sarcoma-specific survival in patients with myofi bro-blastic and fibroblastic sarcomas. J Orthopaedic Res. 2017;35 (12):2815–2824. doi:10.1002/jor.23598
54. Zhang J, Liu X, Yang Z, et al. The pretreatment albumin to globulin ratio, a validated biomarker, predicts prognosis in hepatocellular carcinoma.J Buon.2016;21(4):925–934. PMID: 27685915. 55. Cong L, Hu L. The value of the combination of hemoglobin,
albu-min, lymphocyte and platelet in predicting platinum-based chemor-adiotherapy response in male patients with esophageal squamous cell carcinoma. Int Immunopharmacol. 2017;46:75–79. doi:10.1016/j. intimp.2017.02.027
56. Gadgil MD, Anderson CA, Kandula NR, et al. Dietary patterns are associated with metabolic risk factors in South Asians living in the United States.J Nutri.2015;145(6):1211–1217. doi:10.3945/jn.114. 207753
57. Lee BH, Taylor MG, Robinet P, et al. Dysregulation of cholesterol homeostasis in human prostate cancer through loss of ABCA1.
Cancer Res. 2013;73(3):1211–1218. doi:10.1158/0008-5472.CAN-12-3128
58. Morales A, Mari M, Garcia-Ruiz C, et al. Hepatocarcinogenesis and ceramide/cholesterol metabolism. Anti Cancer Agents Med Chem.
2012;12(4):364–375. doi:10.2174/187152012800228689
59. Mandal CC, Rahman MM. Targeting intracellular cholesterol is a novel therapeutic strategy for cancer treatment. J Cancer Sci Ther.2014;6(12):510–513. doi:10.4172/1948-5956.1000316 60. Nelson ER, Chang C, McDonnell DP. Cholesterol and breast cancer
pathophysiology. Trends Endocrinol Metab. 2014;25(12):649–655. doi:10.1016/j.tem.2014.10.001
61. Muller CP, Wagner AU, Maucher C, et al. Hypocholesterolemia, an unfavorable feature of prognostic value in chronic myeloid leukemia.
Eur J Haematol.1989;43(3):235–239. doi:10.1111/j.1600-0609.1989. tb00288.x
62. Sok M, Ravnik J, Ravnik M. Preoperative total serum cholesterol as a prognostic factor for survival in patients with resectable non-small-cell lung cancer. Wiener klinische Wochenschrift. 2009;121(9– -10):314–317. doi:10.1007/s00508-009-1169-8
Cancer Management and Research downloaded from https://www.dovepress.com/ by 118.70.13.36 on 24-Aug-2020
63. Cucuianu A, Malide D, Petrov L, et al. Serum cholesterol and apoprotein B levels and serum cholinesterase activity in selected hematologic malignancies.ROM J Intern Med.1992;30(4):261–268. PMID: 1299417.
64. de Martino M, Leitner CV, Seemann C, et al. Preoperative serum cholesterol is an independent prognostic factor for patients with renal cell carcinoma (RCC).BJU Int.2015;115(3):397–404. doi:10.1590/ S1677-5538.IBJU.2019.0560
65. Gombos I, Kiss E, Detre C, et al. Cholesterol and sphingolipids as lipid organizers of the immune cells’plasma membrane: their impact on the functions of MHC molecules, effector T-lymphocytes and T-cell death. Immunol Lett. 2006;104(1–2):59–69. doi:10.1016/j. imlet.2005.11.021
66. Das D, Sarkar B, Mukhopadhyay S, et al. An Altered Ratio of CD4+ And CD8+ T lymphocytes in cervical cancer tissues and peripheral blood - a prognostic clue? Asian Pac J Cancer Prev. 2018;19 (2):471–478. DOI:10.22034/APJCP.2018.19.2.471
67. Yeong J, Lim J, Lee B, et al. High densities of tumor-associated plasma cells predict improved prognosis in triple negative breast cancer.Front Immunol.2018;9:1209. doi:10.3389/fimmu.2018.01209 68. Droeser R, Zlobec I, Kilic E, et al. Differential pattern and prognostic significance of CD4+, FOXP3+ and IL-17+ tumor infiltrating lym-phocytes in ductal and lobular breast cancers. BMC Cancer.
2012;12:134. doi:10.1186/1471-2407-12-134
69. Hanke T, Melling N, Simon R, et al. High intratumoral FOXP3(+) T regulatory cell (Tregs) density is an independent good prognosti-cator in nodal negative colorectal cancer. Int J Clin Exp Pathol.
2015;8(7):8227–8235. PMID: 26339391.
70. Suzuki R, Lin SH, Wei X, et al. Prognostic significance of pretreat-ment total lymphocyte count and neutrophil-to-lymphocyte ratio in extensive-stage small-cell lung cancer. Radiother Oncol. 2018;126 (3):499–505. doi:10.1016/j.radonc.2017.12.030
71. Bedoui S, Heath WR, Mueller SN. CD4 +T-cell help amplifies innate signals for primary CD8+T-cell immunity. Immunol Rev.2016;272 (1):52–64. doi:10.1111/imr.12426
72. Nishida K, Kawashima A, Kanazawa T, et al. Clinical importance of the expression of CD4+CD8+ T cells in Renal Cell Carcinoma.
Int Immunol.2020;32(5):347–357. doi:10.1093/intimm/dxaa004 73. Li F, Sun Y, Huang J, et al. CD4/CD8 + T cells, DC subsets, Foxp3,
and IDO expression are predictive indictors of gastric cancer prognosis. Cancer Med. 2019;8(17):7330–7344. doi:10.1002/cam4. 2596
74. Shah W, Yan X, Jing L, et al. A reversed CD4/CD8 ratio of tumor-infiltrating lymphocytes and a high percentage of CD4(+) FOXP3(+) regulatory T cells are significantly associated with clinical outcome in squamous cell carcinoma of the cervix. Cellular & Molecular Immunology.2011;8(1):59–66. doi:10.1038/cmi.2010.56
Cancer Management and Research
Dove
press
Publish your work in this journal
Cancer Management and Research is an international, peer-reviewed open access journal focusing on cancer research and the optimal use of preventative and integrated treatment interventions to achieve improved outcomes, enhanced survival and quality of life for the cancer patient.
The manuscript management system is completely online and includes a very quick and fair peer-review system, which is all easy to use. Visit http://www.dovepress.com/testimonials.php to read real quotes from published authors.
Submit your manuscript here:https://www.dovepress.com/cancer-management-and-research-journal
Cancer Management and Research downloaded from https://www.dovepress.com/ by 118.70.13.36 on 24-Aug-2020