http://www.sciencepublishinggroup.com/j/cbe doi: 10.11648/j.cbe.20180303.11
ISSN: 2578-8876 (Print); ISSN: 2578-8884 (Online)
Application of AMMI for Grain Yield Stability Analysis in
Large Speckled Bean Genotypes Grown in Midlands of
Bale Zone
Tadele Tadesse
*, Gashaw Sefera, Belay Asmare, Amanuel Teklaign
Oromia Agriculture Research Institute, Sinana Agriculture Research Center, Bale-Robe, Ethiopia
Email address:
*
Corresponding author
To cite this article:
Tadele Tadesse, Gashaw Sefera, Belay Asmare, Amanuel Teklaign. Application of AMMI for Grain Yield Stability Analysis in Large Speckled Bean Genotypes Grown in Midlands of Bale Zone. Chemical and Biomolecular Engineering. Vol. 3, No. 3, 2018, pp. 17-21. doi: 10.11648/j.cbe.20180303.11
Received: September 3, 2018; Accepted: September 14, 2018; Published: October 15, 2018
Abstract:
Genotypes–environment interaction was studied for grain yield of seventeen large speckled bean genotypes at Goro, Ginnir and Dellomena in the midlands of Bale zone for two consecutive years 2016 to 2017 main cropping season. Randomized complete block design with four replications was used for this study. Plot size of 6.4m2 (4 rows at 40cm spacing and 4m long) was used at all the tested locations. Yield stability is one of the setbacks facing plant breeders in developing widely adapted varieties with superior yield. The present study was carried out to investigate theeffect of genotype by environment (GxE) on the yield stability of speckled common bean using seventeen genotypes in six environments (Locations x years combination). The combined analysis of variance for mean grain yield revealed that highly significant variation for year, environment, genotypes, and Genotype by environment interaction. It revealed that 34.16% of the total variation was attributed to environment effect followed by genotypes 11.84%, and genotypes by environment interaction 2.97%. On the other hand the AMMI analysis for the grain yield revealed that 69.75% of the variation was due to environment effect followed by Genotypes (24.18) and GE (6.07%). AMMI 1 component explained 61.64% of the total interaction sum squares whereas AMMI 2 accounted for 38.36% of the variation. Of the tested genotypes G5 and G11 showed consistent stability across the testing environments showing slop value close to unity and deviation from regression near to zero with high mean grain yield. Therefore, these two genotypes were identified as candidate varieties to be verified in the coming cropping season for the possible releases in the midlands of bale zone and similar agro-ecologies.Keywords:
AMMI, Common Bean, GSI, Stability1. Introduction
Common beans (Phaseolus vulgaris L.) are the most important grain legume in nearly all lowland and mid altitude areas of Ethiopia. It is produced primarily by smallholder farmers both for cash and consumption. In 2014, it was cultivated by 3.34 million smallholders on 340 thousand hectare of land which is about 20% of total farm land allocated for pulses [8].
The concepts of GxE and yield stability have been issues to the breeders and biometricians for a long of time. A significant GxE for a quantitative trait is known to reduce the usefulness of the genotype means over all locations or
perform consistently, whether at high or low yield levels, across a wide range of environments [1]. The ultimate reason for differential stability among genotypes and for differential results from various test environments is non-repeatable G x E [37]. Several biometrical methods had been developed and used to analyze GEI, stability, and adaptability. But currently, AMMI and GGE models were considered models of the first choice for multi-location trials data analysis and which genotype won where pattern discovery [19, 23, 27, 34, 38]. Therefore the present study was used to identify stable, high yielding genotypes tested over environments using the AMMI model.
2. Materials and Methods
Seventeen Speckled bean genotypes were evaluated for two consecutive years 2016 to 2017 at the three midland districts of bale zone (Ginir, Goro and Dellomena) during main cropping season using randomized complete block design with four replications at all the testing sites. The plot size used was 6.4m2 (4 rows at 40cm spacing and 4m long). The two central rows were used as harvestable area to analysis the mean yield of the genotypes. Combined analysis
of variance least significant difference (LSD) multiple range test were done using Cropstat9 software. The AMMI analysis was performed using the model suggested by [11]. The stability parameters like regression coefficient (bi), deviation from regression were also calculated using Cropsta9 program. AMMI stability value (ASV) was computed by the model suggested by [31]:
ASV = SSIPCA1SSIPCA2 IPCA1 + IPCA2
A =Where, is the weight given to the IPCA1 value by dividing the IPCA1 sum squares by the IPCA2 sum of squares. The larger the IPCA score, either negative or positive, the more specifically adapted a genotype is to certain environments. Smaller ASV scores indicate a more stable genotype across environments.
Genotype Selection Index (GSI) also calculated by the formula suggested by [18]. Here it is calculated by taking the rank of mean grain yield of genotypes (RYi) across
environments and rank of AMMI stability value (RASVi).
GSIi= RASVi + RYi
Table 1. Lists of seventeen speckled bean genotypes used in the study.
Genotype Code Genotypes Genotype Code Genotypes
G1 DAB- 359 G10 DAB- 368
G2 DAB- 378 G11 DAB- 437
G3 DAB- 376 G12 DAB- 360
G4 DAB- 457 G13 DAB- 459
G5 DAB- 410 G14 DAB- 430
G6 DAB- 369 G15 Brown Speckled
G7 DAB- 375 G16 Cranscope
G8 DAB- 439 G17 Dame
G9 DAB- 417
3. Result and Discussion
The combined analysis of variance revealed that highly significant variation among the genotypes, environments and their interaction for mean grain yield at (P< 0.01%). Similar findings were reported by [3, 24, 35] for common bean varieties performance and their growing environments in Ethiopia. Furthermore, [2, 7, 10, 29-30, 33, 36] in previous studies, which found significant differences associated with the effects of genotypes, environments, and GE interactions when evaluating common bean genotypes in multi-environment trials in Brazil. The significant interactions of genotypes × environments (locations and years) suggest that grain yield of genotypes varied across the tested environments. Significant differences for genotypes, environments and GE interaction indicated the effect of environments in the GE interaction, genetic variability among the entries and possibility of selection for stable genotypes. [9] reported that GE interaction with location is more important than GE interaction with year. As GE interaction was significant, therefore we can further proceed
and estimate phenotypic stability [17]. Of the total variation observed, 34.16% was due to the environment followed by genotypes (11.84%), and GEI (10.63%) of the total sum squares (Table 2). The significant GL, GY, LY, and GLY were also indicated that the relative performance of lines at different locations and years was not similar.
Table 2. Combined ANOVA for 17 speckled bean genotypes.
Source of
Variation DF
Sums of Squares
Mean
Squares % explained
Year (Y) 1 14.4604 14.4604** 8.33
Location (L) 2 59.2928 29.6464** 34.16
Replication 3 1.37958 0.459861* 0.79
Genotype (G) 16 20.5561 1.28476** 11.84
Y X L 2 18.4517 9.22587** 10.63
L X G 32 5.16107 0.161283** 2.97
Y x L X G 48 11.0747 0.230722** 6.38
Residue 303 43.1778 0.142501** 24.88
Total 407 173.554
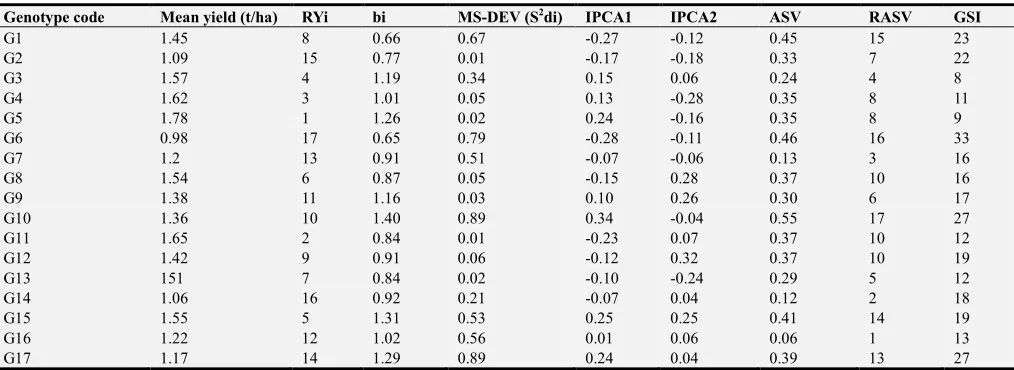
value (ASV) based on the AMMI model’s IPCA1 and IPCA2 (interaction principal components axes 1 and 2, respectively) scores for each genotype. Considering the ASV value, genotypes G16, G14, G7, G3, G13, G9, G2 and G5 showed the least ASV indication stability of these genotypes across the testing environments (Table 3). Since ASV only consider the IPCA score without taking into account the mean grain yield of the genotypes, stable genotypes identified using ASV may gave lower yield. Stability per se should however not be the only parameter for selection, because the most stable genotypes would not necessarily give the best yield performance [25-26] hence there is a need for approaches that incorporate both mean yield and stability in a single
index, that is why various authors introduced different selection criteria for simultaneous selection of yield and stability [4-5, 12-13, 16, 23 and 32].
Therefore, in order to solve this problem a new approach known as genotype selection index (GSI) was recommended by [16]. Using AMMI stability value and mean yield, GSI incorporates both mean yield and stability in a single criterion. Low value of this parameter shows desirable genotypes with high mean yield and stability [15]. Based on this Genotypes Selection Index (GSI), G3, G5, G4 and G11 were considered as the most stable genotypes with higher grain yield (Table 3).
Table 3. Mean yield First and second IPCA and various yield-stability statistics investigated in small red common bean.
Genotype code Mean yield (t/ha) RYi bi MS-DEV (S2di) IPCA1 IPCA2 ASV RASV GSI
G1 1.45 8 0.66 0.67 -0.27 -0.12 0.45 15 23
G2 1.09 15 0.77 0.01 -0.17 -0.18 0.33 7 22
G3 1.57 4 1.19 0.34 0.15 0.06 0.24 4 8
G4 1.62 3 1.01 0.05 0.13 -0.28 0.35 8 11
G5 1.78 1 1.26 0.02 0.24 -0.16 0.35 8 9
G6 0.98 17 0.65 0.79 -0.28 -0.11 0.46 16 33
G7 1.2 13 0.91 0.51 -0.07 -0.06 0.13 3 16
G8 1.54 6 0.87 0.05 -0.15 0.28 0.37 10 16
G9 1.38 11 1.16 0.03 0.10 0.26 0.30 6 17
G10 1.36 10 1.40 0.89 0.34 -0.04 0.55 17 27
G11 1.65 2 0.84 0.01 -0.23 0.07 0.37 10 12
G12 1.42 9 0.91 0.06 -0.12 0.32 0.37 10 19
G13 151 7 0.84 0.02 -0.10 -0.24 0.29 5 12
G14 1.06 16 0.92 0.21 -0.07 0.04 0.12 2 18
G15 1.55 5 1.31 0.53 0.25 0.25 0.41 14 19
G16 1.22 12 1.02 0.56 0.01 0.06 0.06 1 13
G17 1.17 14 1.29 0.89 0.24 0.04 0.39 13 27
AMMI Analysis
The AMMI model combines the analysis of variance for the genotype and environment main effects with principal components analysis of the G ×E interaction [20-21]. The grain yield data were subjected to combined analysis of variance and AMMI analysis which is a combination of analysis of variance and multiplication effect analysis. Briefly, analysis of variance is used to partition variance into three components: genotype deviations from the grand mean, environment deviations from the grand mean, and GE deviations from the grand mean. Subsequently, multiplication
effect analysis is used to partition GE deviations into different interaction principal component axes (IPCA), which can be tested for statistical significance through ANOVA. In this study, the analysis of variance for AMMI model reveled significant difference for genotypes, environment and GEI interaction. Accordingly, 69.75% of the total variation was attributed to environment followed by genotypes (24.18%) and GEI (6.07%) of the total sum squares. The AMMI model analysis had partitioned the GEI into the first two significant IPCAs with contributions of IPCA1 (61.64%) and IPCA2 (38.36%) (Table 4).
Table 4. Analysis of Variance for the AMMI Model.
SOURCE D. F. S. S. M. S. % TSS
Genotype 16 2.56952 0.160595** 24.18
LOCATIONS 2 7.4116 3.7058** 69.75
G X E 32 0.645134 0.02016** 6.07
AMMI COMPONENT 1 17 0.397688 0.023393** 61.64
AMMI COMPONENT 2 15 0.247446 0.016496** 38.36
TOTAL 50 10.6262
AMMI biplots were recently preferred biplots to visualize adaptability and stability of genotypes over test environments [19-22]. In AMMI1biplot, the genotypes with IPCA1 scores close to zero express general adaptation and the larger scores depict more specific adaptation in combination with environments of the same sign IPCA1
the vertical line passing through the origin is the grand mean. Accordingly, G12, G1, G13, G8, G15, G3, G4, G11 and G5 were gave mean grain yield above the grand mean. Environment Goro, gave the highest mean grain yield compared to the other sites since it is found in the right side of the figure 1. On the other hand those genotypes and environment which was found in the left side of the vertical line gave mean grain yield below the grand mean. Genotypes G6, G14 and G2 were more specifically adapted to Dellomena site whereas G7 and G16 were adapted to the other site, Ginir. G3, G4, G15 and G5 also more yield at Goro sites than the other sites.
Figure 1. Biplot analysis of GEI based on AMMI 1 for IPCA 1 score and mean grain yield of genotypes and environments.
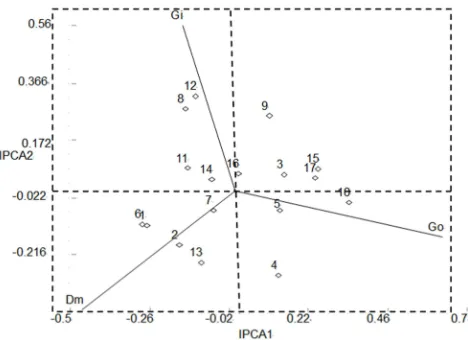
Figure 2. Biplot analysis of GEI based on AMMI 2 model for the first two IPCA scores.
The AMMI2 biplot (Figure 2) explained 100% of the GE interaction, making it a useful test for interaction. It was observed that most of the genotypes and environments were dispersed around the biplot. Genotypes farther from the centre of biplot show specific adaptation. In order to estimate specific adaptation and study their stability, biplot diagram was used. [26] in a study of genotype × environment interaction in durum wheat revealed that those genotypes which are far from the centre of biplot, have high G × E interaction and those genotypes that nearest to centre of biplot, have high stability. Thus, here in this study G7, G5,
G3, G11, G14 and G16 were more stable than the other genotypes since they were found near to the origin and have general adaptability. However, G7, G14 and G16 though they were stable, they gave grain yield below the grand mean. The other genotypes showed specific to the certain environments. for instance, G1, G2, G6 and G13 were more adapted to Dellomena whereas G4, G10, G15 and G17 were specifically adapted to site Goro. G8 and G12 were more favorable to site Ginir.
4. Conclusion
The results indicated that the yield performance of speckled bean genotypes was highly influenced by GE interaction effects; the magnitude of environment effect was about 2.88 times that of genotype effect. When the stability parameters like slop (bi), deviation from regression, ASV, GSI and mean grain yield take into consideration, out of the tested genotypes G5 and G11 were found to be more stable with high mean grain yield. Therefore, these two genotypes were identified as candidate genotypes to be verified for the possible release in the coming cropping season
Acknowledgements
Oromia Agricultural Research Institute for the financial support, Sinana Agricultural Research Center for providing all necessary facilities and Pulse and Oil Crops Research Case team staffs for trial management and data collection well acknowledge.
References
[1] Annicchiarico P. 2002. Genotype x environment interactions: challenges and opportunities for plant breeding and cultivar recommendations. FAO Plant Production and Protection Paper 174, FAO, Rome.
[2] Arke A, Zeleke F, and Amsalu B. 2016. AMMI and GGE Models Analysis of Stability and GEI of Common Bean (Phaseolus vulgaris L.)Lines in Ethiopia. Journal of Biology, Agriculture and Healthcare. 6(9): 127-135
[3] Asfaw A, T. Assefa, B. Amsalu, K. Negash, F. Alemayehu, and F. Grum. 2008. Adaptation and Yield Stability of small Red Bean Elite Lines in Ethiopia. International J. of Plant Breed. and Genet., 2(2): 51-63.
[4] Babarmanzoor A, Tariq MS, Ghulam A and Muhammad A. 2009. Genotype × environment interaction for seed yield in Kabuli Chickpea (CicerarietinumL.) genotypes developed through mutation breeding. Pak J Bot 41(4): 1883-1890 [5] Bajpai PK and Prabhakaran VT. 2000 A new procedure of
simultaneous selection for high yielding and stable crop genotypes. Indian J Genet 60: 141-146
[7] Carbonell SAM, AzevedoFilho JA, Dias LAS, Garcia AAF. 2004. Common bean cultivars and lines interactions with environments. Sci. Agric. 61: 169-177.
[8] Central Statistical Agency (CSA). 2014. Agricultural sample survey. Report on area and production of crop (private peasant holdings, meher season). vol. 1, CSA, Addis Abeba.
[9] Chandra S, Sohoo MS, and Singh KP. 1974 Genotype-environment interaction for yield in ram. J Res 8: 165-168 Crossa J (1990) Statistical analysis of multi-location trials. [10] Coimbra JLM, Carvalho FIF, Hemp S and Silva SA. 1999.
Adaptability and phenotypic stability of collor bean genotypes (Phaseolus vulgaris L.) in three different environments. Cienc. Rural 29: 441-448.
[11] Crossa J, Fox PN, Pfeiffer WH, Rajaram S, and Gauch HG. 1991. AMMI adjustment for statistical analysis of an international wheat yield trial. Theor. Appl. Genet 81:27-37. [12] Dashiell KE, Ariyo OJ and Bello L. 1994 Genotype x
environment interaction and simultaneous selection for high yield and stability in soybeans (Glycine max (L.) Men:). Ann ApplBiol 124: 133-139
[13] Eskridge KM. 1990. Selection of stable cultivars using a safety-first rule. Crop Sci 30: 369-374
[14] Ebdon, JS, Gauch HG. 2002. Additive main effect and multiplicative interaction analysis of national turfgrass performance trials: I. Interpretation of genotype x environment interaction. Crop Sci. 42: 489-496. Gauch, H. G., 2006. Statistical analysis of yield trials by AMMI and GGE. Crop Sci. 46: 1488-1500
[15] Farshadfar E, Mahmodi N, and Yaghotipoor A. 2011. AMMI stability value and simultaneous estimation of yield and yield stability in bread wheat (Triticumaestivum L.). AJCS 5(13):1837-1844
[16] Farshadfar E. 2008. Incorporation of AMMI stability value and grain yield in a single non-parametric index (GSI) in bread wheat. Pak J BiolSci 11(14): 1791-1796
[17] Farshadfar E and Sutka J. 2006. Biplot analysis of genotype-environment interaction in durum wheat using the AMMI model. ActaAgron Hung 54(4): 459–467
[18] Farshadfar E, Sutka J. 2003. Locating QTLs controlling adaptation in wheat using AMMI model. Cereal Res. Commun. 31:249-254.
[19] Gauch HG. 2006. Statistical analysis of yield trials by AMMI and GGE. Crop Sci. 46:1488-1500.
[20] GauchHG, and Zobel RW. 1988. Predictive and postdictive success of statistical analyses of yield trials. Theor. Applied Genet. 76: 1-10.
[21] Gauch HG and ZobelRW. 1996. AMMI Analysis of Yield Trials. In: Kang MS, Gauch HG eds) Genotype by environment Ineraction. CRC Press. Boca Raton, FL.
[22] Gauch HG, Piepho PH, and Annicchiarico P. 2008. Statistical analysis of yield trials by AMMI and GGE: further considerations. Crop Sci. 48: 866-889.
[23] Kang MS. 1993. Simultaneous selection for yield and stability in crop performance trials: Consequences for growers. Agron J 85: 754-757
[24] Mekbib F. 2003. Yield stability in common bean (Phaseolus vulgaris L.) genotypes. Euph. 130: 147-153.
[25] Mohammadi R, Abdulahi A, Haghparast R and Armion M. 2007. Interpreting genotype- environment interactions for durum wheat grain yields using non-parametric methods. Euphytica 157: 239–251
[26] MohammadiR, and Amri A. 2008. Comparison of parametric and non-parametric methods for selecting stable and adapted durum wheat genotypes in variable environments. Euphytica 159: 419–432
[27] Namaratu H, Miranda GV, Souza LV, Oliveira LR, and Delima RO. 2009. Comparing biplot multivariate analysis with Eberhart and Rusell method for genotype x environmentinteraction. Crop Breeding and Applied Biotechnology, 9: 299-307.
[28] Pham HN and Kang MS. 1988. Interrelationships among repeatability of several stability statistics estimated from international maize trials. Crop sci., 28, 925-928
[29] Pereira HS, Melo LC, Faria LC, Peloso MJD. 2009. Adaptability and stability of common bean genotypes with carioca grain type for central Brazil. PesquisaAgropecu. Bras. 44: 29-37.
[30] ]Pereira HS, Melo LC, Peloso MJD, and Faria LC. 2011. Complex interaction between genotypes and sowing seasons of carioca common bean in Goiás/Distrito Federal. Crop Breed. Appl. Biotechnol. 11: 207-215. Pham, H. N. and Kang, M. S. 1988. Interrelationships among and repeatability ofseveral stability statistics estimated from international maize trials. Crop Science 28: 925-928.
[31] Purchase JL, Hatting H. 2000. Genotype x environment interaction of winter wheat (Triticumaestivum L.) in South Africa: I. AMMI analysis of yield performance. S. Afr. 1. Plant Soil, 17(3):95-100.
[32] RaoAR, and Prabhakaran VT. (2005. Use of AMMI in simultaneous selection of genotypes for yield and stability. IndSocAgril Statist 59(1): 76-82
[33] Ribeiro N., Souza JF, Antunes IF and Poersch NL. 2009. Yield stability of common bean cultivars of different commercial groups in Rio Grande do Sul State. Bragantia68: 339-346. [34] Samonte S, Wilson LT, McClung AM, and Medley JC. 2005.
Targeting cultivars onto rice growing environments using AMMI and SREG GGE biplot analysis. Crop Sci. 45: 2414-2424.
[35] TameneT, and Tadesse S. 2014. Sites Regression GGE Biplot Analysis of Haricot Bean (Phaseolus vulgaris L.) Genotypes in three Contrasting Environments. World Journal of Agricultural Research, Vol. 2( 5), 228-236
[36] Torga PP, Melo PGS, Pereira HS, Faria LC. 2013. Interaction of common beans cultivars of the black group with years, locations and sowing seasons. Euphytica 189: 239-248 [37] Yan W, and Hunt LA. 2001. Interpretation of genotype x
environment interaction for winter wheat yield in Ontario. Crop Sci 41: 19-25