University of New Orleans University of New Orleans
ScholarWorks@UNO
ScholarWorks@UNO
University of New Orleans Theses and
Dissertations Dissertations and Theses
Spring 5-18-2018
Regulatory Repercussions in Finance
Regulatory Repercussions in Finance
Jennifer L. Brodmann
University of New Orleans, [email protected]
Follow this and additional works at: https://scholarworks.uno.edu/td
Part of the Business Law, Public Responsibility, and Ethics Commons, and the Corporate Finance Commons
Recommended Citation Recommended Citation
Brodmann, Jennifer L., "Regulatory Repercussions in Finance" (2018). University of New Orleans Theses and Dissertations. 2444.
https://scholarworks.uno.edu/td/2444
This Dissertation-Restricted is protected by copyright and/or related rights. It has been brought to you by ScholarWorks@UNO with permission from the rights-holder(s). You are free to use this Dissertation-Restricted in any way that is permitted by the copyright and related rights legislation that applies to your use. For other uses you need to obtain permission from the rights-holder(s) directly, unless additional rights are indicated by a Creative Commons license in the record and/or on the work itself.
This Dissertation-Restricted has been accepted for inclusion in University of New Orleans Theses and Dissertations by an authorized administrator of ScholarWorks@UNO. For more information, please contact
Regulatory Repercussions in Finance
A Dissertation
Submitted to the Graduate Faculty of the University of New Orleans In partial fulfillment of the Requirements for the degree of
Doctor of Philosophy In
Financial Economics
By
Jennifer Brodmann
B.F.A. Academy of Art University, 2006 M.B.A. University of New Orleans, 2013 M.S. University of New Orleans, 2016
ii
iii Dedication
iv
Acknowledgement
v
Table of Contents
Abstract ... ix
Chapter 1 ... 1
1 Introduction ... 1
2 Literature Review ... 3
3 Hypothesis Development ... 5
3.1 Lobbying and CEO Pay ... 5
3.2 CEO Pay and Insider Trading ... 6
3.3 Lobbying and Insider Trading... 6
3.4 Insider Trading and CEO Wealth ... 7
3.5 Lobbying and Government Contracts ... 7
3.6 Lobbying, Firm Value, and Government Contracts ... 8
4 Methodology ... 9
5 Data ... 10
6 Findings... 11
6.1 CEO compensation packages of lobbying and non-lobbying CEOs... 11
6.2 Association between firm lobbying and firm performance ... 14
6.3 Association between lobbying and CEO stock transactions ... 16
6.4 Association between CEO insider transactions and CEO wealth ... 18
6.5 Association between lobbying and procurement of government contracts ... 21
6.6 Association between government contracts and firm value ... 22
7 Conclusion ... 26
References ... 27
Chapter 2 ... 32
The Impact of Incarceration on Firm Performance ... 32
1 Introduction ... 32
2 Literature Review ... 37
3 Data and Methodology ... 38
3.1 The Impact of Incarceration on Unemployment Rates ... 39
3.2 The Impact of Prison Reform on Firm Performance ... 40
3.3 The Impact of Incarceration on Firm Performance ... 41
3.4 Limitations and addressing endogeneity issues ... 42
4 Findings... 43
4.1 Incarceration Rates and Distribution of Firms by State ... 43
vi
4.3 The Impact of Incarceration Rates on Unemployment Rates ... 48
4.4 Prison Reform and Firm Performance ... 50
4.5 High Versus Low Incarceration ... 52
4.6 Incarceration Rates and Firm Performance ... 54
4.7 Addressing Endogeneity ... 56
5 Conclusion ... 59
6 Future Research ... 60
References ... 61
Appendix: Definition of Variables for Chapter 2 ... 67
vii
List of Tables and Figures
Chapter 1 ... 1
Tables Table 1 ... 9
Table 2 ... 10
Table 3 ... 12
Table 4 ... 13
Table 5 Panel A ... 14
Table 5 Panel B ... 15
Table 6 ... 17
Table 7 ... 18
Table 8 ... 19
Table 9 ... 20
Table 10 ... 21
Table 11 ... 23
Table 12 Panel A ... 24
Table 12 Panel B ... 24
Table 12 Panel C ... 24
Table 12 Panel D ... 25
Table 12 Panel E ... 25
Figures Figure 1 ... 16
Chapter 2 ... 29
Tables Table 1 ... 34-35 Table 2 ... 39
Table 3 ... 44-45 Table 4 ... 46-47 Table 5 ... 48
Table 6 ... 49-50 Table 7 ... 50
Table 8 ... 51
viii
Table 10 ... 53-54
Table 11 ... 55
Table 12 ... 56
Table 13 ... 58
Figures
Figure 1 ... 33
Figure 2 ... 33
ix Abstract
This dissertation examines the impact of regulation and public policies on firm performance. Chapter 1,
entitled “Political Contributions, Insider Trading, and CEO Compensation”, determines why CEOs from
politically-connected firms receive higher pay compared to their non-politically connected peers. We
investigate whether insider trading can explain high CEO pay. Using hand-collected firm-level lobbying
data, we examine whether politically-connected CEOs engage in insider trading after sponsored bills are
introduced and passed in the U.S. legislative bodies. Our results show that politically-connected CEOs
commit insider trading, which yields higher compensation packages. In addition, we also find that lobbying
benefits firm performance. Politically-connected firms receive more government contracts, which increases
firm value. Overall, political contributions benefit both CEOs and shareholders. Chapter 2, entitled “The
Impact of Incarceration on Firm Performance” conducts analyses on the impact of incarceration on firms
based in the United States. Through time series Granger Causality Vector Autoregression (VAR) tests by
state, we find that incarceration can influence labor markets measured by the state’s unemployment rate.
We find that firms based in states with high incarceration underperform compared to firms based in states
with low incarceration. This also holds true when examining prison reform data from the Pew Charitable
Trust. Through differences in differences tests, we find that firms based in states with prison reform
outperform firms based in states without prison reform. When controlling for firm and state macroeconomic
factors, we find that increases in incarceration rates have a negative effect on firm performance.
Keywords: Insider Trading, Political Lobbying, Firm Performance, Incarceration, Labor Markets
1 Chapter 1
Political Contributions, Insider Trading, and CEO Compensation
1 Introduction
This study examines whether lobbying firms pay their CEOs more than firms that do not lobby and if these
excess compensation costs are passed onto shareholders. Firms build political capital by operating lobbying
offices in Washington D.C., being represented by Washington D.C. law firms, using political consulting
firms, and using trade associations that represent the industry in which the firm is participating (Wilson,
1990). The primary objective of corporate lobbying is to influence favorable legislation that will provide
competitive advantages to firms. These advantages may include beneficial taxation policies, defensive trade
restrictions, and industry barriers to entry (Unsal, Hassan, Zirek, 2016). Our study examines the relationship
between firm lobbying, CEO compensation, CEO insider trading, and firms being awarded government
contracts. Our results indicate that firm lobbying leads to CEOs increasing their compensation through
engaging in insider trading on political information and firm lobbying increasing government contracts and
firm value. Brown, Huang, Siders, Lowry, and Shafer (2017) find a positive market reaction when CEOs
visit the White House, which may stem from this occurrence being a positive signal that CEOs have inside
access. In addition, CEOs that visit the White House receive more government contracts and are more privy
to inside information, which reduces policy uncertainty.
Previous studies find that corporate lobbying can benefit firms. Corporate Political Activity (CPA) which
encompasses campaign contributions, lobbying, contributions to Political Actions Committees, the
operation of government relations offices, and executive testimonies, is both related and acts as a vital
determinant of firm performance (Lux, Crook, and Woehr, 2011). Political lobbying increases firm
performance and hence shareholder value (Hillman et al., 1999; Chen, Parsley, and Yang, 2010). Links
between firms and government have a positive effect on firm value (Hillman et al., 1999). In addition,
lobbying firms can outperform their peers as well as the market average (Kim, 2008).
Political connections can increase firm performance in the case of private firms in China when
entrepreneurs are affiliated with the ruling political party (Li et al., 2008). Politically-connected CEOs may
receive excess compensation for building political capital, with the anticipation that this investment will
result in future benefits (Skaife, Veenman, and Werner, 2013). Politically connected firms can also increase
firm value by receiving more government subsidies (Tao et al. (2017). Political lobbying is a means for
building political connections and CEOs from firms that lobby are more likely to have higher compensation
2
Excess compensation may also stem from politically-connected CEOs engaging in insider trading from
political information. Insider trading has created opportunities for firm insiders to profit off private
information. This strategy may occur before public disclosures of positive information about the firm, such
as before a firm securing a government contract, which increases firm performance and increases CEO
compensation by profits made from insider trading. Political connections reduce the likelihood of firms
being investigated and prosecuted by the U.S. Securities and Exchange Commission (Correia, 2014). There
are also may be a legal loophole hindering prosecution of insider trading by firm management (Henning,
2013; Turner, 2015). This legal loophole may leave opportunities for CEOs to commit insider trading with
limited or no legal repercussion.
Firm management has the ability to craft legislation for bills that the U.S. member can pass through
Congress. This communication is conducted through lobbyist firms and provides both parties with access
to inside political information (Attkinson 2012:1; Mayer and Mujumdar, 2014). The main purpose of firms
utilizing lobbyists is to maintain political connections (Bertrand, Bombardini, and Trebbi, 2014). Attkinson
states “A study by the watchdog group Public Citizen found that 43 percent of Members of Congress who
left office between 1998 and mid-2005 went on to register as lobbyists.” This suggests that not only
lobbyists have access to congress members, the lobbyists a large portion of lobbyists were members of
Congress and have a deeper understanding of the inner workings of Congress from firsthand experience.
We examine the number of CEO stock transactions after a bill is passed in the U.S. Congress and House of
Representatives to determine if there is a presence of CEO insider trading and to find out whether these
transactions lead to additional CEO compensation.
We contribute to the current literature by further exploring whether corporate lobbying benefits firms or
just CEOs by examining CEO insider trading and government contracts. We hypothesize that
politically-connected CEOs enjoy large compensation packages from trading on inside political information and that
firms also benefit from political connections through government contract awards. Our study is motivated
by Goldman, Rocholl, and So (2008), who find that firms with politically-connected board members obtain
more government contracts, and Skaife, Veenman, and Werner (2013) who find a correlation between
corporate lobbying and CEO pay. We focus on political lobbying and whether it benefits the CEO, the firm,
or both. Previous research examines the relation between political connections and government contracts,
as well as political connections and management compensation. Bourveau, Coulomb, and Sangnier (2016)
determine a link between political connections and insider trading in the French 2007 election and find that
directors with connections to the President are more likely to engage in insider trading. Yet, there has not
3
compensation. In addition, we contribute to the existing literature by determining if the costs associated
with political activity are passed onto shareholders.
Our sample consists of 2,788 unique firms and 5,201 unique CEOs with 14 percent of the sample being
lobbying firms. The sample includes a total of 2,554 bills introduced and passed in the U.S. Senate and
House of Representatives. In our event study, we find that firm lobbying is related to positive changes in
firm value measured by the firms’ cumulative abnormal returns (CARs). Our results reflect that firms
receive positive market reaction after the bill is introduced and passed in the U.S. legislative bodies.
Additionally, we document that CEOs in our sample commit insider trading by purchasing their shares two
weeks and one week before the introduction of the sponsored bill. We find that lobbying increases the total
number of insider transactions, which eventually leads to higher CEO pay. Through multivariate analysis
of the three variables for firm lobbying, we find evidence that firm lobbying increases total CEO
compensation packages, including stock options. To our knowledge, the influence of insider trading on
CEO pay through lobbying has not been examined. We fill this gap in the existing literature by empirically
testing a) whether CEOs exploit lobbying information; b) whether lobbying increases the likelihood of
insider trading; and finally, c) whether lobbying increases CEO pay. Our study represents an initial analysis
of a new panel data set of lobbying and insider trading relation.
The paper is structured as follows. In Section 2, we summarize the existing literature relating to firm
political contributions, the impact of insider trading, firm procurement of government contracts, and
potential firm costs and benefits of CEO stock-based compensation. Section 3 presents the discussion of
the data and methodology used to determine the presence of insider trading, CEO compensation, and
government contract procurement. Section 4 confers about the results from the empirical tests, Section 5
reviews the findings, and Section 6 concludes.
2 Literature Review
Several factors contribute to firms becoming politically active, which include the “institutional features of
Congress,” the size of the firm, government contracts, and the level of industry concentration (Schuler,
Rehbein, and Cramer, 2002). Firms engage in political activism by PAC contributions, inside lobbyists (the
number of lobbyists in their Washington D.C. office), and outside lobbyists (the number of outside lobbyists
and political consultants). Firms that are in more concentrated industries may have less of a need for being
politically-connected (Grier, Munger, and Roberts, 1991). Outside directors that have political,
government, or law backgrounds are more prevalent in certain industries where political experience is
considered necessary, such as manufacturing (Agrawal and Knoeber, 2001). Hillman and Hitt (1999) found
4
influence by providing pertinent policy information to regulators in a more efficient and cost-effective
manner than their industry competitors (Hansen, 1991).
Whether or not firm lobbying is beneficial to firms has been studied extensively in the previous literature.
In certain industries, such as the steel industry, firms that perceive to gain the most from political
connections are the most active, despite the efficacy of determining the returns from political investment
(Schuler, 1996). This may also contribute to investments in higher CEO compensation for CEOs that are
willing to pursue a corporate political strategy and implement firm lobbying.
Firm lobbying can lead to reductions in a firm’s effective tax rates (Richter, Samphantharak, and Timmons,
2009).Lobbying firms can outperform their peers as well as the market average (Kim, 2008). Research has
also shown that firm lobbying can lead to higher financial performance (Chen, Parsley, and Yang, 2010).
Corporate lobbying can also help fraudulent firms evade detection and provide the opportunity for managers
to sell more of their shares (Yu and Yu 2012). Firm lobbying for trade protections in declining industries
has been found to reward poor firm performance and hinder innovation. This finding has been countered,
with investments from connected firms being shown to underperform investments made by firms without
political connections (Duchin and Sosyura, 2012). Yet, Aggarwal, Meschke, and Wang (2009) find that
political contributions are not an effective political capital investment. In contrast, Cooper, Gulen, and
Ovtchinnikov (2010) find that firms that participate in the political contribution process result in higher
rates of return.
Firms may engage in lobbying efforts to benefit management and not necessarily the firm. Skaife,
Veenman, and Werner (2013) strengthen this argument by finding that corporate lobbying results in agency
costs to be incurred by shareholders. Our results indicate that firm lobbying can benefit both the CEO and
the firm, through acquiring additional government contracts and CEO insider trading.
Firm insiders engage in insider trading to increase their personal wealth. Insider trading has been found to
have a negative effect on firms and their stock price. Insider trading can also reduce firm value, by
increasing the cost of equity (Masson and Madhavan, 1991). Prior research has seen that information
asymmetries offer the firm CEO the opportunity for insider trading for personal gain (Ahuja, Coff, and Lee,
2005). CEOs may consider insider trading as a means for increasing their compensation. CEO insider
trading can create firm inefficiencies since the ability of CEOs to trade stock options contributes to firm
agency problems (Bebchuk and Fershtman, 1994). CEOs also consider board positions upon retirement,
which ties to the firm's stock returns. (Brickley, Linck, and Coles, 1999).
Differing conclusions have been made about the benefits of management stock-based compensation, where
5
(Yermack, 1997; Aboody and Kasznik, 2000). Insiders have strategically chosen disclosure policies and
when to implement stock trades to maximize their personal trading profits, when there is a low risk of
litigation (Cheng and Lo, 2006). The timing of news disclosure is conducted for the CEOs' benefit. CEOs
delay good news and hurry the disclosure of bad news to maximize their stock option compensation
(Aboody and Kasznik, 2000; Cheng and Lo, 2006).
Insider trading has been seen to act as an indicator that insiders have private information, based on analysis
of trading activity surrounding public announcements (Damodaran and Liu, 1993). Mimicking trading
patterns by U.S. senators may beat the market (Ziobrowski, Cheng, Boyd, and Ziobrowski, 2004), which
indicates that U.S. senators are earning abnormal trading profits through knowledge of inside information.
Our results support this by showing a presence of CEO insider trading before bills pass.
Given the lobbying and firm performance, we investigate how lobbying can benefit firms through
government contracting. The level of a firm's political sensitivity impacts the level of scrutiny the
government will put upon a firm (Watts and Zimmerman, 1990). Watts and Zimmerman (1990)'s political
cost hypothesis states this. Government contracts are also of interest to firms, and political lobbying can
obtain these contracts. However, regulators may already prefer to grant government contracts to domestic
firms instead of foreign firms, because the profits of foreign firms do not contribute to domestic welfare
(Branco, 1994). This preference for domestic firms may be the case, but political contributions can
influence the selection of which domestic firms will receive the government contract. Firms that utilize
government contracts span several industries and firms use political donations as well as political
connections to strengthen their contractor bargaining power (Mills et al., 2012). Halchin (2006) overviews
the federal procurement process and resources.
3 Hypothesis Development
3.1 Lobbying and CEO Pay
In our study, our motivation is to investigate if lobbying increases CEO wealth through insider trading. To
test this, we first use lobbying expenditures and measure the relationship between compensation and
political contributions to understand if the managers have private information by building political capital
over the time. For this objective, we investigate our first hypothesis, the link between lobbying and CEO
pay;
H.1: All other things equal, lobbying CEOs have greater compensation packages compared to non-lobbying
6
CEO Pay = 𝛽0+ 𝛽1LobbyingIndicators+∑ 𝛽𝑠Controls (1)
Our dependent variable is total CEO compensation and CEO compensation including options. We use three
sets of lobbying indicators. Lobbydum is a binary variable and equal to one if the firm is lobbying in year
t. Ln(lobbyexp) is the log transformation of total lobbying expenditure, and ln(totalbills) is the log
transformation of the total number of bills lobbied at year t. We use firm-specific control variables and
report our findings.
3.2 CEO Pay and Insider Trading
Since our motivation is to document the relationship between CEO pay and insider trading, we believe that
managers exploit the political information to increase their wealth, therefore; we first expect that successful
lobbying activity increases firm value in terms of cumulative abnormal returns before announcement date
of bills introduced in the House and the Senate.
H.2: All other things equal, lobbying firms obtain positive market reaction measured by cumulative
abnormal returns (CAR);
We hand collect sponsored bills and introduction dates in US legislative bodies from the Congressional
Bills database for responsible lobbying firms in our sample. We next employ the event study CAPM method
where; 𝑅𝑖,𝑡 is the actual return, 𝑟𝑓,𝑡 is a risk-free return and 𝑅𝑀,𝑡 is the return of a selected market index (we
use Value Weight index from CRSP).
𝑅𝑖,𝑡− 𝑟𝑓,𝑡 = ∝𝑖+ 𝛽𝑖,𝑀(𝑅𝑀,𝑡− 𝑟𝑓,𝑡) + 𝜖𝑖,𝑡 (2)
We use different event windows around announcement dates, CAR [-t, +t], where we introduce the null
hypothesis, which is that cumulative abnormal return is equal to zero;
𝐻𝑜: 𝐶𝐴𝑅 = 0
3.3 Lobbying and Insider Trading
Bourveau, Coulomb, and Sangnier (2016) find that insider trading by politically-connected firm directors
increases before and after the election. We examine this phenomenon in the United States exploring whether
U.S. CEOs from lobbying firms increase their stock transactions once bills are introduced and become law.
Our results confirm that lobbying firms are associated with positive CARs during the announcement dates
when the sponsored bill is introduced and become law. Therefore, we hypothesize that CEOs from lobbying
7
H.3: All other things equal, lobbying increases the number of insider transactions by CEOs before the
sponsored bills are introduced and passed in US legislative bodies. (𝛽1>0)
Transaction = 𝛽0+ 𝛽1 LobbyingIndicators +∑ 𝛽𝑠Controls (3)
Our dependent variable is Transaction, and we calculate it in two different ways. We first calculate the total
number of insider transactions by lobbying CEOs two weeks before the bill is introduced in the US
legislative bodies, and secondly, we calculate the total number CEO insider transactions one week before
the introduction of the bill. We find that lobbying indicators lead to higher insider transactions when
legislators vote on the bill. In that case, we believe that insider transactions two weeks and one week before
the bill is introduced may increase the CEO pay over the long run since firms receive positive CARs
surrounding the announcement date;
3.4 Insider Trading and CEO Wealth
We examine whether CEOs that engage in insider trading have higher compensation. Henderson (2011)
finds that opportunities to trade on inside information can be used to supplement CEO compensation. We
determine whether CEOs that engage in insider trading have higher CEO wealth.
H.4: All other things equal, insider transaction increases CEO wealth; (𝛽1>0)
CEO Pay = 𝛽0+ 𝛽1 Transaction +∑ 𝛽𝑠Controls (4)
Our dependent variable is total CEO compensation and CEO compensation including options. We use the
log transformation of the number of transactions two weeks and one week before the voted bill and
document that insider trading increases CEO wealth. While we report that political engagement (i.e.
lobbying) increases CEO wealth by managers exploiting the information (i.e. insider trading), we also test
the firm performance of lobbying firms in our sample for potential agency cost problems.
3.5 Lobbying and Government Contracts
We believe that if lobbying increases CEO pay, however, fails to generate firm value; then it is the CEOs
and not the shareholders that benefit from the lobbying activity. While the majority of finance literature
(Chen, Parsley, and Yang, 2010; Kim, 2008; Hillman, Zardkoohi, and Bierman, 1999) points out that
lobbying benefits firm performance, we measure the impact of lobbying by considering the impact of
government contracting. Berrios (2006) finds that firms with inside contacts are given government
contracts. Duchin and Sosyura (2012) find that politically connected firms are more likely to receive
8
government contract awards after a U.S. House election where the firm is connected to the winning party.
These political connections may be advantageous for firms in receiving more government contracts.
Because of this, agency cost problems from firm lobbying may be mitigated by obtaining government
contracts, due to the value added by government contracts, which offsets the costs incurred from
politically-connected CEO excess compensation. We expect that lobbying firms may gain easy access to government
contracts by spending an excess amount of lobbying expenditures, therefore;
H.5: All other things equal, lobbying increases the likelihood of gaining access to government contracts.
(𝛽1>0)
Contract= 𝛽0+ 𝛽1LobbyingIndicators +∑ 𝛽𝑠Controls (5)
We calculate the government contract variable by a) if the firm has at least one government contract, and
b) the total number of government contracts associated with the firm. We report that larger lobbying
expenditures increase both the likelihood of receiving a government contract, as well as the total number
of contracts. In this case, we believe that lobbying creates firm value. Just in 2014, government contracts
totaled $447 billion, which shows the revenue potential that has in contributing to firm value if a firm can
secure government contracts.
3.6 Lobbying, Firm Value, and Government Contracts
We now examine this further and look to determine whether firm value increases with firm lobbying. Firm
lobbying increases the likelihood of being awarded government contracts (Goldman, Rochell, and So,
2013). Elayan, Pukthuanthong, and Li (2004) find that government contract awards increase firm value.
We hypothesize that lobbying firms receive more government contracts and these government contract
awards increase firm value.
H.6: All other things equal, lobbying increases the firm value through government contracting (𝛽1>0);
FirmValue= 𝛽0+ 𝛽1LobbyingIndicators +∑ 𝛽𝑠Controls (6)
We calculate the firm value in terms of long-term buy-and-hold abnormal returns (BHAR) for +12, +24,
and +36 months after firm lobbying activity. We introduce lobbying indicators and an interaction term of
lobbying multiplied by government contracting to understand if lobbying firms who are government
contractors have better performance compared to non-lobbying firms. Lobbying benefits both CEOs and
firms in different ways. Lobbying provides CEOs access to inside information, which they can use to profit
9
Zardkoohi, and Bierman, 1999) and government contracts increase firm value. We find that lobbying
increases stock performance as well as shareholder wealth, which is consistent with our expectations.
4 Methodology
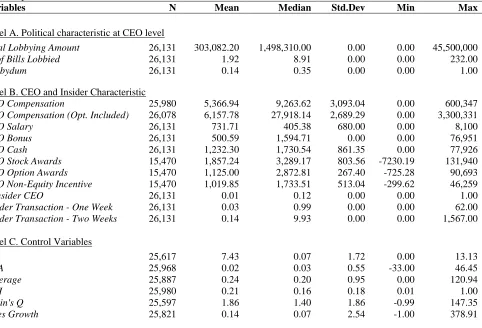
We measure lobbying activities in three ways. In Table 1, lobbydum is equal to 1 if the firm has lobbying
activity in the given year, 0 otherwise. Second, we use a log transformation of the total amount of lobbying
expenditures. Third, we calculate the number of bills a firm has lobbied. 14 percent of the firms included
in the sample are lobbying firms, with the average amount of lobbying expenditures being greater than
303,000 USD and the maximum expenditure amount being 45 million USD.
Table 1
Summary Statistics
Variables N Mean Median Std.Dev Min Max
Panel A. Political characteristic at CEO level
Total Lobbying Amount 26,131 303,082.20 1,498,310.00 0.00 0.00 45,500,000
N. of Bills Lobbied 26,131 1.92 8.91 0.00 0.00 232.00
Lobbydum 26,131 0.14 0.35 0.00 0.00 1.00
Panel B. CEO and Insider Characteristic
CEO Compensation 25,980 5,366.94 9,263.62 3,093.04 0.00 600,347 CEO Compensation (Opt. Included) 26,078 6,157.78 27,918.14 2,689.29 0.00 3,300,331
CEO Salary 26,131 731.71 405.38 680.00 0.00 8,100
CEO Bonus 26,131 500.59 1,594.71 0.00 0.00 76,951
CEO Cash 26,131 1,232.30 1,730.54 861.35 0.00 77,926
CEO Stock Awards 15,470 1,857.24 3,289.17 803.56 -7230.19 131,940 CEO Option Awards 15,470 1,125.00 2,872.81 267.40 -725.28 90,693 CEO Non-Equity Incentive 15,470 1,019.85 1,733.51 513.04 -299.62 46,259
%Insider CEO 26,131 0.01 0.12 0.00 0.00 1.00
Insider Transaction - One Week 26,131 0.03 0.99 0.00 0.00 62.00 Insider Transaction - Two Weeks 26,131 0.14 9.93 0.00 0.00 1,567.00
Panel C. Control Variables
Size 25,617 7.43 0.07 1.72 0.00 13.13
ROA 25,968 0.02 0.03 0.55 -33.00 46.45
Leverage 25,887 0.24 0.20 0.95 0.00 120.94
HHI 25,980 0.21 0.16 0.18 0.01 1.00
Tobin's Q 25,597 1.86 1.40 1.86 -0.99 147.35
Sales Growth 25,821 0.14 0.07 2.54 -1.00 378.91
10
In Table 2, we conduct a univariate analysis. Table 2 documents the difference between lobbying and
non-lobbying firms in terms of non-lobbying characteristics. We compare non-lobbying firm versus non-non-lobbying firms.
In Panel A, we document that lobbying firms are larger in size and more profitable. On the other hand,
lobbying firms have higher Tobin's Q and sales growth, and the difference between lobbying and
non-lobbying firms is statistically significant, which provides additional support for this positive relationship
between lobbying and firm performance, as seen in Chen, Parsley, and Yang (2010). Positive relations
between political connections have also been found in Germany (Niessen and Ruenzi, 2010).
Table 2
Univariate Test
Variable N Lobby
[1] N
Non-lobby [2]
Difference
[1]-[2] T-statistics
Panel A. Firm Characteristic
Ln(Size) 2,485 9.17 23,132 7.19 1.98 [52.60]***
ROA 2,485 0.04 23,132 0.03 0.01 [2.60]**
BookLeverage 2,485 0.25 23,132 0.24 0.01 [0.60]
Herfindahl Index 2,485 0.21 23,132 0.22 -0.01 [-0.46]
Tobin's Q 2,485 1.67 23,132 1.80 -0.13 [4.79]***
Sales Growth 2,485 0.07 23,132 0.15 -0.08 [-2.65]***
Table 2 reports the univariate analysis between our sample firms. In column (1), we define lobbying group if the firm is defined as a lobbyist in our sample. In column (2), non-lobby refers to firms with no lobbying engagement. In column (1)-(2), we report the differences in means of given variables and T-test results. In Panel A, we compare sample means based on lobbying activity. *, **, and *** indicate statistical significance at the 10%, 5%, and 1% levels, respectively.
5 Data
a) Firm Data and CEO Characteristics
We use COMPUSTAT database to identify the publicly traded firms in our study. We calculate
firm-specific variables from COMPUSTAT database. We then use ExecuComp database and merge it with
COMPUSTAT to obtain CEO characteristics along with compensation variables. Our sample begins in
2000 and ends in 2014.
b) Stock Returns
We use CRSP daily returns for the event study on market reaction. We also obtain CRSP monthly returns
11 c) Insider Trading Data
We collect insider trading data from Form 4 reported by the U.S. Securities Exchange and Commission
(SEC)1. The SEC filings include detailed insiders (i.e., officers, directors, and shareholders who own more
than 10% of ownership) transactions at the personal level.
d) Lobbying Data
Lobbying data is collected from Center for Responsible Politics (CRP)2 and merged with COMPUSTAT
database to identify the publicly traded firms. The CRP database includes lobbying expenditure and bills
which are sponsored by firms in our sample. In addition to CRP database, we also use Congressional Bill
database3 to track the full history of bills (including introduction days at US legislative bodies) lobbied by
firms in our sample.
e) Government Contracts
We hand collect the government contracting data by using Federal Procurement Data System4 and match it
with publicly traded firms in our sample to identify the number of government contracts that firms obtain
in a given year.
6 Findings
6.1 CEO compensation packages of lobbying and non-lobbying CEOs
In Table 3, we divide our sample into lobbying firms versus non-lobbying firms and find that CEOs from
lobbying firms have larger compensation packages measured in all forms. CEOs from lobbying firms have
higher cash salary bonuses, stock awards, option awards, and overall total compensation in comparison to
their non-lobbying peers and the differences are statistically significant. Firms may pay higher
compensation to attract and maintain politically-engaged CEOs (Huilonga, Minb, Yapinga, and
Lianshenga, 2010). Shareholders value management engaging in lobbying activities on their behalf (Hill,
Kelly, Lockhart, and Ness (2013). We conduct a multivariate analysis to explore this further by measuring
the relation between firm lobbying and CEO pay.
1We also cross-check the validity of our data with one reported in following websites (http://insidertrading.org/ or
http://openinsider.com/)
2 www.opensecrets.org/lobbying 3 http://www.congressionalbills.org/
12 Table 3
Lobbying and CEO Compensation: Univariate Analysis
Variable N Lobby [1] N Non-lobby [2] Difference
[1]-[2] T-statistics
Cash 2,515 1,442.53 23,616 969.09 473.44 [12.89]***
Salary 2,515 1,056.60 23,616 726.32 330.28 [33.89]***
Bonus 2,515 385.85 23,616 242.76 143.09 [4.18]****
Stock Award 2,149 3,703.88 13,321 1,559.32 2,144.56 [22.72]***
Option Award 2,149 2,145.55 13,321 960.36 1,185.19 [16.80]***
Non-Equity Incentive Plan 2,149 2,014.10 13,321 859.45 1,154.65 [21.16]***
Total Compensation 2,513 9,589.14 23,467 4,595.88 4,993.26 [29.43]***
Total Compensation (Inc. Options) 2,515 11,310.73 23,563 5,985.06 5,325.67 [12.43]***
Table 3 reports the univariate analysis between lobbying firms our sample firms. In column (1), we define lobbying group if the firm is defined as a lobbyist in our sample. In column (2), non-lobby refers to firms with no lobbying engagement. In column (1)-(2), we report the differences in means of given variables and T-test results. We compare sample means based on lobbying activity and CEO pay characteristics. *, **, and *** indicate statistical significance at the 10%, 5%, and 1% levels, respectively.
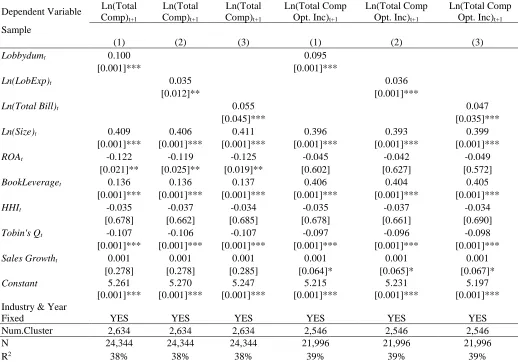
Table 4 reflects the results from investigating if lobbying leads to higher compensation packages. We use
two measures for compensation and define them as total compensation and total compensation including
options. We use the same lobbying indicators and find that CEOs from lobbying firms do have higher
compensation packages compared to their non-lobbying peers. Additionally, our results indicate that total
lobbying expenditures and the total number of bills lobbied increase CEO pay. 5
There is a positive relationship between total CEO compensation and lobbying expenditure, with this excess
compensation leading to agency costs (Skaife, Veenman, and Werner, 2013). We believe that lobbying
leads to higher CEO pay. This excess CEO pay comes from profits made from insider trading. Because of
this, excess compensation may not be associated with agency costs. We try to explain this through empirical
tests of firm performance and other channels of CEO pay resulting from insider trading.
5 We also find that lobbying increases cash salary bonuses and other CEO pay packages, but to conserve space, we
13
Table 4
Lobbying and CEO Compensation: Multivariate Analysis Dependent Variable Ln(Total
Comp)t+1
Ln(Total Comp)t+1
Ln(Total Comp)t+1
Ln(Total Comp Opt. Inc)t+1
Ln(Total Comp Opt. Inc)t+1
Ln(Total Comp Opt. Inc)t+1
Sample
(1) (2) (3) (1) (2) (3)
Lobbydumt 0.100 0.095
[0.001]*** [0.001]***
Ln(LobExp)t 0.035 0.036
[0.012]** [0.001]***
Ln(Total Bill)t 0.055 0.047
[0.045]*** [0.035]***
Ln(Size)t 0.409 0.406 0.411 0.396 0.393 0.399
[0.001]*** [0.001]*** [0.001]*** [0.001]*** [0.001]*** [0.001]***
ROAt -0.122 -0.119 -0.125 -0.045 -0.042 -0.049
[0.021]** [0.025]** [0.019]** [0.602] [0.627] [0.572]
BookLeveraget 0.136 0.136 0.137 0.406 0.404 0.405
[0.001]*** [0.001]*** [0.001]*** [0.001]*** [0.001]*** [0.001]***
HHIt -0.035 -0.037 -0.034 -0.035 -0.037 -0.034
[0.678] [0.662] [0.685] [0.678] [0.661] [0.690]
Tobin's Qt -0.107 -0.106 -0.107 -0.097 -0.096 -0.098
[0.001]*** [0.001]*** [0.001]*** [0.001]*** [0.001]*** [0.001]***
Sales Growtht 0.001 0.001 0.001 0.001 0.001 0.001
[0.278] [0.278] [0.285] [0.064]* [0.065]* [0.067]*
Constant 5.261 5.270 5.247 5.215 5.231 5.197
[0.001]*** [0.001]*** [0.001]*** [0.001]*** [0.001]*** [0.001]*** Industry & Year
Fixed YES YES YES YES YES YES
Num.Cluster 2,634 2,634 2,634 2,546 2,546 2,546
N 24,344 24,344 24,344 21,996 21,996 21,996
R2 38% 38% 38% 39% 39% 39%
14
6.2 Association between firm lobbying and firm performance
Next, we try to explain CEO pay and firm performance and if lobbying benefits the firm. To determine if
lobbying increases stock prices, we conduct an event study analysis and measure the market reaction when
the sponsored bill is introduced in the U.S. legislative bodies. Table 5 reflects these results. In Panel A, we
report several different event windows when the bill is introduced. We find that lobbying firms receive
positive market reaction when the bill successfully overcomes legal procedures. In addition, we find that
market reaction is positive and significant for lobbying firms once the sponsored bill becomes law. The
passing of a bill may be a positive market signal that indicates the effectiveness of a firm’s political
connections. Also, firms lobby Congress to push bills which provide these firms competitive advantages.
These competitive advantages, such as beneficial tax rates and deregulation, can increase firm value. For
instance, on December 5, 2016, the Senate passed a bill that boots biomedical research and speeds Federal
Drug Administration approvals. This bill greatly benefits pharmaceutical companies, who have contributed
substantial political donations to Congressional campaigns.6
Table 5
Event Study: Bill Introduced
Panel A. Short-Term Event Study
Date CAR T-Test Prob.
[0,+1] 1.00% 17.96 [0.001]***
[0,+2] 1.00% 14.59 [0.001]***
[0,+3] 0.89% 11.30 [0.001]***
[-1,+1] 1.00% 14.73 [0.001]***
[-2,+2] 1.05% 11.94 [0.001]***
[-3,+3] 0.96% 9.22 [0.001]***
[-4,+4] 0.84% 7.12 [0.001]***
Table 5 reports market responses to the sponsored bill being introduced and passed in the U.S legislative bodies. CAR refers to the cumulative abnormal returns (CAR) for lobbying firms when their sponsored bill is successful in legal procedures. In Panel A, we perform short-term event study where CAPM model is used to calculated CARs of event windows.
𝑅𝑖,𝑡− 𝑟𝑓,𝑡= 𝛼𝑖+ 𝛽𝑖,𝑀(𝑅𝑀,𝑡− 𝑟𝑓,𝑡) + 𝜀𝑖,𝑡
Where 𝑅𝑖,𝑡 is the actual return and 𝑅𝑀,𝑡 is the return of a selected market index (CRSP value weight index). In Panel B, we use cumulative abnormal returns as the dependent variable and regress it on firm-level lobbying variable and other control variables. Std. errors are clustered at the firm level. *, **, and *** indicate statistical significance at the 10%, 5%, and 1% levels, respectively.
15
In Panel B of Table 5, we measure the market reaction in a multivariate analysis by regressing cumulative
abnormal returns on lobbying expenditures. We find that increases in lobbying expenditure increase the
cumulative abnormal returns, controlling for firm-specific characteristics. Our findings suggest that greater
lobbying expenditure leads to greater market reaction for the firms in our sample. Positive market reactions
occur when politically-connected individuals are nominated to a firm’s board of directors, which shows
that markets value a firm’s political connections (Goldman, Rochell, and So, 2008). Bills being introduced
and passed in the U.S. legislative bodies may also be a positive signal to the market that the firm’s political
capital is increasing. These findings are in line with Chen, Parsley, and Yang, (2010), who found a positive
relation between lobbying expenditures and firm financial performance by examining the relation between
current lobbying and future performance, lobbying to change in financial performance and the
first-differenced equation of the first measure.
Table 5: Panel B. Lobbying and Cumulative Abnormal Returns
Dependent Variable CAR[-1,+1] CAR[-2,+2] CAR[0,+1]
Sample
(1) (2) (3)
Ln(LobExp)t 0.112 0.223 0.236
[0.001]*** [0.001]*** [0.001]***
Ln(Size)t -0.003 -0.003 -0.003
[0.001]*** [0.001]*** [0.001]***
ROAt -0.047 -0.046 -0.017
[0.221] [0.445] [0.441]
BookLeveraget 0.006 0.013 0.003
[0.415] [0.139] [0.671]
HHIt 0.002 -0.002 -0.010
[0.526] [0.593] [0.039]**
Tobin's Qt 0.002 0.002 0.001
[0.001]*** [0.116] [0.506]
Sales Growtht 0.011 0.028 0.024
[0.001]*** [0.001]*** [0.001]***
Constant 0.008 -0.001 -0.001
[0.179] [0.907] [0.975]
Industry & Year Fixed YES YES YES
Num.Cluster 417 417 417
N 2,505 2,505 2,505
R2 3% 3% 3%
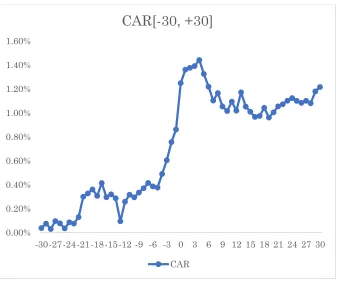
Figure 1 represents the market reaction where we plot cumulative abnormal returns. We show that before
16
announcement date. The cumulative abnormal returns reach the highest point in event intervals of four or
five days. We aim to investigate the positive price movement by insider trading in the following section.
Figure 1
Lobbying and CAR: Bill Introduced & Passed
6.3 Association between lobbying and CEO stock transactions
Given the positive market reaction, we investigate the presence of CEO insider trading. We examine if
CEOs from lobbying firms exploit their inside information and engage in stock trades before the
introductions of bills in the U.S. legislative bodies. CEOs can trade on inside information. An example of
this is Wells Fargo CEO John Stumpf, who sold Wells Fargo shares for a profit of $26 million before
settling a long-run investigation against Wells Fargo.7 Jagolinzer, Larcker, Ormazabal, and Taylor (2016)
find that politically connected insiders have information advantages and exploit them before government
intervention announcements. Our hypothesis states that CEOs may commit insider trading before the
introductions of the bills. Political connections may reduce the likelihood of CEOs being prosecuted for
insider trading. To test this hypothesis, we calculate the number of insider transactions before the bill
introduction date. Table 6 reflects the total number of CEO insider transactions that occur both two weeks
7 Kristof, K. (2016, October 14). CEO sold millions in Wells Fargo stock before fraud revelations. Retrieved
January 25, 2017, from http://www.cbsnews.com/news/wells-fargo-ceo-john-stumpf-sold-millions-in-company-stock-before-bank-fraud-revelations/
0.00% 0.20% 0.40% 0.60% 0.80% 1.00% 1.20% 1.40% 1.60%
-30-27-24-21-18-15-12 -9 -6 -3 0 3 6 9 12 15 18 21 24 27 30
CAR[-30, +30]
17
and one week before the bill introduction date. We measure the relation between lobbying and insider
trading activity by regressing two weeks of the total number of stock transactions and one week of the total
number of stock transactions made by CEOs before the introduction of the bill. Our results are presented in
Table 6 where we measure the relationship between lobbying and insider transactions.
Table 6
Corporate Lobbying and Insider Trading
Dependent Variable Ln(TwoWeeks) Ln(TwoWeeks) Ln(TwoWeeks) Ln(OneWeek) Ln(OneWeek) Ln(OneWeek) Sample
(1) (2) (3) (1) (2) (3)
Lobbydumt 0.136 0.075
[0.001]*** [0.001]***
Ln(LobExp)t 0.036 0.019
[0.001]*** [0.001]***
Ln(Total Bill)t 0.133 0.074
[0.001]*** [0.001]***
Ln(Size)t 0.009 0.010 0.005 0.006 0.006 0.004
[0.001]*** [0.001]*** [0.001]*** [0.001]*** [0.001]*** [0.001]***
ROAt -0.003 -0.003 -0.001 -0.002 -0.002 -0.001
[0.298] [0.244] [0.700] [0.292] [0.242] [0.511]
BookLeveraget -0.003 -0.003 -0.005 0.001 0.001 0.000
[0.278] [0.286] [0.124] [0.434] [0.394] [0.948]
HHIt -0.001 -0.001 -0.005 -0.008 -0.007 -0.010
[0.944] [0.974] [0.632] [0.279] [0.309] [0.147]
Tobin's Qt 0.003 0.003 0.004 -0.001 -0.001 0.001
[0.251] [0.273] [0.104] [0.456] [0.369] [0.877]
Sales Growtht -0.001 -0.001 -0.001 -0.001 -0.001 -0.001
[0.924] [0.967] [0.431] [0.828] [0.795] [0.664]
Constant -0.073 -0.080 -0.044 -0.041 -0.046 -0.024
[0.001]*** [0.001]*** [0.001]*** [0.001]*** [0.001]*** [0.001]***
Industry & Year Fixed YES YES YES YES YES YES
Num.Cluster 2,763 2,763 2,763 2,763 2,763 2,763
N 25,387 25,387 25,387 25,387 25,387 25,387
R2 6% 5% 5% 5% 5% 5%
Table 6 exhibits the relationship between insider transaction and lobbying for our sample firms. In column (1) to (3), our dependent variable is log transformation of the total number of insider transactions by CEOs two weeks before the bill is introduced. In column (4) to (6), our dependent variable is log transformation of the total number of insider transaction by CEOs one week before the bill is introduced. Lobbydum is equal to one if the firm has lobbying activity, zero otherwise. Ln(LobExp) is the log transformation of lobbying expenditure at the firm level. Ln(Total Bill) is the log transformation of the total number of bill sponsored. Other control variables are calculated from COMPUSTAT. We add period (year) binary variables and industry binary variables but omit the coefficients. Std. Errors are clustered at the firm level. Numbers in parentheses are p-values. *, **, and *** indicate statistical significance at the 10%, 5%, and 1% levels, respectively.
Our results reflect that lobbying firms do have more insider trading activity in those two weeks and
one-week time periods. Thus, our findings confirm that lobbying increases CEO insider trading activity where
managers are more likely to exploit inside information. We believe that lobbying increases insider trading
activity, because legislation that is beneficial to the firm is being passed, which will be a positive signal to
18
6.4 Association between CEO insider transactions and CEO wealth
CEO political networks can have an impact on their compensation (Aslan and Grinstein, 2011). We
examine this further by determining whether CEO insider trading leads to higher CEO wealth. Insider
trading gives the CEO an opportunity to make substantial profits, and this may contribute to CEO wealth.
Firms who restrict insider trading pay executives more than firms who do not restrict insider trading. This
indicates that opportunities for CEO insider trading can be used as part of CEO compensation packages
(Henderson, 2011; Roulstone, 2003). We examine whether insider trading can explain CEO pay and benefit
CEOs. We test for insider trading by comparing insider CEOs to non-insider CEOs and then measure CEO
wealth. We define the group as an insider if the CEO of the firm has an insider transaction at least two
weeks before the bill is introduced and non-insider refers to firms with no insider transaction at CEO level.
Our univariate results are presented in Table 7. We find that CEOs who commit insider trading before the
bill introduction date have greater cash, salary, bonus, and overall total compensation packages compared
to CEOs who have no insider trading activity. Profits made from insider trading activity may boost CEO
compensation and hence CEO wealth. These results confirm our earlier findings that CEOs with private
political information may benefit from insider trading and the difference is statistically significant. CEOs
may have larger compensation packages compared to their non-lobbying peers from the additional
investment by firms for CEOs to gain political capital that will influence legislation and benefit the firm
(Skaife, Veenman, and Werner, 2013). CEO pay may also be larger primarily from the portfolio
optimization and trading profits made from inside political information (Henderson, 2011).
Table 7
Insider Trading and CEO Compensation
Variable N Insider
[1] N
Non-insider [2]
Difference
[1]-[2] T-statistics
Cash 375 1,759.93 25,756 1,017.03 742.90 [5.74]***
Salary 375 1,117.31 25,756 763.70 353.62 [15.44]***
Bonus 375 642.62 25,756 253.34 389.28 [3.06]***
Stock Award 363 3,878.49 15,107 1,808.67 2,069.82 [6.95]*** Option Award 363 2,504.32 15,107 1,091.86 1,412.46 [8.43]*** Non-Equity Incentive Plan 363 2,112.64 15,107 993.59 1,119.05 [8.47]***
Total Compensation 375 10,522.36 25,605 5,162.32 5,360.04 [12.78]*** Total Compensation (Inc. Options) 375 13,911.32 25,703 6,549.93 7,361.39 [8.10]***
19
We also test the effect of insider trading on CEO pay, we also conduct a multivariate test and report our
findings in Table VIII, with the dependent variable as total CEO pay and the total CEO pay including
options.
We regress CEO on insider trading characteristics and in Column 1 and 2, we find that the total number of
transactions two weeks and the total number of transactions one week before the bill introduction date
increases the total CEO pay. Similarly, in Column 3 and 4, we find that insider trading actions increase total
compensation, including options8. These results may reveal the fact that insider trading increases the CEO
wealth in our sample and is important to understand the benefit of political capital. This finding is relevant
to understanding the motivations behind CEOs’ decisions on firm lobbying policy.
Table 8
Insider Trading and CEO Compensation
Dependent Variable Ln(Total Comp)t+1 Ln(Total Comp)t+1 Ln(Total Comp Opt. Inc)t+1 Ln(Total Comp Opt. Inc)t+1
Sample
(1) (2) (3) (4)
Ln(TwoWeeks) 0.091 0.149
[0.001]*** [0.001]***
Ln(OneWeek) 0.034 0.039
[0.001]*** [0.001]***
Ln(Size)t 0.375 0.385 0.613 0.451
[0.001]*** [0.001]*** [0.001]*** [0.001]***
ROAt 0.112 0.113 0.183 0.133
[0.019]** [0.024]** [0.039]** [0.019]**
BookLeveraget 0.125 0.128 0.204 0.151
[0.001]*** [0.001]*** [0.001]*** [0.001]***
HHIt -0.032 -0.035 -0.052 -0.041
[0.620] [0.120] [0.321] [0.113]
Tobin's Qt -0.098 -0.100 -0.160 -0.118
[0.001]*** [0.001]*** [0.001]*** [0.001]***
Sales Growtht 0.255 0.263 0.417 0.309
[0.001]*** [0.001]*** [0.001]*** [0.001]***
Constant 4.827 4.992 7.892 5.859
[0.001]*** [0.001]*** [0.001]*** [0.001]***
Industry & Year Fixed YES YES YES YES
Num.Cluster 2,634 2,634 2,546 2,546
N 24,344 24,344 21,996 21,996
R2 38% 38% 39% 39%
Table 8 exhibits the relationship between insider transaction and CEO pay for our sample firms. In column (1) to (2), our dependent variable total CEO compensation. In column (3) to (4), our dependent variable is total CEO compensation including options. Ln(TwoWeeks) is the log transformation of the total number of CEO transactions two weeks before the lobbying bill is introduced and passed. Ln(OneWeek) is the log transformation of the total number of CEO transactions one week before the lobbying bill is introduced and passed. Other control variables are calculated from COMPUSTAT. We add period (year) binary variables and industry binary variables but omit the coefficients. Std. Errors are clustered at the firm level. Numbers in parentheses are p-values. *, **, and *** indicate statistical significance at the 10%, 5%, and 1% levels, respectively.
20
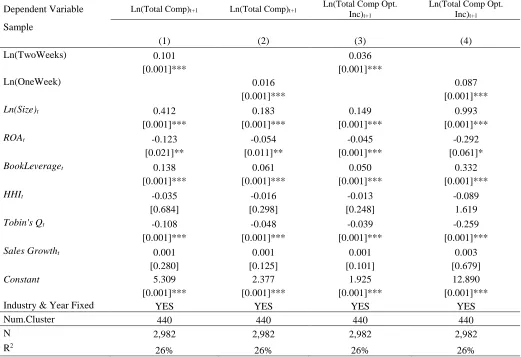
We also test the effect of insider trading on CEO pay, by examining a cross-sectional analysis. We create a
sub-sample and only keep the firms that have insider trading activity reported. We report our findings in
Table 9. In Table 9, our cross-sectional analysis documents that the greater number of insider trading leads
to higher CEO pay. This result is compelling due to CEOs from lobbying firms enjoying greater
compensation packages not only for engaging in lobbying but also from committing insider trading activity.
Higher equity incentives are linked to higher executive total pay (Denis and Xu, 2013).
Table 9
Insider Trading and CEO Pay: Cross-Sectional Analysis
Dependent Variable Ln(Total Comp)t+1 Ln(Total Comp)t+1 Ln(Total Comp Opt. Inc)t+1
Ln(Total Comp Opt. Inc)t+1
Sample
(1) (2) (3) (4)
Ln(TwoWeeks) 0.101 0.036
[0.001]*** [0.001]***
Ln(OneWeek) 0.016 0.087
[0.001]*** [0.001]***
Ln(Size)t 0.412 0.183 0.149 0.993
[0.001]*** [0.001]*** [0.001]*** [0.001]***
ROAt -0.123 -0.054 -0.045 -0.292
[0.021]** [0.011]** [0.001]*** [0.061]*
BookLeveraget 0.138 0.061 0.050 0.332
[0.001]*** [0.001]*** [0.001]*** [0.001]***
HHIt -0.035 -0.016 -0.013 -0.089
[0.684] [0.298] [0.248] 1.619
Tobin's Qt -0.108 -0.048 -0.039 -0.259
[0.001]*** [0.001]*** [0.001]*** [0.001]***
Sales Growtht 0.001 0.001 0.001 0.003
[0.280] [0.125] [0.101] [0.679]
Constant 5.309 2.377 1.925 12.890
[0.001]*** [0.001]*** [0.001]*** [0.001]***
Industry & Year Fixed YES YES YES YES
Num.Cluster 440 440 440 440
N 2,982 2,982 2,982 2,982
R2
26% 26% 26% 26%
21
6.5 Association between lobbying and procurement of government contracts
Our primary concern is that lobbying may increase CEO wealth, but may have no effect (or reduce) firm
value. Previous studies find that lobbying does not benefit firms (Hadani and Schuler, 2013). In this case,
if lobbying does not create wealth for firms, then it is only CEOs, not the shareholders who enjoy the
political spending. This would lead to agency costs, which may stem from the firms compensating CEOs
for being politically engaged in expectation of future regulatory benefits (Skaife, Veenman, and Werner,
2013). To test the effect of lobbying on firm performance, we gather government contracting data and
measure whether lobbying increases access to receiving government contracts. Access to government
contracts can increase firm value.
Table 10
Corporate Lobbying and Government Contract
Dependent Variable Contractt+1 Contractt+1 Contractt+1 Ln(Total Contract)t+1
Ln(Total Contract)t+1
Ln(Total Contract)t+1
Sample
(1) (2) (3) (4) (5) (6)
Lobbydumt 1.085 1.119
[0.001]*** [0.001]***
Ln(LobExp)t 0.397 0.335
[0.001]*** [0.001]***
Ln(Total Bill)t 0.802 1.180
[0.001]*** [0.001]***
Ln(Size)t 0.450 0.419 0.437 0.127 0.121 0.084
[0.001]*** [0.001]*** [0.001]*** [0.001]*** [0.001]*** [0.001]***
ROAt 0.237 0.247 0.233 -0.021 -0.022 -0.013
[0.573] [0.565] [0.571] [0.268] [0.256] [0.287]
BookLeveraget -0.357 -0.392 -0.319 0.094 0.089 0.076
[0.317] [0.278] [0.366] [0.001]*** [0.001]*** [0.001]***
HHIt 0.681 0.674 0.648 0.631 0.618 0.592
[0.045]** [0.051]* [0.058]* [0.056]* [0.063]* [0.054]*
Tobin's Qt -0.411 -0.400 -0.394 -0.732 -0.788 -0.719
[0.001]*** [0.001]*** [0.001]*** [0.001]*** [0.001]*** [0.001]***
Sales Growtht -0.155 -0.157 -0.169 -0.081 -0.078 -0.066
[0.276] [0.274] [0.225] [0.001]*** [0.001]*** [0.001]***
Constant -4.740 -4.579 -4.614 -0.812 -0.778 -0.499
[0.001]*** [0.001]*** [0.001]*** [0.001]*** [0.001]*** [0.001]***
Industry & Year Fixed YES YES YES YES YES YES
Num.Cluster 2,639 2,639 2,639 2,639 2,639 2,639
N 25,112 25,112 25,112 25,112 25,112 25,112
R2 17% 17% 17% 17% 17% 17%
22
We regress government contracting indicators on firm-level lobbying activities and find that lobbying
increases the likelihood of receiving government contracts. These results are in Table 10. Furthermore, we
find that lobbying also increases the total number of contracts granted to firms by government officials. We
propose that lobbying may build political capital which could provide easier access to government granted
contracts. Political lobbying can influence the amount of government contracts a firm receives (Do, Lee,
and Nguyen, 2015; Goldman, Rocholl, and So, 2013). To test the effect of government contracting and
lobbying, we measure the firm performance followed by lobbying activity.
6.6 Association between government contracts and firm value
Lobbying benefits firms through legislation that may provide competitive advantages for firms. This
includes government contracts, where political lobbying influences the selection of which firm is awarded
the government contract. This practice is common for firms that rely on government contracts and is
considered a type of market strategy (Schuler, Rehbein, and Cramer, 2002). This process of political
connections increasing government contract awards and hence firm value is found at the national level in
Goldman, Rocholl, So (2013) and state level in Do, Lee, and Nguyen (2015).
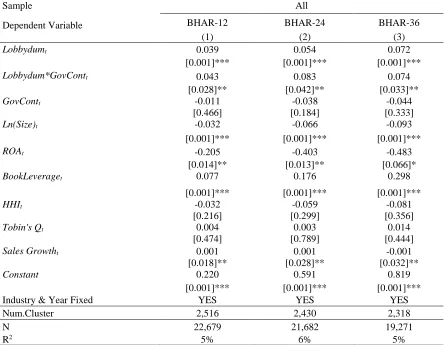
In Table 11, we examine the relationship between the long-term buy-and-hold abnormal returns and
lobbying activity. We calculate +12, +24, and +36 months of buy-and-hold abnormal returns and test
whether lobbying maximizes shareholder wealth. The results in Column 1 indicate that lobbying firms have
better stock performance compared to non-lobbying peers. In addition, the interaction term of lobbying
multiplied by government contracting is significant and positive. This result indicates that lobbying firms
who obtain government contracts have higher stock returns and that the coefficient is statistically
significant. Our results are similar for +24 and +36 months of abnormal returns reported in Column 2 and
3. These results may reveal that lobbying does not only benefit CEO wealth but also increases the firm
value, which mitigates the agency problem. Overall, our findings may build the understanding of the
importance of political information, as well as political engagement, at the firm and CEO level. Government
contracts can be very lucrative, totaling over $6.27 trillion from 2000 to 2014 and receiving these contracts
can thereby benefit firms and increase firm value.9
23
Table 11
Corporate Lobbying and Stock Returns
Sample All
Dependent Variable BHAR-12 BHAR-24 BHAR-36
(1) (2) (3)
Lobbydumt 0.039 0.054 0.072
[0.001]*** [0.001]*** [0.001]***
Lobbydum*GovContt 0.043 0.083 0.074
[0.028]** [0.042]** [0.033]**
GovContt -0.011 -0.038 -0.044
[0.466] [0.184] [0.333]
Ln(Size)t -0.032 -0.066 -0.093
[0.001]*** [0.001]*** [0.001]***
ROAt -0.205 -0.403 -0.483
[0.014]** [0.013]** [0.066]*
BookLeveraget 0.077 0.176 0.298
[0.001]*** [0.001]*** [0.001]***
HHIt -0.032 -0.059 -0.081
[0.216] [0.299] [0.356]
Tobin's Qt 0.004 0.003 0.014
[0.474] [0.789] [0.444]
Sales Growtht 0.001 0.001 -0.001
[0.018]** [0.028]** [0.032]**
Constant 0.220 0.591 0.819
[0.001]*** [0.001]*** [0.001]***
Industry & Year Fixed YES YES YES
Num.Cluster 2,516 2,430 2,318
N 22,679 21,682 19,271
R2 5% 6% 5%
Table 11 exhibits the relationship between obtaining a government contract, lobbying and firm performance for our sample firms. In column (1) to (3), our dependent variable is buy-and-hold abnormal returns calculated for +12,+24, and +36 months period where benchmark index is CRSP Value Weighted portfolio. Lobbydum is equal to one if the firm has lobbying activity, zero otherwise. GovCont is a binary variable and equal to one if firm earns at least one government contract, zero otherwise. Lobbydum*GovCont is an interaction term where Lobbydum is multiplied by GovCont. Other control variables are calculated from COMPUSTAT. We add period (year) binary variables and industry binary variables but omit the coefficients. Std. Errors are clustered at the firm level. Numbers in parentheses are p-values. *, **, and *** indicate statistical significance at the 10%, 5%, and 1% levels, respectively.
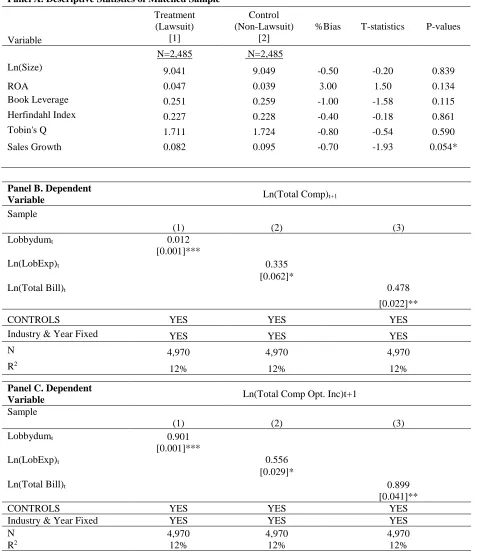
For final robustness of our results, we conduct propensity score matching (PSM) and report our findings in
Table XII. In Panel A, we document the descriptive statistics of our matched sample for the quality of the
PSM. Treatment groups refer to lobbying firms, while control group refers to non-lobbying firms. We show
that there is no difference between our new sample, specifically in terms of firm size, and use it to conduct
multivariate tests. In Panel B and Panel C, we confirm our initial findings; lobbying leads to greater CEO
compensation, respectively. The positive relationship between lobbying and insider trading remain same in
24
introduced. The increased number of transaction eventually benefits the CEO wealth in Panel E; we find
that greater insider trading yields to higher CEO pay.
Table 12
Propensity Score Matching
Panel A. Descriptive Statistics of Matched Sample
Variable Treatment (Lawsuit) [1] Control (Non-Lawsuit) [2]
%Bias T-statistics P-values
N=2,485 N=2,485
Ln(Size) 9.041 9.049 -0.50 -0.20 0.839
ROA 0.047 0.039 3.00 1.50 0.134
Book Leverage 0.251 0.259 -1.00 -1.58 0.115
Herfindahl Index 0.227 0.228 -0.40 -0.18 0.861
Tobin's Q 1.711 1.724 -0.80 -0.54 0.590
Sales Growth 0.082 0.095 -0.70 -1.93 0.054*
Panel B. Dependent
Variable Ln(Total Comp)t+1
Sample
(1) (2) (3)
Lobbydumt 0.012
[0.001]***
Ln(LobExp)t 0.335
[0.062]*
Ln(Total Bill)t 0.478
[0.022]**
CONTROLS YES YES YES
Industry & Year Fixed YES YES YES
N 4,970 4,970 4,970
R2
12% 12% 12%
Panel C. Dependent
Variable Ln(Total Comp Opt. Inc)t+1
Sample
(1) (2) (3)
Lobbydumt 0.901
[0.001]***
Ln(LobExp)t 0.556
[0.029]*
Ln(Total Bill)t 0.899
[0.041]**
CONTROLS YES YES YES
Industry & Year Fixed YES YES YES
N 4,970 4,970 4,970
25
Panel D. Dependent
Variable Ln(TwoWeeks) Ln(TwoWeeks) Ln(TwoWeeks)
Sample
(1) (2) (3)
Lobbydumt 0.779
[0.001]***
Ln(LobExp)t 0.513
[0.001]***
Ln(Total Bill)t 0.889
[0.001]***
CONTROLS YES YES YES
Industry & Year Fixed YES YES YES
N 4,970 4,970 4,970
R2 11% 11% 11%
Panel E. Dependent
Variable Ln(Total Comp)t+1 Ln(Total Comp)t+1 Ln(Total Comp Opt. Inc)t+1 Sample
(1) (2) (3)
Ln(TwoWeeks) 0.091 0.149
[0.001]*** [0.001]***
Ln(OneWeek) 0.034
[0.001]***
CONTROLS YES YES YES
Industry & Year Fixed YES YES YES
N 4,970 4,970 4,970
R2
11% 11% 11%
![Table 5: Panel B. Lobbying and Cumulative Abnormal Returns Dependent Variable CAR[-1,+1]](https://thumb-us.123doks.com/thumbv2/123dok_us/8920992.1841456/25.612.76.544.303.630/table-panel-lobbying-cumulative-abnormal-returns-dependent-variable.webp)