IJEDR1602051
International Journal of Engineering Development and Research (www.ijedr.org)291
Treatability Studies of Pulp and Paper mill waste
water at different pH
Kamlesh M. Rana
Lecturer, Applied Mechanics Engieering department Government Ploytechnique, Navsari, Gujarat, India
________________________________________________________________________________________________________ Abstract - The study of Biokinetic constants gives the complete pattern of the biological activities in the waste water. The various parameter related to microbial growth are useful in design of treatment plants for batter efficiency. This paper study Biokinetis constant of pulp and paper mill waste water at different pH value and suggest that the acidic range is more harmful comparing to the alkaline pH. The acidic range has shown 29% of growth while alkaline range has shown 59% of increment in active microorganism at the end of 1.2 day. The maximum growth in all ranges of pH was found to be at 7 pH.
IndexTerms - BOD, COD. pH, Microorganism, Growth-kinetic, Substrate
________________________________________________________________________________________________________
I.INTRODUCTION
The pulp & paper industry is one of the oldest industries in our county. But there has been a tremendous expansion in this industry during last twenty-five years. The paper industry, as it stands now, is one of the largest industries in our county. And also this is one of the major industries, which contributes a lot towards the pollution of our water environment. The indispensability of paper & its importance in the present society is beyond doubt. The pulp & paper industry caters to this requirement. On one hand we have a growing demand of paper, which is necessary for the overall growth of our society; & other hand we have a need to preserve the forest, which are the main raw materials for this industry. By introducing eco friendly technology; waste minimization; chemical recovery & by efficient design of biological treatment with the help of biokinetic constants.
Paper mill use the ‘pulp’ as the raw material, which is again produced utilizing different cellulosic materials like wood; bamboo, Rice straw and Bagasse. Pulp & paper industry is among 20 highly polluting industries in India. The pulp & paper mill waste characteristically contain very high BOD so that the biological treatment must be required in pulp & paper mill. During the digestion process of bamboo chips black liquor is produced. This black liquor contain a high amount of lignin is not easily biodegradable & unutilized chemical. This black liquor cannot be directly disposed into the stream. Thus the chemical recovery & reuses unutilized chemicals are must be required. Chemical recovery is the heart portion of the pulp & paper mill without it paper mill cannot run. The paper mill industry is water intensive industry. Most of the paper industry is situated at the bank of river. Biodegradable organic substances are always in soluble colloidal or suspended form. These substance are removed through many stages like mass transfer, adsorption, enzymic reactions, etc. to optimize the biodegradation, a rational design based on microbial growth kinetics is necessary for a particular type of waste. Thus, prior information and knowledge of microbial metabolism & growth kinetics are necessary in the design of biological treatment units.
In order to understand the growth, decay and substrate utilization a batch reactor example can be taken, where there is no inflow or outflow.
FIG-1 MICRO ORGANISAM GROWTH PATTERN IN BATCH REACTION LOG GROWTH PHASE (2) STATIONARY GROWTH PHASE (3) ENDOGENUOS GROWTH PHASE
(2) (3)
IJEDR1602051
International Journal of Engineering Development and Research (www.ijedr.org)292
FIG-2 RATE OF MICROBIOLOGICAL METABOLISMIN CONTINOUS BIOLOGICAL REACTION(1) ENDOGENUS GROWTH PHASE (2) STATIONARY GROWTH PHASE (3) LOG GROWTH PHASE (N) NORMAL RANGE OF OPERATIONS IN MOST OF THE BIOLOGICAL REACTIONS
Whenever a bacterium is inoculated, in a batch reactor contained by substrate, it starts oxidation the substrate. As the substrate is exhausted, microbial growth also takes place. A typical growth pattern is shown in fig -1. The growth pattern can be plotted in terms of mass of microorganism versus time. The figure shown three distinct phases: (1) Log or exponential growth phase (2) Declining or retarded growth phase (3) Endogenous growth phase or death phase.
In the first phase, microbes try to acclimatize themselves to the environment. After this, the substrate is utilized rapidly and growth also starts rapidly. Secondly stationary phase comes when the substrate is exhausted. Lastly the declining phase comes, where microbes are forced to metabolize their own protoplasm. This represented as endogenous respiration. The growth pattern-taking place in a batch reactor cannot be applied to a continuous flow reactor. In a continuous flow reactor the metabolism is controlled by the rate of substrate supply and the mass of active microorganism. In other words ‘food –to – microorganism ‘ratio, controls the rate of metabolism in a continuous biological reactor. Low F/M ratio results in to endogenous growth phase, and its high values results into log growth phase. Now the sludge produced in the endogenous phase is of good settling characteristic. Moreover, the same is stable in nature. That is why the biological units are designed, in endogenous phase only. Fig-2 shown, that biological process can be formulated, in terms of changes in substrates concentration or in term of microbiological growth. On the availability of relevant data biological treatment can be designed. However, the microbiological growth kinetics offers a more rational method of its design. The growth rate depends upon environmental factors like pH, temperature, nutrients, present state of oxygen, etc. if, these parameters are controlled, then it will provide ideal conditions for biological growth. To allow the microorganism to grow, they must remain in the system for a specific and enough time periods. Now this period depends upon their growth rate, which is related directly to the rate at which they metabolize the waste. If, growth rate of the microorganism is controlled, then waste can be stabilized effectively. On the basis of this researcher has designed the following objectives
Objectives
The lignin in pulp and paper mill waste water is not easily degradable and it makes COD/BOD ratio of the wastewater is very high. The basis of this study was to determine the biokinetic constants associated with wastewater which will help in design biological treatment process for such waste. So the objective of the study that we include in this paper are: (1) To evaluate the biokinetic constants of pulp and paper mill wastewater (2) To find the influence of flow on performance of setup(3) To find effect of pH on biodegradability (4) To assess the performance of the system. The biokinetic constants described in this study is a function of the environmental condition of this particular mixture of raw material & ambient temperature. Any variation in the above mentioned factor is liable to give erroneous results. This study was conducted on small scale, which gives more efficiency, but same study on large scale can reduce the efficiency
Components of waste water and Permissible limits: Important components of Liquid Effluents from Large pulp and paper industry include: PH value, Colour, Odour, Temperature, Suspended solids, Biochemical Oxygen Demand, Chemical Oxygen Demand, Sulfides, Residual chlorine, Lignin Emission loads form the Mills are regulated by almost all of the pulp and paper industry in our country. Permissible limits of the pollutants to be complied with by large pulp and paper Industry effluents as per ISI – 2490 are given in below Table-1.
Sr NO. Characteristics Units Maximum Tolerance Limit
1 pH - 5.5-9.0
2 Temperature C 40
3 Suspended Solids mg/l 100
4 BOD (5 days at 20 C) mg/l 30
5 COD mg/l 250
6 Dissolved Oxygen mg/l 4
7 Oil and Grease mg/l 10
8 Sulphide mg/l 2.0
(1) (3)
IJEDR1602051
International Journal of Engineering Development and Research (www.ijedr.org)293
9 Sulphate as SO4 mg/l 1000
10 Total Dissolved Solid mg/l 2100
11 Residual Chlorine mg/l 1.0
12 Per cent Sodium mg/l 60
Table-1: Permissible Limit of different parameter of waste water
Effluent standards should be strict enough to protect the quality of the receiving waters and should treat all discharges fairly but in so far as possible should be tailored to the character and volume of wastes at each point of discharge. Country to country re view of the effluent standards to be studied.
II.LITERATURE REVIEW
The study of the biokinetic Constance is important because it gives us a view of the treatment plant design & the nature of the effluent. By studding the biokinetic constants, we are able to predicate the biodegradability & the efficiency of the treatment plant as such. Several studies have been conducted on the biokinetic studies of different effluent from different industries. The pulp & paper mill industry with its unique set of the raw material, high BOD, COD, color provides a challenge to environmental engineers. Several studies were conducted on the biokinetic constants of pulp & paper industry. Some of the relevant studies are reported here with
Biokinetic constants
S. Raghuveer & C.A. Sastry [1], studies were conducted on treatment of combined pulp & paper mill wastewater by activated sludge using laboratory model units by varying aeration time from 4 – 24 hours & MLSS concentration from 1000 –4000 mg/l. During the usage of bamboo, eucalyptus, subabul plus hardwood & bamboo & hardwoods as raw materials for pulp & paper making, combined wastewater samples are collected and experiments were carried out to determine biokinetic constants in laboratory bench scale continuous activated sludge unit. Monod’s kinetic equations were used to determine the biokinetic constants. The values of biokinetic constants of wastewater of (60% Bamboo + 40% MHW) raw materials were obtain by using lab study specific substrate utilization (K) – 1.33, Half velocity constant (KS) – 72.5, yield coefficient (Y) – 2.28; Decay coefficient (Kd) – 0.14
IJEDR1602051
International Journal of Engineering Development and Research (www.ijedr.org)294
Effluent managementManagement of the effluent in E.T. plant is one of the most important factor, which effect the performance of the E.T. plant. The human angle evolved in this segment is one of the most important and paradoxically most confusing aspects. A proper design of effluent management helps in controlling accident and negating the human error associate with the process.
Effect of temperature
The effect of temperature was studied and reported by Dr. J.E.M.Macwan [25] is reviewed here under. A pulp & paper board effluent was taken & biokinetic constants was derived at 29˚ C it was later compared to () by correcting the temperature to 20˚C
temperature by Arthenius equation
20
20 T T
r
r
Where, rT = reaction rate at T˚ C, r20 = reaction rate at 20˚C, θ = temperature activity coefficient, T = temperature ˚C Richard E. Muck & C.P. Leslie Grady; [ 5], Experiments were carried out to find out the effect of temperature upon the biokinetic constants required to characterize microbial growth. This experiment was carried out in Stirred tank reactors. The maximum specific growth rate constant & the bacterial decay rate constant were found to increase with increases in temperature in accordance with the Arthenius equation over the temperature range of 10˚C - 30˚C. The rate of increases of the decay rate constant was slightly larger so that the ratio of the temperature characteristics for decay to that for growth was 1.11. The chemical recovery aspect of pulp & paper mill pays a very important role in the overall economics & pollution control. The necessity of this process was described by Gerald W. Hough [29], A.K. Tripathi, A.K. Srivastava & S.N. Pandey [18], have descried about sources of waste from pulp & paper mill & existing pollution control technique in India.R.D. Ross [33], has descried the operating principle of ESP as a Air pollution control technology.Gerald W. Hough [29], has described the principles and of Kraft liquor recovery process of pulp & paper mill. III.MATERIAL AND METHODOLOGY
Under proper environmental conditions, the soluble organic substance of the soluble organic substances of the waste are completely destroyed by biological oxidation, part of it is oxidized while rest are converted into biological mass, in the biological reactors. The end products of the metabolism are either gas or liquid: on the other hand, the synthesize biological mass can flocculate easily, particularly with increasing mean age of the cells, and are separated out in a clarifier. Therefore, the biological treatment system usually consists of (1) a biological reactor, and (2) a settling tank to remove the produced biomass or sludge.
The objectives in any biological waste treatment studies in the laboratory are usually twofold: (I). to examine whether the waste is amenable to biological treatment or not, and (2) To determine the kinetic growth coefficient that may be used in the design and operation of pilot or prototype plants. The experimental studies may be carried out either in a continuous flow reactor. However a continuous flow reactor should be employed wherever possible, as it’s simulates of prototype closely. Depending on the characteristics of the raw waste, and the expected response to the particular type of biological treatment, the tests are to be conducted to assess the treat ability under aerobic condition. Tests are to be conducted at a constant room temperature. The feed is to be pretreated for the removal of heavy suspended solids and floating oil or grease. The pH of the feed is to be adjusted for the optimum metabolism of the microorganism.
IV.EXPERIMENTAL MODEL
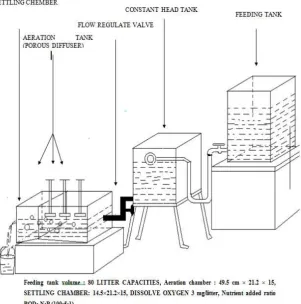
To determine biokinetic constants for a particular waste, a bench scale continuous flow reactor was used. The laboratory model was fabricated by transparent acrylic sheet. Fig-5 shows the schematic diagram of model arrangement. Table shows the dimensions and other details of the model.
Experimental process
The laboratory model was operated on continuous daily feed basis, in which pre calculated quantity of wastewater was fed. During the experimental period the reactor was running under atmospHeric pressure and room temperature, which ranged from 24c to 34 c. The wastewater, for which biokinetic constants were to be determined, was analyzed, for different parameters as show below. The laboratory tests were conducted as per the standard methods.
Parameters Units
PH -
TEMPERATURE ºC
TOTAL SOLIDS MG/LITER
DISSOLVED SOLIDS MG/LITER
SUSPENDED SOLIDS MG/LITER
VOLATILE SUSPENDED SOLIDS MG/LITER
CHLORIDE MG/LITER
TURBIDITY PPM
BOD5(SO) MG/LITER
IJEDR1602051
International Journal of Engineering Development and Research (www.ijedr.org)295
1. It may be noted that the pulp & paper mill wastewater does not contain necessary nutrients for the bacterial growth, andhence Nitrogen & Phosphorous were added to maintain BOD: N: P ratio of the 100: 5: 1 in the feed, throughout the study.
2. The reactor was filled fully and aeration was started. Initial seeding of 200 ml active bio mass sludge was provided, wherever the same was needed. Aquarium aerator was used to build the desired MLSS @ 1000 to 3000.
3. The MLSS was measured periodically. If the same us not built within 24 hours of continuous aeration, then the sludge was allowed to settle and supernatant was decanted. After decanting a fresh batch of feeding was done in the reactor.
4. After the desired level of MLSS was built, adjusting flow started continuous feeding.
5. The flow was adjusted in such a way, that the same should remain consistent for particular period. 6. Five different mean cell residence times, for a particular waste was varied.
7. Wasting of sludge was done at the end of every mean cell residence type.
8. Samples were collected at the end of every mean cell residence time for testing of BOD5 and V.S.S
9. The laboratory model was operated without recycling of solid sludge.
10. The influent and effluent substrate was measured in terms of BOD5 the biomass measured as volatile suspended solids.
Particulars Dimensions
A Feeding tank: 80 Liters
B Reactor:
Aeration chamber
Length (cm) 49.5 Breadth (cm) 21.2
Depth (cm) 15
Setting chamber
Length (cm) 14.5 Breadth (cm) 21.2
Depth (cm) 15
C Baffle:
Length (cm) 17
Depth (cm) 12
D Outlet:
Depth (cm) 12
Table-2: Detail of laboratory model
Aeration
In the presents study the size of aeration tank was 49.5 × 21.2 × 15 cm3 and constants head flow was maintain. The purpose of the
tank was to maintain a optimum biomass and to maintain a particular pH and flow rate. In the aeration chamber the organic material is degraded with the help of microorganism in the presence of oxygen.
Settling
In this study the size of settling tank was 14.5 × 21.2 × 15 cm3 and the purpose of this tank was to settle the biomass.
Parameter significances
BOD: is indicates the amount of biodegradable organic matter which is to be treated from the waste water. it also gives an idea of the amount of oxygen to be supplied in to system which can be consume by the micro organism to stabilizes the organic matters MLVSS in the biological reactor, the concentration of volatile suspended solid (VSS) in the reactor is taken as the concentration of microbial mass. This assumption is true only when the waste under treatment is soluble in nature. Mean cell residence time (θc): the parameter θc is easily controllable, hence it can fixed. In a continuous flow reactor, the effluent concentration and treatment efficiency, E are related directly to θc = θ. Here, the mean microorganism retention time and the liquid retention time is same. That is why separate control to the microorganism is not required. So, it can be stated that longer θc results into higher efficiency of treatment. Shorter the θc lesser is the efficiency as microorganism are not getting enough time for reproduction.
Substrate: the smount of biodegradable substance present in wastewater is called substrate. This substrate can be measured in wastewater by BOD test. F/M ratio: food to microorganism is the ratio of the effluent substrate concentration to the product of cell concentration and mean cell residence time
F/M= S0 / θc X
IJEDR1602051
International Journal of Engineering Development and Research (www.ijedr.org)296
The product of food to microorganism and proc ess efficiency gives the specific substrate utilization rate UU = (F/M)/100
Raw wastewater was collected from the inlet of the effluent treatment plant. The various characteristics of the wastewater were found out before transferring to the feed tank of the bench scale continuous flow reactor. The characteristics are tabulated as below.
Parameters Values
pH 7
Temperature 30ºC
Total Solis 2200 mg/liter Total Suspended Solid (TSS) 800mg/liter Total Dissolved Solid (TDS) 1400 mg/liter
BOD 300 mg/liter
Colour (light honey) Light honey colour
W.W/Flow/day 20000m3/day
COD 1000 mg/liter
Chlorides 500 mg/liter
BOD/COD 0.3
Table -3:– characteristic of pulp & paper mill waste water under study
IJEDR1602051
International Journal of Engineering Development and Research (www.ijedr.org)297
V.TREATABILITY STUDIES AT DIFFERENT PH VAULES.In this laboratory experiment, raw wastewater was collected from the inlet of the effluent treatment plant. The various characteristics of the wastewater were found out before transferring to the feed tank of the bench scale continuous flow reactor. Characteristics are tabulated below.
Parameters At 6 PH At 7 PH At 8 PH Literature Value
Sample-I Sample-II Sample-I Sample-I -II
Sample-I Sample-II
PH 6 6 7 7 8 8 6-10
BOD 300 303 300 315 300 315 240-380
COD 1000 1010 1000 1050 1000 1050 840-1660
BOD/COD 0.3 0.3 0.3 0.3 0.3 0.3 2.95-4.37
T.S 2320 2366 2335 2455 2325 2440 2000-3500
T.S.S 620 635 630 655 625 650 620-1120
T.D.S 1700 1731 1705 1800 1700 1790 1380-2380
Colour LIGHT HONEY COLOUR
Chlorides 565 555 522 512 540 530 500-600
Temperature 30 0C 30 0C 30 0C 30 0C 30 0C 30 0C 30 0C -400C
Table-4: Characteristics of waste water
On comparing the parameters of the influent wastewater of the pulp & paper mill. It was found that the paper mill influent has same characteristics parameters as that of a typical pulp and paper mill wastewater. Thus the result obtain from this study can be applied to any of the pulp and paper industry. The experiment was conducted at room temperature of 30° with three different sets of sample having 6,7,8 PH values reswpectively. The experiment was done with varying values of mean cell residence time of 6, 13.2, 18, 28.8,34.8,42 hours. After each mean cell residence time BOD and MLVSS of effluent were measured following results is obtain during this laboratory experiment.
Biokinetic Constance
Evaluated value at 30ºC temp. Literature Value at 30ºC temp and
at 8 pH
Range of evaluated biokinetic constants Set-I At 6 PH Set-II At 7 PH Set-III At 8 PH
Sample І
Sample II
Sample І
Sample II
Sample І
Sample II
K 1.0 1.052 1.66 1.72 1.33 1.36 1.33 1.0 to 1.72
KS 53.33 57.38 150 156.2 100 110 72.5 53.33 to 156.2
Y 2.72 2.85 3 3.15 2.77 2.80 2.28 2.72 to 3.15
Kd 0.34 0.32 0.20 0.18 0.26 0.24 0.14 0.20 to 0.34
Table-5: Evaluated values of biokinetic constants of pulp & paper mill waste water Where,
K = Specific substrate utilization rate (day-1) Ks = Half velocity constants (mg/litre) Kd = Decay coefficient (day-1)
The values of biokinetic Constants K, Ks and Y at PH value 7 is higher as compare to values observed at pH value 6 and PH value 8. Also decay coefficient Kd is lower for PH value 7. From this it can be concluded that pH 7 is the optimum pH for the wastewater treatment. Any alteration in the PH values has a negative impact of the treatment. Efficiency as K, Ks and Y values tends to become lower as compared with pH value 7. Also the decay constant (Kd) is higher. It is also observed that acidic wastewater to the microbial activity more adversely affected. Therefore to optimize the biological treatment neutralized is desired.
VI.CONCLUSION
IJEDR1602051
International Journal of Engineering Development and Research (www.ijedr.org)298
Neutral pH is the optimum pH for treatment. Acidic and basic wastes reduce the efficiency of treatment. (1) The values of decay constant Kd is almost similar for the three PH values of wastewaters. This indicates that the rate of metabolism, in endogenous pHase, may be remaining constant, for mixed culture in different PH wastewaters. However at a neutral pH, Kd is lowest and hence most suitable. (2) It can be stated that the relationship between substrate concentration and rate of specific substrate utilization, is continuous over the entire range of substrate concentration, as the grapHs for the same follow the same pattern for all the wastewaters. (3) The bioactivity in the initial stage of mean cell residence time was observed to be faster i.e. up to 12 hrs. If, the same is confirmed by further studies, then wasting the degraded substrate may increase the efficiency of the treatment.From this study, it can be stated that, biokinetic constant vary with the composition of wastewaters. Efficiency of the treatment unit as well as Microbial activity is higher at Neutral pH (7.0) value than acidic and basic wastewater. it is recommended that if, a similar lab scale study is carried out for different ranges of biodegradable pollutants, then a definite co relationship can be established between the biodegradable pollutants and the values of biokinetic constants for a particular set of environmental conditions.
REFERENCES
[1] S. Raghuveer & C.A. Sastry, “Biological Treatment of pulp & paper waste water & study of biokinetic constants”, Jr. of Environmental protection, Vol.11-8, Aug.-1991
[2] S. Raghuveer & C.A. Sastry, “Performance of full scale treatment plant treating wastewater generated when different raw materials are used for pulp & paper making”, Jr.of Environmental protection, Vol.11-1, Jan.-1991
[3] S. Raghuveer & C.A. Sastry, “Characteristics of wastewater generated when different raw materials are used for pulp & paper making”, Jr. of Environmental protection, Vol.10-4, April. -1990.
[4] Kevin A. Kahmark; Jay P. Unwin; “pulp & paper effluent management”; water Environment Research Journals; Vol. –71-5; Aug.1999
[5] Richard E. Muck; C.P. Leslie Grady Jr., “Temperature effects on Microbial Growth in CSTR’S”, ASCE, Environmental Div. 100, EE5, pp.1147-1163; 1974(Oct.)
[6]Knudson K. Mark, “Influence of Dissolved oxygen on substrate Utilization Kinetics of Activated sludge”, JWPCF, P.52-59, 1982(Jan.)
[7]Oliver J. Hao, “Effect pf slowly biodegradable organics on kinetics coefficients”, Jr. of Environmental engineering (ASCE), Vol. 113-1; Feb. 1987
[8] Patrick, Ken L, Young, Jim, Ferguson; Kely H; Harrison; Andy; “Advance in chemical recovery.” Vol. 68-3; Mar.1994 [9]Ferguson, Kelly H. “chemical recovery development keep pulping process economically viable.” Proquest science Jr. Vol. 65-2; Feb. 1991
[10]Finchem, Kirk J.;”Black liquour gasification research yield recovery options for future”; proquest science Jr. Vol. 69-11; Nov. 1995
[11]Rao M.N, Datta A. K., “ wastewater treatment”, OXFORD & IBH Publishing Co., 1979.
[12] Metcalf & Eddy, “waste water Engineering, Treatment, Disposal, Ruses”, Tata McGraw – Hill Publishing Co. Ltd., 2003 [13]APHA, AWWA, WPCI, “Standard methods for the Examination of water & waste water”, New York (1976)
[14]Larry D. Benfield, Randall, C.W., “Biological process Design for waste water Treatment”, Prentice – Hall Int. Publication, 1980
[15]Sundstrom D.W.; Klei H.E., “wastewater Treatment”, Prentice- Hall Publication, (1979) [16]Sawyer C.N., Mc Carty P.L., ”Chemistry for Environmental Engineering”.
[17]Gaudy A.F. Jr. and Gaudy E.T., “Microbiology for Environmental Scientists and Engineers”, Mc Graw Hill Book Co. New York, U.S.A., 1980
[18]A.K. Tripathi, A.K. Srivastava., S.N. Pandy.; “Advances in environmental Science”; Ashish Publishing House.; 1993
[19]Neelam Rajvidhya., Dilip Kumar Mardendey.; “Treatment of pulp & paper industrial effluent”, A.H.P Publishing corporation., 1998
[20]Ron Crites.; George Tchbanoglous; “Small & Decentralized water waste Management System”, WCB / Mc Graw – Hill .; 1998 [21]Tom D Reynolds; “Unit operations and processes in Environmental engineering”, Books/Engineering Division Monterey, California; 1982
[22]Nemerow N.L.; “ Theories & practice of Industrial Waste Treatment” Addision Wesley Publishing Co. Inc. New York; 1963 [23]B.G. Liptak, “Environmental Engineer’s Handbook”, Vol-1, water pollution, Chilton Book Co., Render Pemsylvonia (1973) [24]Bharat Patel; Jignesh Sukhdia; “ Handbook on Indian Pulp & paper Industry”; Komal Publications; 1998
[25]Joel M. Macwn; “Evaluation of biokinetic constants of some liquid wastes.”, South Gujarat University , M.E.(Environ.) Dissertation (1986)
[26]T.M. Patel; “Characterization & Treat ability Studies of pulp & paper mill waste in south Gujarat.”; South Gujarat University., M.E.(Environ.) Dissertation (1978)
[27]Leslie Allan E., leem Koht Kaufman; “Pollution in the pulp & paper Industry”, Joanna Underwood; 1975 [28]S. P. Mahajan, “Pollution control in process industries,” Tata Mc Graw – Hill Co; 1978
[29]Gerald Hough., “Chemical Recovery in the Alkaline Pulping process”, Tappi Press; 1985
[30]Kenneth W Britt; “Handbook of pulp & paper Technology”; Reinhold publishing Corporation, 1973
[31]H.R. Jones., “Pollution control & chemical Recovery in the pulp & paper Industry”, Noyes Data Corporation.; 1973
[32]Andrew J. Chase,; “Pulp & paper Technology (Number -1) .” ;University of Marine pulp & paper foundation Education series Vol.- 3; 1983.