Processing and Quality Evaluation of Ready-to-Cook Dehydrated Vegetables Mixture
D.G.C. Asanka Bandaraa, K.H. Saranandab, T. Mahendrana and G. Hariharanc*
a
Department of Agricultural Chemistry, Faculty of Agriculture, Eastern University, Sri Lanka
b
Horticultural Research and Development Institute, Department of Agriculture, Gannoruwa, Sri Lanka
c
Department of Biosystems Technology, Faculty of Technology, Eastern University, Sri Lanka Abstract Vegetables make up a major portion of the diet for human in various parts of the world, play a momentous ingredient in human nutrition and their postharvest losses range from 40-60% following harvest. Therefore, the development of Ready-to-cook (RTC) dehydrated vegetable mixture is one of the value additions to preserve the nutritional content of the vegetables. Accordingly, a study was conducted to develop a RTC dehydrated vegetable mixture by using five different vegetables such as carrot (Daucus carota), cabbage (Brassica oleracea), eggplant (Solanum melongena), green bean (Phaseolus vulgaris) and pumpkin (Cucurbita maxima). The dehydrated RTC vegetable mixtures were prepared to different levels 1.0%, 1.2%, 1.4% and 1.6% (w/w) of pumpkin pulp which served as binding agent while keeping other ingredients as constant. Physico-chemical parameters such as pH, Total soluble solids (TSS), moisture and fiber content were raged between 5.6-5.8, 3.8-5.7˚Brix, 20.6-23.9 % and 3.86-6.89 % respectively. The TSS, moisture and fiber contents of formulated RTC dehydrated vegetable mixtures were significantly differed (p < 0.05) when the levels of added pumpkin puree in the mixture increased from 1.0 to 1.6 %. The microbiological study revealed that the prepared products were safe based on the total plate count test, yeast, mould count and coliform tests. Results of sensory evaluation showed that the product can be consumed with high preference on a 5-point hedonic scale. Based on physico-chemical and
* Corresponding author. Tel.: +94773141971 E-mail address: [email protected]
.
International Journal of Research Publications
Volume-3, Issue-1,April 2018
Accepted and Published Manuscript
Processing and Quality Evaluation of Ready-to-Cook (RTC) Dehydrated Vegetables Mixture
D.G.C. Asanka Bandara, K.H. Sarananda, T. Mahendran, G. Hariharan
PII : D.G.C. Asanka Bandara.100315201880
DOI: 100315201880
Web: http://ijrp.org/paper_detail/81
To appear in: International Journal of Research Publication (IJRP.ORG)
Received date: 18 Apr 2018
Accepted date: 28 Apr 2018
Published date: 06 May 2018
Please cite this article as: D.G.C. Asanka Bandara, K.H. Sarananda, T. Mahendran, G. Hariharan ,
Processing and Quality Evaluation of Ready-to-Cook (RTC) Dehydrated Vegetables Mixture ,
International Journal of Research Publication (Volume: 3, Issue: 1), http://ijrp.org/paper_detail/81
Processing and Quality Evaluation of Ready-to-Cook
Dehydrated Vegetables Mixture
D.G.C. Asanka Bandara
a, K.H. Sarananda
b, T. Mahendran
aand G. Hariharan
c*
aDepartment of Agricultural Chemistry, Faculty of Agriculture, Eastern University, Sri Lanka bHorticultural Research and Development Institute, Department of Agriculture, Gannoruwa, Sri Lanka
cDepartment of Biosystems Technology, Faculty of Technology, Eastern University, Sri Lanka
Abstract
Vegetables make up a major portion of the diet for human in various parts of the world, play a momentous ingredient in human nutrition and their postharvest losses range from 40-60% following harvest. Therefore, the development of Ready-to-cook (RTC) dehydrated vegetable mixture is one of the value additions to preserve the nutritional content of the vegetables. Accordingly, a study was conducted to develop a RTC dehydrated vegetable mixture by using five different vegetables such as carrot (Daucus carota), cabbage (Brassica oleracea), eggplant (Solanum melongena), green bean
(Phaseolus vulgaris) and pumpkin (Cucurbita maxima). The dehydrated RTC vegetable mixtures were prepared to different levels 1.0%, 1.2%, 1.4% and 1.6% (w/w) of pumpkin pulp which served as binding agent while keeping other ingredients as constant. Physico-chemical parameters such as pH, Total soluble solids (TSS), moisture and fiber content were raged between 5.6-5.8, 3.8-5.7˚Brix, 20.6-23.9 % and 3.86-6.89 % respectively. The TSS, moisture and fiber contents of formulated RTC dehydrated vegetable mixtures were significantly differed (p < 0.05) when the levels of added pumpkin puree in the mixture increased from 1.0 to 1.6 %. The microbiological study revealed that the prepared products were safe based on the total plate count test, yeast, mould count and coliform tests. Results of sensory evaluation showed that the product can be consumed with high preference on a 5-point hedonic scale. Based on physico-chemical and
sensory properties, the treatment with 1.2% of pumpkin was selected as the best combination compared to other tested treatments. The product was of having 22% of moisture and could be kept microbiologically safe for 5 weeks at ambient temperature of 30±1oC and 75% of RH.
Keywords: Dehydrated vegetable mixture; physico-chemical parameters; ready-to-cook; shelf life.
1. Introduction
Vegetables are an important part of the healthy diet in human nutrition. Almost all the vegetables are low in calories and fat, they are rich in fibre and vitamins and an array of phyto-chemicals that possess health benefits. Bio-active compounds are capable to protect against a number of diseases such as coronary heart diseases, hypertension and cancers (British Dietetic Association, 2011). Consumption of vegetables in the daily diet has strong association with different health attributes explicitly overall good health, improvement of gastrointestinal health, vision, reduced risks of cancers, heart disease, stroke, diabetes, anaemia, gastric ulcer, rheumatoid arthritis, and other chronic diseases (Prior and Cao, 2000; Keatinge et al., 2010; Oyebode et al., 2014). Vegetable diet with substantial high quantities has been associated with lower risk of cardiovascular disease in humans (Mullie and Clarys, 2011).
Further, most of the vegetables are marketed in fresh form and only a minor quantity is processed because most vegetables are perishable in nature. Intake soon after harvest guarantees ideal vegetable quality. Nutrition is both a quantity and a quality issue, and vegetables in all their many forms confirm an acceptable consumption of most vitamins and nutrients, dietary fibres and phyto-chemicals which can bring a much required measure of balance back to diets contributing to solve many of the nutrition problems (Dias, 2012).
Among common vegetables, carrots (Daucus carota) is high in fibers, carotenoids, vitamins C and E, and phenolics such as p-coumarin, chlorogenic (Alasalvar et al., 2001). Carrot is rich in alkaline elements which purify and revitalize the blood. Contents of carrots include β-carotene (Nagarajaiah and Prakash, 2015) Vitamin B1, B3, B6 and K, manganese and phosphorus (World's Healthiest Food, 2008). Eggplant (Solanum melongena) is primarily consumed as cooked vegetable and commonly characterized by low calorie content and relatively high contents in fibre, K and as well as high antioxidant activity due to presence of high contents of phenolic compounds (José, 2014). Cabbage (Brassica oleracea) is an excellent source of vitamin C and vitamin K, containing more than 20% of the Daily Value (DV) for each of these nutrients per serving (USDA, 2014) and also a good source 10–19% of DV of Vitamin B6 and folate. Green bean (Phaseolus vulgaris) is rich in a number of important nutrients, including potassium, magnesium, folate, iron, and zinc, and are main sources of protein in vegetarian diets. In particular, they are among the only plant foods that deliver significant quantities of the essential amino acid, lysine (Messina, 2014). Carotenoids in green beans include beta-carotene, lutein and zeaxanthin (Eisenhauer et al., 2017). Pumpkins (Cucurbita maxima) is rich in β-carotenes (Muzzaffar et al., 2016), minerals, vitamins, pectin, dietary fibre (Kampuse et al., 2015) phenolic compounds and terpenoids (Crozier, 2003). The yellow-orange characteristic colour of pumpkin is due to the presence of carotenoids.
growth and development of these spoilage-causing microorganisms and slows down enzymatic reactions that take place within food. The combination of these events helps to prevent spoilage in dried food (Boyer, 2008).
Each vegetable group contains a unique combination and quantity of phyto-nutriceuticals, which differentiates them from other groups and vegetables within their individual group. Consumption of five different types of vegetables of different colour is not practically possible due to difficulties face during the preparation. However, (Diet, nutrition and the prevention of chronic diseases: report of a Joint, 2003) stated that World Health Organization (WHO) has set standards with respect to consumption of vegetables in healthy diet by recommending a minimum of 400 g per day. One way of achieving this target is to consume five different types of vegetables in dehydrated form. This can be achieved by mixing five vegetables and dehydrated them to reduce the bulk and consume the equivalent weight per day. With one dish five different types can be provided to meet the daily requirement. Till date, there are no any researches related to RTC dehydrated vegetable mixture. Accordingly, this first initiative investigation was carried out to formulate RTC dehydrated vegetable mixture using five different vegetables such as carrot, cabbage, eggplant, green bean and pumpkin to determine the physico-chemical, sensory attributes and microbial properties and to select the most suitable formulation of RTC vegetable mixture from the prepared formulations.
2. Materials and Methods
2.1.Sample Collection
Mature carrot, eggplant, cabbage, green bean and pumpkin were purchased from vegetable market in Kandy, Sri Lanka. Ready-to-cook vegetables mixture preparation, physico-chemical analysis and organoleptic evaluations were conducted at the Food Research Unit, Horticultural Research and Development Institute, Department of Agriculture, Gannoruwa, Sri Lanka.
2.2.Formulation of RTC Dehydrated Vegetables Mixture
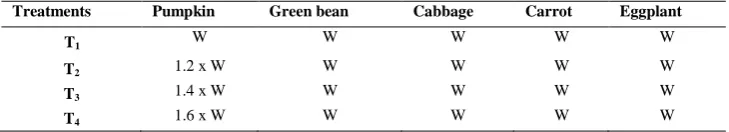
Eggplant (cv: Thinnavelli Purple), green beans (cv: Wade), peeled carrots (cv: Cape Market) and cabbage (cv: Green Coronet) leaves separated from the head were thoroughly washed with chlorinated water (200 mg/ l) at ambient temperature of 30±1oC for 3 minutes to decontaminate and cut separately into 2cm x 1cm pieces by using stainless steel knife. Finally, pumpkin (cv: ANK Ruhunu) was cut into half by knife and seeds were removed. After that they were cut into 2 cm x 1 cm pieces. All the five vegetable pieces were steam blanched separately for 3-5 minutes by using vegetable steamer. After blanching, those vegetable’s pieces were crushed into purees by using electric grinder (KENSTAR Classique 540, India) separately. Then the purees of each vegetable were weighted separately by using electronic balance (Mettler ToledoTM ML6002T/MOO, Fisher Scientific, UK) and the mixtures were prepared according to the proportion shown in Table 1.
Five vegetable’s purees were weighed separately, mixed well and heated separately according to the given formulations (Table 1) for 20 minutes at 55oC. During this time, the purees were mixed well. After 20 minutes, the mixtures were allowed to cool for 2-3 minutes and sodium metabisulfite was added at 0.5 g/kg per each total puree weight and mixed well separately. While heating, the stainless steel metal trays were prepared by spreading small amount of glycerol. The heated puree was separately spread as a thin layer into the tray with 1 cm of thickness. After preparation, all the samples were labelled as T1, T2, T3, and T4. Then,
The dryness of the vegetable mixture was regularly inspected during the drying period. The trays were turned and rotated in every hour during the drying operations.
Table 1. Pulped Vegetable Ratio for the Formulation of Different Vegetable Mixtures
Treatments Pumpkin Green bean Cabbage Carrot Eggplant
T1 W W W W W
T2 1.2 x W W W W W
T3 1.4 x W W W W W
T4 1.6 x W W W W W
W- Weight of each vegetable used in preparation of RTC vegetable
2.3.Physico-chemical Analysis
The pH was measured using a digital pH meter (HANNA HI 98130, UK) with a glass electrode. Total Soluble Solids (TSS) were measured using a Refractometer (ATAGO-S-28E, Tokyo, Japan) equipped with a percentage sugar and expressed as Brix. The moisture and fiber content of the freshly made RTC dehydrated vegetable mixtures was determined using the method recommended by AOAC (2005).
2.4.Microbiological Test
Total Plate Count, Yeast and Mould Count and Coliform Test were performed for the freshly made vegetables mixture according to the methods of AACC (1999). After 48 hours, colonies were counted by using Colony counter (Reichert Darkfield Quebec, USA).
2.5.Preparation of RTC Vegetables Curry using Dehydrated Vegetables Mixture for Sensory Evaluation
Different treatments of vegetables mixtures were cut into small pieces with the specifications of 2cm x 1cm x 1cm and they were kept separately. The ingredients such as 100 ml of water, 300 ml of 3rd portion of coconut milk, 4 g chilli powder, 4 g curry powder, 2 g table salt and 1 g turmeric powder were put into a container and they were allowed to boil for 3 minutes. After that, the cut vegetable mixture cubes finely chopped onion and pieces of tomato were added into it. Finally, 200 ml of 1st portion of coconut milk was poured into the mixture and allowed to the cook well for another 2 minutes. According to above procedure, all treatment samples were prepared.
2.6.Sensory Evaluation
2.7.Statistical Analysis
Parametric data pertaining to the Complete Randomized Design was analysed by Analysis of Variance (ANOVA; α = 0.05) and mean separation was done with Duncan’s Multiple Range Test (DMRT). Data related to sensory evaluation were analysed using the Friedman test in MINITAB statistical software package version 9.1. Both physic-chemical and organoleptic analysis was done through Statistical Analysis System (SAS) software statistical package version 9.3 (SAS Institute, Cary, NC).
3. Results and Discussion
3.1.Physico-chemical Characteristics of the Vegetable Mixture
The initial states of the physico-chemical qualities in the dehydrated vegetable mixtures determine the product stability and quality. The data pertaining to the results of pH, Total Soluble Solids and Moisture content are shown and discussed below.
3.1.1 The pH of the Freshly made RTC Vegetable Mixture
The Figure 1 illustrates the initial pH value of freshly made RTC vegetable mixture. The pH of developed dehydrated RTC vegetable mixture was ranged from 5.6 to 5.8 as shown in the Figure 1. The maximum mean pH of 5.8 was observed in the T3 where the 1.4 times of (weight basis) pumpkin puree was added. The results showed that there were no any significant differences (p > 0.05) between the pH of the RTC dehydrated vegetable mixtures with the addition of pumpkin mixture from 1 to 1.6 %
The initial pH value of treatments was not adjusted hence the initial pH of the treatments were vary. However, the difference among treatments was maximum two decimals. Though the pumpkin is added at different levels the pattern was not observed with the pH range. This might be due to the added levels of pumpkin puree did not impart H+ ions to change the acidity in the dehydrated vegetable mixtures.
Figure 1. Variation of mean pH of Freshly Prepared Vegetable Mixtures
5.4 5.5 5.6 5.7 5.8 5.9
T1 T2 T3 T4
p
H
3.12 Total Soluble Solids, Moisture and Fibre Content of the RTC Dehydrated Vegetable Mixtures
The chemical qualities of RTC dehydrated vegetable mixtures depends entirely on the physico-chemical composition of the vegetables used in this investigation. Elective constituents can be incorporated to produce vegetable mixtures to improved nutritive value of the product. The effect of pumpkin added (1 to 1.6%) on the physico-chemical characteristics viz. TSS, moisture and fiber content of formulated ready to cook dehydrated vegetables mixtures are given in the Table 2.
Table 2. The Total Soluble Solids, Moisture and Fibre Content of RTC dehydrated vegetable mixture
Treatments TSS (ºBrix) Moisture % Fiber %
T1 5.7±0.05a 20.6±0.05
c 3.86 ± 0.01a
T2 5.3±0.03b 21.6±0.33
b 4.92 ± 0.03ab
T3 5.2±0.03b 22.2±0.37
b 5.78 ± 0.05b
T4 3.8±0.05c 23.9± 0.01
a 6.89 ± 0.03c
Values are means of triplicates.
Treatment means in a column having common letter(s) are not significantly different by DMRT 5%.
3.13 Total Soluble Solids in Freshly Made RTC Dehydrated Vegetable Mixtures
Total soluble solids in ready to cook vegetable mixtures were measured immediately after preparation is shown in the Table 2. Initial TSS contents of freshly made vegetable mixtures were ranged from 3.8 to 5.7 brix value. T1 treatment had the highest value of total soluble solids. The results showed that there was a
significant (p < 0.05) differences when the added level of pumpkin from 1 to 1.6 times in the vegetables mixtures. However, there are no any significant differences (p > 0.05) were observed among 1.2 and 1.4% of pumpkin puree added formulations treatments (T2 with a brix value of 5.3 and T3 with 5.2 ºBrix).
3.14 Moisture Content of Freshly Made RTC Dehydrated Vegetable Mixtures
Dried foods have a moisture content below 20% and a water activity 0.7 or <0.7. They are hard and firm, resistant to microbial deterioration. There are critical water activities for some products below which browning is minimized. Storage stability is increased with decreasing the moisture content. But, it was also reported that the maximum rate of deterioration of dried vegetables occurs at a moisture content of 5-8% moisture (Woodroof, 1986).
3.15 Fiber content of Freshly Made RTC Dehydrated Vegetable Mixtures
The fiber content of the prepared RTC mixture increased from 3.86 to 6.89 % with the increased rate of pumpkin mixture added from 1 to 1.6 times (w/w) in the formulation. The higher the pumpkin added in the RTC dehydrated vegetable mixture, the higher the fiber content in the formulations of RTC vegetable mixture was observed. This is supported by See et al., (2007) who made bread from wheat flour supplemented by pumpkin flour had good nutritional value and sensory characteristics with increasing the level of substitution with pumpkin flour from 5% to 15%, the crude fiber content significantly increased.
3.2 Results of Microbial Studies
Results of Total Plate Count, Yeast and Mould Count revealed that all the tested samples were consisting the populations ranged between 0.5- 1 colony forming unit (CFU) per g ×103 and negative results in Coliform Test. This might be due to drying is rarely reduced the number of microorganisms and may apparently increase the number because they are concentrated in a small amount of product.
3.3 Results of Sensory Evaluation of RTC Dehydrated Vegetables Mixture
Sensory analysis provides marketers with an understanding of product quality, directions for product quality, and profiles of competing products and evaluations of product reformulations from a consumer perspective (Stone and Sidel, 2010). The panel was evaluated the colour, aroma, mouth feel, taste, and overall acceptability using five-point hedonic scale and the ranks are shown in the Figure 2.
The values are means of 30 replicates.
Sensory parameters were measured using five-point hedonic scale, 1= Extremely dislike, 5 = Extremely like.
3.3.1Colour
Heating processes can affect the quality of product which leads to consumer dissatisfaction. Lignified texture, slow or incomplete rehydration, colour loss, loss of juicy characteristic, are the negative attributes of dried food (Nicoleti, 2001). The colour of dry product is one of important criteria appreciation of consumers (Marcel, 2014). The T4 treatment (1.6 x W kg of pumpkin pulp taken) had the significantly highest score and T3 treatment (1.4 x W kg of pumpkin pulp taken) had the lowest value of score (Figure 2).
3.3.2Aroma
The retention or loss of aroma compounds is also influenced by the structure amorphous or crystallized) of the dried product (Re, 1998). There was no significant difference in aroma among treatments for aroma (Figure 2). The T1 treatment (W pumpkin pulp taken) had the highest mean value when compare with other treatments. T3 treatment (1.4 x W kg pumpkin pulp taken) had the lowest mean value.
3.3.3 Taste
Taste is a chief parameter when evaluating the sensory attributes of a food and it has the highest impact as far as market success of a product. However, there was no significant difference among treatments was observed. The T2 treatment (1.2 x W kg pumpkin pulp taken) had the highest mean value when compared
with other treatments. No significant difference among treatment shows addition of different levels of pumpkin did not change the taste of the product.
3.3.4Mouth Feel
There was no significant difference (p > 0.05) in mount feel among treatment (Figure 2). Though T2
treatment (1.2 x W kg of pumpkin pulp taken) had the highest mean value when compared with other treatments and T3 treatment (1.4 x W kg of pumpkin pulp taken) had lowest mean value.
3.3.5 Overall Acceptability
As shown in Figure 2, it can be observed that there was no significant difference (p > 0.05) in overall acceptability ratings among treatments. The T2 treatment (1.2 x W kg of pumpkin pulp taken) had the highest
mean value when compare with other treatments.
4. Conclusions
References
AACC., 1999. Microorganisms. Approved Methods of Analysis. 11th Edition, AACC International, St. Paul. Approved.
Alasalvar, C., Grigor, J. M., Zhang, D., Quantick, P. C., Shahidi, F., 2001. Comparison of Volatiles, Phenolics, Sugars, Antioxidant Vitamins, and Sensory Quality of Different Coloured Carrot Varieties.
Journal of Agriculture and Food Chemistry, 49 (3), 1410-1416.
AOAC., 2005. Official Methods of Analysis. 18th Edn. Association of Official Analytical Chemists, Virginia, USA, p 321.
Bhat, M. A., Bhat, A., 2013. Study on Physico-Chemical Characteristics of Pumpkin Blended Cake. Journal of Food Processing Technology, 4 (9), 1-4.
Boyer, R., 2008. Using Dehydration to Preserve Fruits, Vegetables, and Meats, Virginia Cooperative Extension, pp 1-5.
Boyer, R., Huff, K., 2008. Using Dehydration to Preserve Fruits, Vegetables, and Meats, Virginia Tech publication, pp 348-597.
British Dietetic Association. 2011. Food Facts. Available at http://www.bda.uk.com/foodfacts/. Retrieved on 12th of April, 2018.
Crozier A., 2003. Classification and Biosynthesis of Secondary Plant Products: An Overview. In: Goldberg G, editor. Plants: Diet and Health. Oxford, U.K: Blackwell Science, pp 27–48.
Dias, J. S., 2012. Nutritional Quality and Health Benefits of Vegetables: A Review, Food and Nutrition Sciences, 3 (10), 1354-1374.
Diet, Nutrition and the Prevention of Chronic Diseases: Report of a Joint., 2003. WHO/FAO Expert Consultation. WHO Technical Report Series, No. 916. Geneva: World Health Organization.
Eisenhauer, B., Natoli, S., Liew, G., Flood, V. M., 2017. Lutein and Zeaxanthin-Food Sources, Bioavailability and Dietary Variety in Age-Related Macular Degeneration Protection. Nutrients, 9 (2), 1-14. http://doi.org/10.3390/nu9020120.
José, R. S., Sánchez, M. C., Cámara, M. M., Prohens, J., 2014. Composition of Eggplant Cultivars of the Occidental Type and Implications for the Improvement of Nutritional and Functional Quality,
International Journal of Food Science and Technology, 2014 (94), 2774-2784.
Kampuse, S., Ozola, L., Straumite, E., Galoburda, R., 2015. Quality Parameters of Wheat Bread Enriched with Pumpkin (Cucurbita moschata) By-products. Acta Universitatis Cibiniensis, Series E: Food Technology, 19 (2), 3-14.
Marcel, E., Alexis, K., François, G., 2014. Effect of Thermal Process and Drying Principle on Colour Loss of Pineapple Slices, American Journal of Food Science and Technology, 2 (1), 17-20.
Messina, V., 2014. Nutritional and Health Benefits of Dried Beans, The American Journal of Clinical Nutrition, 100 (1), 437-442.
Mullie, P. and Clarys, P., 2011. Association between Cardiovascular Disease Risk Factor Knowledge and Lifestyle. Food and Nutrition Sciences, 2 (10), 1048-1053.
Muzzaffar, S. Baba, W.N. Nazir, N. Masoodi, F.A. Bhat M. M., Bazaz, R., 2016. Effect of Storage on Physicochemical, Microbial and Antioxidant Properties of Pumpkin (Cucurbita moschata) Candy, Cogent Food and Agriculture, 2016 (2), 1-13.
Nagarajaiah S. B., Prakash, J., 2015. Nutritional Composition, Acceptability, and Shelf Stability of Carrot Pomace-Incorporated Cookies with Special Reference to Total and β-Carotene Retention, Cogent Food and Agriculture, 1 (1), 1-10.
Nicoleti, J. F., Telis-Romero, J., Telis, V. R. N., 2001. Air-drying of Fresh and Osmotically Pre-treated Pineapple Slices: Fixed Air Temperature Versus Fixed Slice Temperature Drying Kinetics, Drying Technology, 19 (9), 2175-2191.
Oyebode, O. Gordon-Dseagu, V. Walker, A., Mindell, J. S., 2014. Fruit and Vegetable Consumption and All-cause, Cancer and CVD Mortality: Analysis of Health Survey for England Data. Journal of Epidemiology and Community Health, 68 (9), 856–862. http://doi.org/10.1136/jech-2013-203500.
Prior, R. L., Cao, G., 2000. Antioxidant phytochemicals in fruits and vegetables: Diet and health implications. Horticulture Science, 35 (4), 588-592.
Re, M. J., 1998. Microencapsulation by Spray Drying. Drying Technology. 16 (6), 1195-1236.
See, E. F., Wan, N. W. A., Noor, A. A. A., 2007. Physico-Chemical and Sensory Evaluation of Breads Supplemented with Pumpkin Flour. ASEAN Food Journal, 14 (2), 123-130.
Stone, H., Sidel, J. L., 2010. Sensory Analysis for Food and Beverage Quality Control: A Practical Guide. Oxford: Woodhead Publishing.Tech publication, 2008, pp. 348-597.
USDA., 2014. USDA Database Table for Raw Cabbage, 100 g, National Nutrient Database for Standard Reference, version SR-27. Retrieved on 18th of March 2018.
Woodroof, J. (Ed.)., 2012. Commercial fruit and vegetable processing. Springer Science and Business Media, London, UK.