Ann. Geophys., 30, 991–1001, 2012 www.ann-geophys.net/30/991/2012/ doi:10.5194/angeo-30-991-2012
© Author(s) 2012. CC Attribution 3.0 License.
Annales
Geophysicae
Variability of MLT winds and waves over mid-latitude during the
2000/2001 and 2009/2010 winter stratospheric sudden warming
X. Chen1,2, X. Hu1, and C. Xiao1
1Center for Space Science and Applied Research, Chinese Academy of Sciences, Beijing, 100190, China 2Graduate University of the Chinese Academy of Sciences, Beijing, 100049, China
Correspondence to: X. Hu ([email protected])
Received: 1 December 2011 – Revised: 23 May 2012 – Accepted: 24 May 2012 – Published: 28 June 2012
Abstract. The mesosphere and lower thermosphere (MLT)
wind structure over Wuhan (30◦N, 114◦E) in 2000/2001 winter and over Langfang (39.4◦N, 116.6◦E) in 2009/2010 winter are examined to reveal the effects of stratospheric sud-den warming (SSW) in mid-low-latitude MLT region. The result shows that the MLT daily zonal wind over these two sites reversed from eastward wind to westward wind for sev-eral days during the SSW events. The reversals were almost coincident with the polar stratospheric temperature reach-ing its maximum at 10 hPa, 90◦N and were about ten days prior to the reversal of high latitude stratospheric zonal wind at 10 hPa, 60◦N. The temporal variations of tides, gravity waves and 2-day planetary waves in the mid-latitude MLT showed different behavior during the two SSW events. Dur-ing the 2001 SSW event, MLT diurnal tide reached its maxi-mum when the MLT zonal wind decreased rapidly and SSW event began in polar stratosphere; the activity of 2-day waves decreased after the onset of the 2001 SSW, while the gravity wave increased when the 2001 SSW developed into a major warming. However, in the 2009/2010 winter, the semidiurnal tide and 2-day wave in MLT over Langfang reached a peak about two days earlier than zonal wind reversal at 10 hPa, 60◦N; no significant features were found in diurnal tides, terdiurnal tides and gravity waves related to the 2010 SSW event.
Keywords. Meteorology and atmospheric dynamics
(Mid-dle atmosphere dynamics)
1 Introduction
The stratospheric sudden warming (SSW) event, first ob-served by Scherhag in 1952 (Scherhag, 1952), is a spectac-ular transient phenomenon in the high latitude winter which can influence the whole global atmosphere. It is character-ized by a rapid increase of polar stratospheric temperature accompanied with a deceleration or even reversal of the east-ward zonal winds. A major warming is defined as when the zonal-mean temperature at 10 hPa or below increases pole-ward from 60◦N (a reversal of temperature gradient) and the zonal-mean zonal wind becomes westward. A minor warm-ing is when the temperature gradient reverses but the zonal-mean zonal wind does not reverse and only becomes weakly eastward (Andrews et al., 1987). Major SSWs have been ob-served mainly in the Northern Hemisphere and only one or two times in a winter, while minor SSWs may occur sev-eral times in one winter and may even appear in the South-ern Hemisphere. An SSW event involves profound changes of temperature, winds and circulation in a short time. There-fore, the SSW events provide a good way to investigate the coupling between middle atmosphere and lower atmosphere. The evolution of SSW events at high latitude in strato-sphere is well characterized and understood from extensive observations and research since 1952. The key mechanism of major SSW events is the growth of upward- propagating forced stationary planetary waves from the troposphere and their interaction with the mean flow in the middle atmosphere (Matsuno, 1971).
of eastward zonal winds happened several days before tem-perature maximum in the stratospheric polar cap during the SSW event in February 2001 (Bhattacharya et al., 2004). MLT winds observed at three other stations located at Castle Eaton, 52◦N; Collm, 52◦N and Esrange, 68◦N showed that both zonal and meridional winds changed directions in the mesopause region when the SSW event happened (Jacobi et al., 2003). A study by Hoffmann et al. (2007) showed a short-term reversal of the mesospheric winds followed by a period of strong eastward winds. Dowdy et al. (2007) inves-tigated the response of the polar MLT atmosphere to seven major SSWs (including the February 2001 event) by using MF radars in the Antarctic and the Arctic. They found that on average the zonal winds reversed 4 days earlier in the MLT than in the stratosphere.
In recent years, some observations were carried out at tropical MLT region. Observations at Tirunelveli (8.7◦N, 77.8◦E) during three major SSW events showed that a re-versal of zonal winds occurred several days before the on-set of SSWs at high latitude (Sathishkumar et al., 2009). Mesospheric cooling and stratospheric warming were both observed at the tropics during SSW events (Shepherd et al., 2007).
MLT planetary wave activities during SSW events have also been investigated. Some case studies showed an en-hancement of planetary wave 1 activity in the mesosphere at high latitudes during major warmings (Hoffmann et al., 2007). For the February 2001 SSW, the reversal of zonal component in MLT at Castle Eaton, Collm and Esrange was associated with a planetary-wave oscillation with a period of 10 days (Jacobi et al., 2003). Spectral analyses of South Pole OH airglow brightness measurements from the 1995 and 2002 winters showed amplification of the 4-day wave in the mesosphere preceding the onset of SSW events (Azeem et al., 2005).
Dowdy et al. (2007) found that the response of meso-spheric gravity wave activity varied among different radar sites or different SSW events. Wang and Alexander (2009) found enhanced gravity wave amplitudes in the stratosphere and subdued gravity wave amplitudes in the lower meso-sphere during the SSW events in 2007–2008 winter. They ex-plained these variations with gravity wave propagation con-siderations. Sathishkumar and Sridharan (2009) investigated gravity wave activity with MF radar zonal winds at alti-tudes 84–98 km over Tirunelveli (8.7◦N, 77.8◦E). They re-ported enhancement in gravity wave activity observed during 2005/2006 but not during 1998/1999, and the mean merid-ional winds changed to more equatorward during 2005–2006 but remained poleward during 1998–1999.
However, there are few reports (until now) devoted to the possible effects of SSW events below 40◦N MLT at-mosphere. It is believed that more observations about SSW events help us to understand the dynamics of stratospheric warmings, to interpret upward and downward vertical cou-plings in the winter atmosphere. In this paper, we use the
2000/2001 MLT winds data over Wuhan (30◦N, 114◦E) and the 2009/2010 MLT winds data over Langfang (39.4◦N, 116.6◦E) to investigate changes in the MLT over mid-latitudes associated with SSW events. The prevailing winds, tides, gravity waves and planetary waves during the two SSW events were analyzed and compared with the observations in high latitudes.
2 Data sources and data analysis methods
2.1 Data sources
The MLT wind data used in this study were obtained from Wuhan (30◦N, 114◦E) MF radar and Langfang (39.4◦N, 116.6◦E) MF radar. The MF radar provides measurements of the plasma drift velocity directly. In MLT below 100 km, the neutral wind is almost equal to the ion drift velocity be-cause the ratio of ion gyro frequency to the ion-neutral colli-sion frequency is much less than 1. Therefore, the MF radar wind is taken as the neutral wind for a simple assumption (Reid, 1983; Nozawa et al., 2002). However, above 100 km in MLT, due to the ratio becoming close to and much greater than 1, the ion drift velocity will become much different from the neutral winds (Oyama et al., 2012). The ion drag on the neutrals may induce neutral wind shear and even neutral in-stability (Hall and Aso, 2000).
Wuhan MF radar and Langfang MF radar used the “spaced antenna” (SA) systems and employed full correlation analy-sis techniques to routinely measure winds, just the same as the majority of MF radars in operations around the world. Wuhan MF radar, set up at the end of 2000, aims to ob-serve the MLT winds from 60 to 98 km with 2 km height in-terval and 4 min time inin-terval. It operated at a frequency of 2.01 MHz with 25 kW peak transmitting power, and it was configured with a transmitting antenna of squared dipoles and three receiving antenna of crossed dipoles (Li et al., 2002). With Wuhan MF radar data, Zhang et al. (2004) an-alyzed winds and tides of winter mesopause region; Hu et al. (2006) made a comparison between Wuhan MF radar and Yamagawa MF radar. Langfang MF radar was configured with four antennas arranged in an almost equilateral trian-gle. Langfang MF radar operates at a frequency of 1.99 MHz with 64 kW peak transmitting power. It observes the MLT winds from 60 to 110 km with a 2 km height interval and 4 min time interval. The integration time for one wind profile measurement is 104 s. It provides MLT horizontal wind data ever since May 2009.
X. Chen et al.: MLT winds and waves over mid-latitude during SSWs 993
15 March 2001. For the 2010 SSW event, the MLT winds data series are from 29 December 2009 to 15 March 2010. Since there is no data below 80 km in the night due to the dis-appearance of the ionosphere D layer, only horizontal winds from 80 to 98 km were used.
To reveal the evolution of these two SSW events, we used winds and temperature data from NCEP/NCAR Reanaly-sis project from 25 December 2000 to 15 March 2001 and from 21 December 2009 to 15 March 2010. For more details about the 2010 SSW event, the geopotential height data of Aura Microwave Limb Sounder (MLS) were used to derive the zonal gradient wind in the height range of 10 to 70 km in 2009/2010 winter. The Aura satellite was launched on 15 July 2004 in a near polar, sun-synchronous orbit with a period of approximately 100 min.
2.2 Data analysis
The MLT daily mean winds, tides, gravity waves and 2-day planetary waves were estimated from radar data. In order to get daily mean winds over the two sites, we firstly calculated hourly mean winds in each 1-h bin for each height. Then the hourly mean winds in 1-day were averaged to get the daily mean winds. Considering the data gaps due to power off or instrument reasons, it required at least 16 hourly mean winds in one day at a given height to estimate the daily mean winds. Figure 1 shows the data gaps in hourly mean wind data of Wuhan MF radar in 2000/2001 winter and Langfang MF radar in 2009/2010 winter. Black means data missing in that hour.
[image:3.595.310.545.61.360.2]MLT winds are mostly composed of background winds and wavelike variations, including tides, planetary waves and gravity waves. According to current researches (e.g. Zhang et al., 2004; Hocke and Igarashi, 1999), tide wave with pe-riod of 24 h, 12 h are the most dominant components in MLT region. Amplitude of the 8-h (terdiurnal) tide is also signifi-cant (e.g. Jiang et al., 2009). However, the tide amplitudes with periods equal to or less than 6 h are relatively small in some observations and not always found in analysis of time series (e.g. Oznovich et al., 1997; Kovalam and Vin-cent, 2003; Smith et al., 2004). Therefore, we suppose that the major periods of tides are 24 h, 12 h and 8 h, while the 6-h tide is not considered here. In this paper, diurnal tides, semidiurnal tides, terdiurnal tides and 2-day planetary waves were derived by applying harmonic fitting to the time series of hourly mean winds. The data window was 96 h (4 days) in each fitting and it shifted with a 1-h time step. It required at least 72 h of hourly mean winds in a 96-h window for a given height in each fitting. The amplitudes and phases of tides and 2-day waves were obtained by fitting Eq. (1) with the least square method:
Figure
581
582
Figure 1. (a) Datagaps in hourly mean wind data of Wuhan MF radar in 2000/2001 583
winter and (b) Data gaps in hourly mean wind data of Langfang MF radar in 584
2009/2010 winter. Black means data missing in that hour. 585
Fig. 1. (a) Data gaps in hourly mean wind data of Wuhan MF radar
in 2000/2001 winter and (b) data gaps in hourly mean wind data of Langfang MF radar in 2009/2010 winter. Black means data missing in that hour.
u (t )=u0+a·cos
2
π t 24 −θ24
+b·cos
2
π t 12 −θ12
+c·cos
2π t
8 −θ8
+d·cos
2π t
48 −θ48
(1) whereu (t )is the hourly mean wind, anda,b,c,d are am-plitudes,θ24,θ12,θ8,θ48are phases,tis time in hour, andu0
is the background wind. In the right side of Eq. (1), the con-stant “u0” may include the background wind and long-term
planetary waves (greater than 4 days).
After fitting, the root mean square (RMS) of the residual wind was obtained by calculating the difference between the hourly windsu (t )and the fitted valueu0(t ). This RMS repre-sents mostly gravity wave perturbations with periods longer than two hours. The RMS velocities also include contribu-tions from noise and tides with 6-h period or interacting waves (Haldoupis et al., 2004).
ug= − g0 f a
∂H
∂ϕ (2)
ugr= −M+(M2+2M×ug)1/2. (3)
Whereugrepresents the geostrophic wind,ugrrepresents the
gradient wind,Mis the tangential velocity of Earth rotation and can be calculated byM=acosϕ.g0 is the mean grav-itational acceleration,f is the Coriolis parameter,ais Earth radius (6378 km),H is geopotential height,ϕ is latitude, is the Earth’s rotation rate. Here, we firstly applied the spher-ical harmonics fitting to the geopotential height data in each pressure level in each day, and then calculated the gradient wind by formula (2) and formula (3), resulting in 2.5×2.5 degree grids in the Northern Hemisphere.
Since the Aura satellite is operated in the near polar, sun-synchronous orbit, the obtained data are distributed near two local times in a given day. Thus, the gradient winds derived from them just represent the averages of those local times. Considering the influences of the tidal waves in MLT region and the limitation of the data distribution, we adopted the gradient wind between 10∼70 km and 20◦N∼70◦N in the analysis section.
3 Results
3.1 Features of the SSW event in 2000/2001 winter and variability of the mid-low-latitude MLT winds
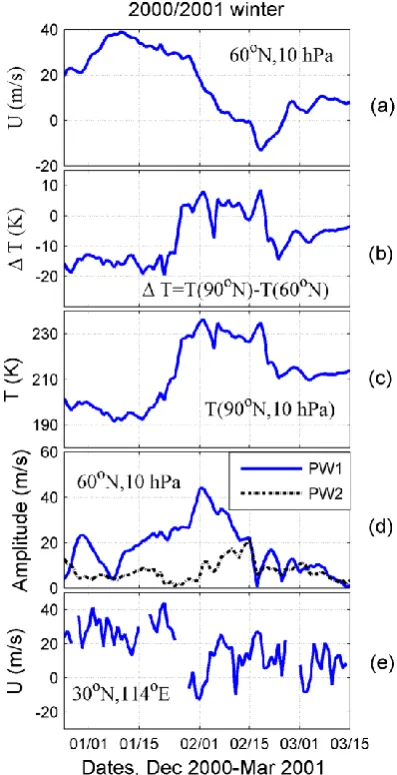
NCEP wind and temperature reanalysis data at 10 hPa in the northern polar region were used to reveal the evolution of the SSW events. Figure 2 shows the evolution of the 2001 SSW event and the daily mean zonal wind at 90 km over Wuhan in the 2000/2001 winter. During the 2001 SSW event, Fig. 2a shows that the zonal mean zonal wind at 60◦N, 10 hPa de-creased rapidly after 15 January 2001 and finally reversed after 11 February 2001, and then westward wind reached its maximum on 18 February 2001. The westward wind turned back to eastward wind after 24 February 2001. The tempera-ture at 10 hPa over the polar region increased from 15 Jan-uary 2001 and peaked on 2 FebrJan-uary 2001, as shown in Fig. 2c. The temperature difference between 90◦N and 60◦N at 10 hPa (Fig. 2b) peaked on 2 February 2001 and 18 Febru-ary 2001. The polar stratospheric temperature at 10 hPa in-creased by more than 40 K within two weeks and then the warm conditions persisted for about 3 weeks. The ampli-tude of stationary planetary waves with zonal wave number 1 (SPW1) increased rapidly from early of Jan and peaked on 2 February 2001, while the amplitude of stationary plane-tary waves with zonal wave number 2 (SPW2) began to grow from the end of January and peaked on 15 February 2001. After 24 February 2001, the zonal mean zonal wind and tem-perature gradient changed back to normal winter condition,
586
Figure 2. The evolution of the 2001 SSW event and daily mean zonal wind over
587Wuhan. (a) Zonal mean zonal wind at 60°N, 10hPa. (b) Zonal mean temperature
588difference between 90°N, 10hPa and 60°N, 10hPa. (c) Temperature at 90°N, 10hPa.
589(d) Amplitudes of SPW1 (blue solid line) and SPW2 (black dotted line) at 60°N, 10
590hPa. (e) Daily mean zonal wind at 90 km over Wuhan.
591Fig. 2. The evolution of the 2001 SSW event and daily mean zonal
wind over Wuhan. (a) Zonal mean zonal wind at 60◦N, 10 hPa.
(b) Zonal mean temperature difference between 90◦N, 10 hPa and
60◦N, 10 hPa. (c) Temperature at 90◦N, 10 hPa. (d) Amplitudes
of SPW1 (blue solid line) and SPW2 (black dotted line) at 60◦N,
10 hPa. (e) Daily mean zonal wind at 90 km over Wuhan.
indicating the end of this major warming event. As seen in Fig. 2a, strictly according to the definition of the World Me-teorological Organization (WMO), the major warming per-sisted from 11 February 2001 to 24 February 2001, when both zonal mean zonal wind and temperature gradient re-versed signs. Actually, this SSW event started around 15 Jan-uary 2001 and ended around late FebrJan-uary. Bhattacharya et al. (2004) revealed the 2001 SSW event with the data at 3.16 hPa. They reported this event began around 17 Jan-uary 2001, and reached the temperature peak around 1 Febru-ary 2001.
[image:4.595.328.527.64.452.2]X. Chen et al.: MLT winds and waves over mid-latitude during SSWs 995
592
Figure 3. The daily mean zonal (a) and meridional (b) winds observed at Wuhan
593
in the height range of 80 to 98 km in 2000/2001 winter. The black lines represent zero
594
wind. Eastward and northward are positive.
595
Dates,2001 (a)
A
lt
it
u
d
e
(
k
m
)
Zonal wind (m/s) over Wuhan , 2001
0
0
01/01 01/15 02/01 02/15 03/01 03/15 80
85 90 95
-20 0 20 40 60
Dates,2001 (b)
A
lt
it
u
d
e
(
k
m
)
Meridional wind (m/s) over Wuhan, 2001
0 0
0 0
01/01 01/15 02/01 02/15 03/01 03/15 80
85 90 95
-30 -20 -10 0 10 20 30
Fig. 3. The daily mean zonal (a) and meridional (b) winds observed
at Wuhan in the height range of 80 to 98 km in 2000/2001 winter. The black lines represent zero wind. Eastward and northward are positive.
is clearly seen at 90 km, as shown in Fig. 2e. On 22 Jan-uary 2001, the daily mean eastward wind almost reached 41 m s−1. After several days of eastward deceleration, the zonal wind reversed into westward wind with a maximum value larger than 16 m s−1 on 31 January 2001. It means the zonal wind at 90 km over Wuhan changed in 57 m s−1 in ten days. The deceleration of the mid-low-latitude MLT eastward jet coincided with the polar temperature increasing and SPW1 growth period.
Figure 3 shows the daily mean zonal and meridional wind structure observed at Wuhan in the height range of 80 to 98 km during the period of 22 December 2000– 15 March 2001. In Fig. 3a, we can see that from the end of 2000 to the first month of 2001, the eastward wind dominated below 96 km and increased with decreasing altitude. Weak eastward and even westward winds appeared above 96 km. Yet a pronounced reversal of the MLT eastward winds oc-curred from late January to early February, which could be
relevant to this SSW event. The strong eastward zonal winds reversed to westward winds around 1 February 2001. At the same time, the eastward winds at 10 hPa decreased sharply and the temperature gradient reversed while the amplitude of SPW1 reached its maximum (Fig. 2d), then the zonal winds resumed quickly to eastward. There were two other weak and short-time zonal wind reversals occurring around 10 ary 2001 and 2 March 2001. The reversal on 10 Febru-ary 2001 is likely to be due to the enhancement of ampli-tude of SPW2 and the reversal around 2 March 2001 might connect to season change. As the spring came in March, the zonal wind became weakly eastward or westward.
Complex day-to-day variations in the 2000/2001 winter meridional winds over Wuhan were shown in Fig. 3b. Rel-atively, the equatorward wind dominated at lower altitudes and showed strong southward winds (reversals of poleward wind) around 1 February and 10 February 2001 below 90 km, concurrent with the zonal winds reversals.
The temporal variations of horizontal winds in MLT at higher latitudes above 50◦N showed similar features for the same winter of 2000/2001 (Bhattacharya et al., 2004; Ja-cobi et al., 2003). They both observed a clear reversal of eastward zonal winds related to the same SSW event in 2001. However, the temporal evolution of the zonal winds and meridional winds at different stations still had differ-ent detailed features which should not be neglected. The zonal winds over Castle Eaton (52◦N, 2◦W), Collm (52◦N, 15◦E) and Esrange (68◦N, 21◦E) reversed from 14 Febru-ary to 24 FebruFebru-ary 2001, showing a response coincident with the major phase of this SSW. While at Resolute Bay (74.9◦N, 94.9◦W), there was an apparent sharp reversal of zonal winds around 1 February 2001 and a slight reversal on 10 February 2001, almost consistent with our results. The differences in MLT winds among different sites may be due to latitudinal and longitudinal discrepancies. More observa-tions and model simulaobserva-tions will help us to have a global view of the MLT response to SSW events.
3.2 Features of the SSW event in 2009/2010 winter and variability of the mid-latitude MLT winds
[image:5.595.49.287.63.427.2]596
Figure 4. The evolution of the 2010 SSW event and daily mean zonal wind over
597Langfang. (a) Zonal mean zonal wind at 60°N, 10hPa. (b) Zonal mean temperature
598difference between 90°N, 10hPa and 60°N, 10hPa. (c) Temperature at 90°N, 10hPa.
599(d) Amplitudes of SPW1 (blue solid line) and SPW2 (black dotted line) at 60°N, 10
600hPa. (e) Daily mean zonal wind at 90 km over Langfang.
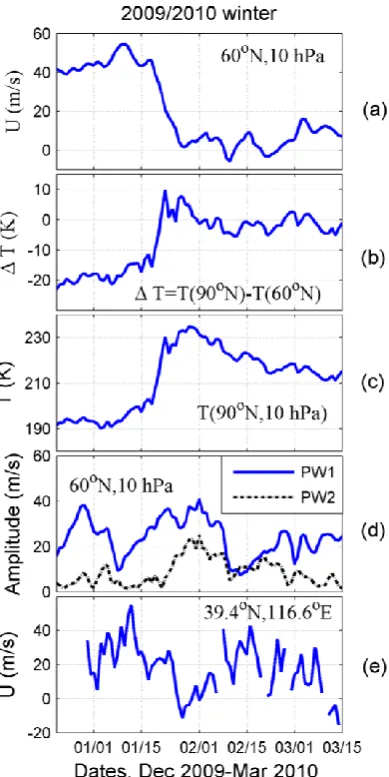
601Fig. 4. The evolution of the 2010 SSW event and daily mean zonal
wind over Langfang. (a) Zonal mean zonal wind at 60◦N, 10 hPa.
(b) Zonal mean temperature difference between 90◦N, 10 hPa and
60◦N, 10 hPa. (c) Temperature at 90◦N, 10 hPa. (d) Amplitudes
of SPW1 (blue solid line) and SPW2 (black dotted line) at 60◦N,
10 hPa. (e) Daily mean zonal wind at 90 km over Langfang.
February. The amplitudes of SPW1 and SPW2 of zonal wind at 60◦N, 10 hPa enhanced since 18 January 2010 and peaked on 1 Febraury 2010, as shown in Fig. 4. It seems that the onset of the two SSW events was accompanied by the en-hancement of SPW1 and they finally developed into a major warming after SPW 2 reached its maximum.
From Fig. 4e, an obvious reversal of daily mean zonal wind at 90 km over Langfang (39.4◦N, 116.6◦E) is found at the early stage of the 2010 SSW event. The MLT eastward wind almost reached 55 m s−1on 12 January 2010 and then decreased tens m s−1in about 15 days. It finally reversed to westward wind with a maximum value larger than 11 m s−1
602
Figure 5. (a)The daily mean zonal wind observed at Langfang in the height range
603of 80 to 98 km and (b) zonal mean zonal gradient wind over 40°N in the height range
604of 10 to 70 km in 2009/2010 winter. The black lines represent zero wind. Eastward
605and northward are positive.
606607
Figure 6.The daily mean meridional winds observed at Langfang in the height
608range of 80 to 98 km in 2009/2010 winter. The black lines represent zero wind.
609 A lt it u d e ( k m )(a)Zonal wind(m/s) over Langfang,MF radar data
0
0
0 0
01/01 01/15 02/01 02/15 03/01 03/15
80 85 90 95 -20 0 20 40 60 80 Dates,2010 A lt it u d e ( k m )
(b)Zonal mean zonal gradient wind(m/s) at 40oN
0
0
01/01 01/15 02/01 02/15 03/01 03/15
10 20 30 40 50 60 70 -20 0 20 40 60 80 Dates,2010 (a) A lt it u d e ( k m )
Zonal wind (m/s) over Langfang , 2010
0
01/01 01/15 02/01 02/15 03/01 03/15
80 85 90 95 -10 0 10 20 30 40 50 60 Dates,2010 A lt it u d e ( k m )
Meridional wind (m/s) over Langfang , 2010
0
0 0
0
0
01/01 01/15 02/01 02/15 03/01 03/15
80 85 90 95 -20 -10 0 10 20
Fig. 5. (a) The daily mean zonal wind observed at Langfang in the
height range of 80 to 98 km and (b) zonal mean zonal gradient wind
over 40◦N in the height range of 10 to 70 km in 2009/2010 winter.
The black lines represent zero wind. Eastward and northward are positive.
on 27 January 2010, about the same time polar temperature reached its peak at 10 hPa on 29 January 2010.
[image:6.595.72.267.62.451.2] [image:6.595.319.534.65.379.2]X. Chen et al.: MLT winds and waves over mid-latitude during SSWs 997
602
Figure 5. (a)The daily mean zonal wind observed at Langfang in the height range
603of 80 to 98 km and (b) zonal mean zonal gradient wind over 40°N in the height range
604of 10 to 70 km in 2009/2010 winter. The black lines represent zero wind. Eastward
605and northward are positive.
606607
Figure 6.The daily mean meridional winds observed at Langfang in the height
608range of 80 to 98 km in 2009/2010 winter. The black lines represent zero wind.
609 A lt it u d e ( k m )(a)Zonal wind(m/s) over Langfang,MF radar data
0
0
0 0
01/01 01/15 02/01 02/15 03/01 03/15
80 85 90 95 -20 0 20 40 60 80 Dates,2010 A lt it u d e ( k m )
(b)Zonal mean zonal gradient wind(m/s) at 40oN
0
0
01/01 01/15 02/01 02/15 03/01 03/15
10 20 30 40 50 60 70 -20 0 20 40 60 80 Dates,2010 (a) A lt it u d e ( k m )
Zonal wind (m/s) over Langfang , 2010
0
01/01 01/15 02/01 02/15 03/01 03/15
80 85 90 95 -10 0 10 20 30 40 50 60 Dates,2010 A lt it u d e ( k m )
Meridional wind (m/s) over Langfang , 2010
0
0 0
0
0
01/01 01/15 02/01 02/15 03/01 03/15
80 85 90 95 -20 -10 0 10 20
Fig. 6. The daily mean meridional winds observed at Langfang in
the height range of 80 to 98 km in 2009/2010 winter. The black lines represent zero wind. Northward are positive.
core peaked at about 50 km and over 55◦N and the eastward wind increased with altitude at mid-low-latitude. On 28 Jan-uary 2010, zonal wind in stratosphere and mesosphere re-versed to westward wind and the zero wind line at 70 km was near 40◦N. The lower mesosphere eastward wind over mid-low-latitude was reduced greatly compared to 10 January. On 10 February 2010, the zonal wind in lower stratosphere reversed to westward wind while the wind in upper strato-sphere and mesostrato-sphere returned to eastward wind. The MLT meridional wind over Langfang also changed from poleward to equatorward and the reversal lasted from 24 January 2010 to 6 February 2010, as shown in Fig. 6. The MLT reversal process almost coincided with the stratospheric polar tem-perature warming, SPW1 growth and the rapid deceleration of stratospheric polar eastward wind, but it is about ten days prior to the reversal in stratospheric polar zonal wind. It was a clear evolution that the 2010 SSW event started in MLT, al-most covered the mid-low-latitude to pole, and then extended to downward and poleward.
3.3 Responses of the mid-low-latitude mesospheric wave activities
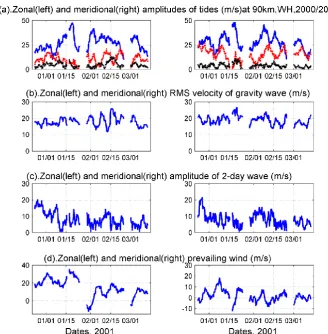
Diurnal, semidiurnal and terdiurnal tides obtained from har-monic fitting of 2001 MF hourly mean wind data over Wuhan at 90 km heights were shown in Fig. 8a. The temporal varia-tions of the tides suggested that the diurnal tide was the dom-inant component in the 2000/2001 winter over Wuhan. Dis-tinctive day-to-day variability of tidal amplitudes was seen at each height. The zonal and meridional amplitudes of diurnal tides showed a clear peak around 18 January 2001. Moreover, the amplitudes of diurnal tides enhanced and were followed by the SPW1 growth at 60◦N, 10 hPa after 10 January 2001. The magnitude of tidal amplitude fluctuations was up to sev-eral tens m s−1with planetary wave scale periods, suggesting interactions among planetary waves and tides. However, tem-poral spectra of tides did not show similar periods at each
al-Northward are positive. 610
611
Figure 7. Zonal mean zonal gradient wind on (a) 10 January 2010, (b) 28 January 612
2010 and (c) 10 Febuary 2010. The black lines represent zero wind. Eastward are 613
positive. 614
Latitude(o) (a)
A lt it u d e (k m )
Zonal mean gradient wind on 10 Jan. 2010
0
0
0
20 30 40 50 60 70
20 40 60 -40 -20 0 20 40
Latitude(o) (b)
A lt it u d e (k m )
Zonal mean gradient wind on 28 Jan. 2010
0
0
20 30 40 50 60 70
20 40 60 -40 -20 0 20 40
Latitude(o) (c)
A lt it u d e (k m )
Zonal mean gradient wind on 10 Feb. 2010
0
0
20 30 40 50 60 70
20 40 60 -40 -20 0 20 40
Fig. 7. Zonal mean zonal gradient wind on (a) 10 January 2010, (b) 28 January 2010 and (c) 10 Febuary 2010. The black lines
rep-resent zero wind. Eastward are positive.
titude. The amplitudes of semidiurnal tide and the periods of their variations over Castle Eaton, Collm and Esrange were also different from each other and from ours (Jacobi et al., 2003). At 94 km the tidal amplitude increased over Esrange but decreased over Collm during the major phase of this SSW event. The periods of the diurnal tidal amplitude variations were about 11–14 days and 20 days over Castle Eaton and Collm, respectively. In our result only 10-day oscillation is visible at some heights.
Figure 8 also gives amplitudes of 2-day waves and the RMS velocities for gravity wave activity with periods longer than two hour. From Fig. 8b, the detailed behavior suggested great fluctuation in the RMS velocities mainly caused by gravity waves during this SSW event (between the late Jan-uary and late FebrJan-uary), especially the zonal component in MLT region. The amplitudes of the 2-day planetary waves showed complex day-to-day variations. Relatively, the am-plitudes weakened after the polar region temperature rise at 10 hPa. However, they did not show clear variations related to the 2001 SSW and the Wuhan MLT wind reversal.
[image:7.595.60.273.59.212.2] [image:7.595.339.513.60.375.2]615
Figure 8. Temporal variation of (a) tides (b) gravity waves (c) 2-day wave and (d)
616prevailing winds obtained from harmonic analysis at 90km hourly mean winds over
617Wuhan during the period of December 22, 2000-March 15, 2001. For the tides,
618diurnal, semidiurnal and terdiurnal tides are blue, red and black respectively.
619620
Fig. 8. Temporal variation of (a) tides, (b) gravity waves, (c) 2-day waves and (d) prevailing winds obtained from harmonic analysis at 90 km
hourly mean winds over Wuhan during the period of 22 December 2000–15 March 2001. For the tides, diurnal, semidiurnal and terdiurnal tides are blue, red and black, respectively.
of MLT winds over Langfang showed that semidiurnal tide and diurnal tide were both important components. The diur-nal amplitude of zodiur-nal wind was sometimes about 15 m s−1 larger than meridional component at 90 km. The diurnal and semidiurnal tides decayed when the polar stratospheric tem-perature reached its maximum and the MLT zonal winds re-versed into westward winds over Langfang from late January to early February 2010. The zonal and meridional amplitudes of semidiurnal tides peaked on 7 February 2010, coincident with the zonal wind resuming into eastward wind.
According to the gravity wave RMS velocity plot in Fig. 9b, there were no significant distinctive variability in gravity wave activity related to the 2010 SSW event or the Langfang MLT wind reversals. The 2-day planetary wave of zonal wind was similar with the semidiurnal tides. It also reached a minimum around late Jan and showed a clear peak on 7 February 2010, about two days earlier than the zonal wind reversal at 10 hPa, 60◦N. The meridional component of 2-day waves was similar with the zonal one to a large ex-tent.
The temporal variations of tides, gravity waves and 2-day planetary waves in MLT over Wuhan in 2000/2001 winter were different from those over Langfang in 2009/2010 win-ter. When the MLT winds started to decrease rapidly and SSW phenomenon began in Polar Regions around 15 Jan-uary 2001, the diurnal tide showed a clear peak while the 2-day wave began to decay, respectively. The activity of gravity increased at the late stage of the 2001 SSW event. However, in the 2009/2010 winter, after a depression periods around late January, the semidiurnal tide and 2-day waves reached their peaks on 7 February 2010, about two days earlier than the zonal wind reversal at 10 hPa, 60◦N. No significant fea-tures were found in other wave components relating to the 2010 SSW event.
4 Discussion
[image:8.595.129.458.59.394.2]X. Chen et al.: MLT winds and waves over mid-latitude during SSWs 999
621
Figure 9. Temporal variation of (a) tides (b) gravity waves (c) 2-day wave and (d)
622prevailing winds at 90km over Langfang during the period of December 29,
6232009-March 15, 2010. For tides wave panel: diurnal, semidiurnal and terdiurnal tides
624are blue, red and black respectively.
625626
Fig. 9. Temporal variation of (a) tides, (b) gravity waves, (c) 2-day waves and (d) prevailing winds at 90 km over Langfang during the period
of 29 December 2009–15 March 2010. For tides wave panel: diurnal, semidiurnal and terdiurnal tides are blue, red and black, respectively.
atmosphere waves showed different variability during the two SSW events. It suggests SSW events in the winter north-ern Polar Region have profound effects on MLT winds in the whole Northern Hemisphere. Moreover, in reference to these SSW events, their temperature gradient reversal at 10 hPa, zonal wind reversal at 1 hPa and almost together with a first minimum of zonal wind at 10 hPa occurred near 2 Febru-ary 2001 and near 28 JanuFebru-ary 2010. Though it was not a ma-jor warming at these times, according to the WMO definition these dates might belong to the center dates of these events in fact. If under this definition, the response of MLT wind over Wuhan and Langfang were simultaneous with SSW events in polar stratosphere.
The mesospheric response to SSW has widely been inves-tigated in the high latitudes with ground measurements data and model simulations. However, there are few observation evidences and model results show mesospheric response in the mid-low latitudes until now. It is difficult to conceive that the mesospheric wind will reverse in the mid-low latitudes which are far from the polar stratosphere where the major warming event happens, especially almost at the same time.
[image:9.595.131.461.58.395.2]stratosphere are also induced by the westward forcing due to planetary waves in winter stratosphere.
The above theory and corresponding simulations can clearly interpret the observed MLT winds reversal at high latitudes. But it does not mean that the reversal of winds in MLT over mid-latitude during SSW event is clear. The re-versal of zonal winds in MLT region over Wuhan and Lang-fang might be attributed to multiple factors. Generally, the zero wind surface of the Northern Hemisphere is near the equator in winter (Matsuno, 1970). Therefore, at mid-low-latitude, it has a strong eastward wind in the upper strato-sphere, mesosphere and lower thermostrato-sphere, as shown in Figs. 7a and 5. The zonal winds over Wuhan and Langfang in winter MLT region are eastward in contrast to that in the high latitudes which can allow stationary planetary waves to propagate and interact with the mean flow. Thus, if planetary waves are strong enough or/and one branch of the upward SPW from high latitudes is refracted to equatorward and up-ward, it would encounter the critical layer in MLT region over mid-low-latitude and finally induce the winds reversal there.
In the nonlinear theory scheme, Yoden (1987) and Hu et al. (1995) analyzed the bifurcation properties of the strato-sphere and mesostrato-sphere winter system with wave-forcings at the bottom boundary. They pointed out that the SSW event is a kind of catastrophe trigged by the increase of plane-tary wave amplitude at the bottom boundary. When the SSW event happens, the stratosphere and the mesosphere system will experience an oscillation state in which the zonal winds might reverse sometime. The observation evidences of this paper prove it is possible the first time, which suggest that the mid-low latitude mesosphere has the same major dynam-ics with the polar region. The mesosphere over mid-low lat-itude could belong to the same middle atmosphere system which is responsible for SSW events.
The results of simulation based on TIME-GCM/CCM3 by Liu and Roble (2002) did not show reversal of MLT zonal winds over mid-low latitude. The reversal of zonal wind only showed up at the high latitude between 40 and 80 km, while the MLT wind over mid-low-latitude was still a strong east-ward wind during that SSW event. But the zonal mean wind between 50 and 80 km over mid-low latitude showed a slight deceleration during the warming episode.
However, observations in different sites or in different winters during SSW events have different characteristics in details, especially about atmospheric waves. Therefore, more work needs to be carried out in order to achieve a clear and global view of the MLT response on the SSW events.
5 Conclusion
MF radar wind observations over Wuhan (30◦N, 114◦E) in 2000/2001 winter and over Langfang (39.4◦N, 116.6◦E) in 2009/2010 winter both showed clear response to SSW
phe-nomenon. There was a consistent change in the wind pat-tern and some distinct feature in atmospheric waves’ be-haviors over Wuhan and Langfang associated with the 2001 SSW event and 2010 SSW event. The MLT zonal wind over both sites reversed from eastward wind into westward wind when the polar temperature reached maximum at 10 hPa and the SPW1 growth at 60◦N, 10 hPa. However, the rever-sal of zonal wind in mid-latitude MLT was about ten days prior to the zonal wind reversal at 10 hPa, 60◦N. The MLT daily mean meridional wind over mid-low-latitude changed to more equatorward during SSWs, especially over Lang-fang (higher latitude) during 2010 SSW. These results were mostly consistent with those in high latitudes MLT.
The temporal variations of diurnal tides, semidiurnal tides, terdiurnal tides, gravity waves and 2-day waves in the mid-low-latitude MLT showed different features during the two SSW events. Over Wuhan in 2000/2001 winter, the MLT di-urnal tide peaked on 18 January 2001 when the stratospheric zonal wind decreased quickly and SSW event started in po-lar winter stratosphere; the activity of 2-day waves weakened after the onset of the 2001 SSW, while the activity of grav-ity enhanced when the SSW developed into a major warm-ing. However, in the 2009/2010 winter, the semidiurnal tide and 2-day waves over Langfang peaked on 7 February 2010, about two days earlier than the zonal wind reversal at 10 hPa, 60◦N; the diurnal, terdiurnal tides and gravity waves over Langfang showed no significant features during the 2010 SSW event.
The dynamical responses of mid-latitude MLT to SSW are very complicated. The possible interactions between PW, tides and gravity waves and their contributions to the mid-latitude MLT responses are not clear, and need to be investi-gated deeper in our future works. The current general circu-lation models can not reveal the observed responses of mid-latitude MLT wind reversal, which suggest that models do not include all the physical processes and need to be im-proved in the future.
Acknowledgements. We thank Alan Z. Liu for critical comments on the manuscript. This work was supported by grants from National Natural Science Foundation of China. The Grant No. is 41104099, 41104100 and 40774087. The authors gratefully acknowledge the access to the NCEP data and AURA MLS data.
Topical Editor C. Jacobi thanks two anonymous referees for their help in evaluating this paper.
References
Andrews, D. G., Holton, J. R., and Leovy, C. B.: Stratospheric sud-den warming, in: Middle Atmosphere Dynamics, pp. 259, Aca-demic Press, 1987.
X. Chen et al.: MLT winds and waves over mid-latitude during SSWs 1001
events during 1995 and 2002, Geophys. Res. Lett., 32, L15804, doi:10.1029/2005gl023393, 2005.
Bhattacharya, Y., Shepherd, G. G., and Brown, S.: Variability of atmospheric winds and waves in the Arctic polar mesosphere during a stratospheric sudden warming, Geophys. Res. Lett., 31, L23101, doi:10.1029/2004gl020389, 2004.
Dowdy, A. J., Vincent, R. A., Tsutsumi, M., Igarashi, K., Mu-rayama, Y., Singer, W., Murphy, D. J., and Riggin, D. M.: Polar mesosphere and lower thermosphere dynamics: 2. Response to sudden stratospheric warmings, J. Geophys. Res., 112, D17105, doi:10.1029/2006jd008127, 2007.
Haldoupis, C., Pancheva, D., and Mitchell, N. J.: A study of tidal and planetary wave periodicities present in mid-latitude sporadic E layers, J. Geophys. Res., 109, A02302, doi:10.1029/2003ja010253, 2004.
Hall, C. and Aso, T.: Identification of possible ion-drag induced neutral instability in the lower thermosphere over Svalbard, Earth, Planets Space, 52, 639–643, 2000.
Hocke, K. and Igarashi, K.: Diurnal and semidiurnal tide in the up-per middle atmosphere during the first year of simultaneous MF
radar observations in northern and southern Japan (45◦N and
31◦N), Ann. Geophys., 17, 405–414,
doi:10.1007/s00585-999-0405-x, 1999.
Hoffmann, P., Singer, W., Keuer, D., Hocking, W., Kunze, M., and Murayama, Y.: Latitudinal and longitudinal variability of mesospheric winds and temperatures during stratospheric warming events, J. Atmos. Solar-Terr. Phys., 69, 2355–2366, doi:10.1016/j.jastp.2007.06.010, 2007.
Hu, X., Zhang, X., and Huang, X.: Bifurcation properties of a strato-spheric vacilation model, Acta Geophysica Sinica, 38, 428–438, 1995.
Hu, X., Zhang, X., Igarashi, K., and Zhang, D.: A preliminary com-parison of observations with MF radars in Wuhan and Yamagawa
at 30–31◦N, J. Atmos. Solar-Terr. Phys., 68, 1036–1042, 2006.
Jacobi, C., Kurschner, D., Muller, H. G., Pancheva, D., Mitchell, N. J., and Naujokat, B.: Response of the mesopause region dynam-ics to the February 2001 stratospheric warming, J. Atmos. Solar-Terr. Phys., 65, 843–855, doi:10.1016/S1364-6826(03)00086-5, 2003.
Jiang, G., Xu, J., and Franke, S. J.: The 8-h tide in the mesosphere
and lower thermosphere over Maui (20.75◦N, 156.43◦W),
Ann. Geophys., 27, 1989–1999, doi:10.5194/angeo-27-1989-2009, 2009.
Kovalam, S. and Vincent, R. A.: Intradiurnal wind variations in the midlatitude and high-latitude mesosphere and lower thermo-sphere, J. Geophys. Res., 108, 4135, doi:10.1029/2002jd002500, 2003.
Li, F., Hu, X., Zhang, D. Y., Zhang, X. J., Huang, Z. R., Xiong, J. G., and Zeng, Z.: Mesospheric MF radar in Wuhan and its pre-liminary observation results, Chinese Journal of Space Science, 22, 65–71, 2002.
Liu, H.-L. and Roble, R. G.: A study of a self-generated stratospheric sudden warming and its mesospheric-lower ther-mospheric impacts using the coupled TIME-GCM/CCM3, J. Geophys. Res.-Atmos., 107, 4695, doi:10.1029/2001JD001533, 2002.
Matsuno, T.: Vertical Propagation of Stationary Planetary Waves in the Winter Northern Hemisphere, J. Atmos. Sci., 27, 871–883, 1970.
Matsuno, T.: Dynamical Model of Stratospheric Sudden Warming, J. Atmos. Sci., 28, 1479–1494, 1971.
Meriwether, J. W. and Gerrard, A. J.: Mesosphere inversion layers and stratosphere temperature enhancements, Rev. Geophys., 42, Rg3003, doi:10.1029/2003rg000133, 2004.
Nozawa, S., Brekke, A., Manson, A., Hall, C., Meek, C., Morise, K., Oyama, S., Dobashi, K., and Fujii, R.: A comparison study of the auroral lower thermospheric neutral winds derived by the EISCAT UHF radar and the Tromsø medium frequency radar, J. Geophys. Res., 107, 1216, doi:10.1029/2000JA007581, 2002. Oyama, S., Kurihara, J., Watkins, B. J., Tsuda, T. T., and Takahashi,
T.: Temporal variations of the ion-neutral collision frequency from EISCAT observations in the polar lower ionosphere dur-ing periods of geomagnetic disturbances, J. Geophys. Res., 117, A05308, doi:10.1029/2011ja017159, 2012.
Oznovich, I., McEwen, D. J., Sivjee, G. G., and Walterscheid, R. L.: Tidal oscillations of the Arctic upper mesosphere and lower thermosphere in winter, J. Geophys. Res., 102, 4511–4520, doi:10.1029/96ja03560, 1997.
Reid, G. C.: The influence of electric fields on radar measurements of winds in the upper mesosphere, Radio Sci., 18, 1028–1034, doi:10.1029/RS018i006p01028, 1983.
Remsberg, E., Lingenfelser, G., Harvey, V. L., Grose, W., Rus-sell III, J., Mlynczak, M., Gordley, L., and Marshall, B. T.: On the verification of the quality of SABER tempera-ture, geopotential height, and wind fields by comparison with Met Office assimilated analyses, J. Geophys. Res., 108, 4628, doi:10.1029/2003jd003720, 2003.
Sathishkumar, S. and Sridharan, S.: Planetary and gravity waves in the mesosphere and lower thermosphere region over Tirunelveli
(8.7◦N, 77.8◦E) during stratospheric warming events, Geophys.
Res. Lett., 36, doi:10.1029/2008gl037081, 2009.
Sathishkumar, S., Sridharan, S., and Jacobi, C.: Dynamical response of low-latitude middle atmosphere to major sudden stratospheric warming events, J. Atmos. Solar-Terr. Phys., 71, 857–865, 2009. Scherhag, R.: Die explosionsartige Stratosph¨arenerwarmung des Sp¨atwinters 1951/52, Ber. Deut. Wetterdienstes, 6, 51–63, 1952. Shepherd, M. G., Wu, D. L., Fedulina, I. N., Gurubaran, S., Rus-sell, J. M., Mlynczak, M. G., and Shepherd, G. G.: Stratospheric warming effects on the tropical mesospheric temperature field, J. Atmos. Solar-Terr. Phys., 69, 2309–2337, 2007.
Smith, A. K., Pancheva, D. V., and Mitchell, N. J.: Observations and modeling of the 6-hour tide in the upper mesosphere, J. Geophys. Res., 109, D10105, doi:10.1029/2003jd004421, 2004.
Wang, L. and Alexander, M. J.: Gravity wave activity dur-ing stratospheric sudden warmdur-ings in the 2007–2008 North-ern Hemisphere winter, J. Geophys. Res., 114, D18108, doi:10.1029/2009jd011867, 2009.
Xiao, C. Y., Hu, X., and Tian, J. H.: Analysis and comparison of deriving winds from satellite temperature data, Chinese Journal of Geophysics, 51, 325–336, 2008.
Yoden, S.: Bifurcation properties of a stratospheric vacillation model, J. Atmos. Sci., 44, 1723–1733, 1987.