Open Access
Research
Tango's maximized excess events test with different weights
Changhong Song*
1and Martin Kulldorff
2Address: 1Department of Statistics, University of Connecticut, Storrs, CT, 06269, USA and 2Department of Ambulatory Care and Prevention, Harvard Medical School and Harvard Pilgrim Health Care, 133 Brookline Avenue, 6th Floor, Boston, MA 02215, USA
Email: Changhong Song* - [email protected]; Martin Kulldorff - [email protected] * Corresponding author
Abstract
Background: Tango's maximized excess events test (MEET) has been shown to have very good statistical power in detecting global disease clustering. A nice feature of this test is that it considers a range of spatial scale parameters, adjusting for the multiple testing. This means that it has good power to detect a wide range of clustering processes. The test depends on the functional form of a weight function, and it is unknown how sensitive the test is to the choice of this weight function and what function provides optimal power for different clustering processes. In this study, we evaluate the performance of the test for a wide range of weight functions.
Results: The power varies greatly with different choice of weight. Tango's original choice for the weight function works very well. There are also other weight functions that provide good power.
Conclusion: We recommend the use of Tango's MEET to test global disease clustering, either with the original weight or one of the alternate weights that have good power.
Background
Many tests for spatial randomness that adjust for a heter-ogeneous background population have been proposed. These test statistics are used to test whether the geograph-ical distribution of disease is random or not. They are also used in many other areas such as geomorphology, ecol-ogy, genetics and geography (See, e.g., Fotheringham et al. [1], Gatrell et al. [2], Ruiz-Garcia [3], Aubry and Piegay [4], Clark and Richardson [5], Liebhold and Gurevitch [6], Gustine and Elwinger [7], Meirmans et al. [8]).
Among these test statistics, some are global clustering tests used to evaluate the presence of clustering throughout the study region. Others are used to detect and evaluate local clusters. In this paper, we are only concerned with the former. Examples of global clustering tests are Tango's maximized excess events test (MEET) [9], Cuzick and
Edwards' k nearest neighbors (k-NN) [10] and Moran's I
[11].
When we are using a global clustering test, it is important that it has good statistical power. We have previously [12,13] evaluated the power of seven global clustering tests: Besag-Newell's R [14], Bonetti-Pagano's M statistic [15], Cuzick-Edwards' k-NN, Moran's I, Swartz' Entropy test [16], Tango's MEET and Whittemore's test [17]. The power varies greatly for different test statistics and Tango's MEET has the best power overall.
Tango's MEET depends on a weight function. Tango pro-posed a distance based exponential weight function for
MEET', but other choices of weights are also possible. In this paper, we evaluate Tango's MEET using different weight functions. Nine weight functions are evaluated,
Published: 15 December 2005
International Journal of Health Geographics 2005, 4:32 doi:10.1186/1476-072X-4-32
Received: 25 July 2005 Accepted: 15 December 2005
This article is available from: http://www.ij-healthgeographics.com/content/4/1/32 © 2005 Song and Kulldorff; licensee BioMed Central Ltd.
and the power varies greatly with different choice of weight.
Methods
NotationDenote ci as the number of cases in county i, ni as the pop-ulation size of county i, C as the total number of cases, N
as the total population size, H as the total number of counties, dij as the distance between county i and j, uj(i) as the population size in county i and its j nearest neighbors. The maximum distance between county i and the other counties under study is denoted by dmaxi = max1≤j≤ndij.
Tango's MEET
Tango's [9] MEET is a maximized version of Tango's excess events test (EET) [18]. We first describe the latter.
For a given weight function wij, Tango's EET is a weighted sum of excess events defined as
Tango proposed two distance based exponential weight
functions [9] and [18], where λ
is a measure of the spatial scale of clustering. To avoid confusion with other weight functions, we denote the EET
defined by these two distance based exponential weight functions as
and
DE1_EET and DE2_EET depends on the scale parameter λ. To be able to detect clustering irrespectively of its geo-graphical scale, Tango [9] proposed the maximized excess events test (MEET). We use notation DE1_MEET and
DE2_MEET to denote the maximized tests of DE1_EET
and DE2_EET respectively, which are defined as
and
where de1_eet(λ) and de2_eet(λ) are the observed values of DE1_EET(λ) and DE2_EET(λ) conditioning on λ. U is an upper limit on λ. Basically, the maximized test is using the minimum of the profile p-values as the test statistics adjusting for the multiple testing resulting from the many parameter values considered.
Alternative weight functions
Since Tango's MEET performs very well, it is of interest to evaluate other potential weight functions, of which there are many. Nine weight functions including Tango's dis-tance based exponential weights are evaluated in this paper. Five of them depend on a spatial scale parameter while four of them do not.
For all weights function, the weight decreases with increasing distance. The metric used for the decrease is dif-ferent though. For example, the weight may be defined on Euclidean distance and depends only on distance. It may also be adjusted with population density, so that the weight declines faster in urban than in rural areas. We can also define the weight in terms of spatial contiguity of counties irrespective of the population density. Other choices of weight functions may take geographical or pop-ulation size into consideration. We describe our weight functions next.
Population density adjusted exponential weight
The scale of the spatial clustering usually depends on the underlying population. It will be reasonable to adjust the weight function with the underlying population density.
We define this weight function as , where
and mi = max{j : uj(i) ≤k}. The parameter k is set
by the user and can be viewed as a population measure for the clustering. Note that for a given k, λi in the rural area, which has a small population density, is larger. This means the hazard rate in the rural area decreases slower than that of urban area as the Euclidean distance becomes large. Usually, large k is more sensitive to large clusters and small k is more sensitive to small clusters. To study the strength of the parameter, we take the value of k equal to 50%, 25%, 10% and 5% of the overall population. We denote the test statistic with this weight function as
PE_EET and
EET w c n C N c n
C N
ij i i j j
j i
=
∑
∑
( − )( − ).wij e
dij = −4
2
( )
λ wij e
dij = −λ
DE EET e c n C N c n
C N
d
j i
i i j j
ij
1_ ( )λ =
∑
∑
−λ( − )( − ).DE EET e c n C
N c n C N
d
j i
i i j j
ij
2 4
2
_ ( )λ =
∑
∑
−(λ) ( − )( − ).DE MEET P DE EET de eet H
U
1 1 1
0 0
_ = min ( _ ( )> _ ( ) , )
≤ ≤λ λ λ λ
DE MEET P DE EET de eet H
U
2 2 2
0 0
_ = min ( _ ( )> _ ( ) , ),
≤ ≤λ λ λ λ
wij e
dij
i = −4
2
( )
λ
λi =dimi
PE EET k e c n C N c n
C N
d
j
i i j j
i
ij i
_ ( )=
∑
∑
−4 / ( − )( − ).Nearest neighbor adjusted weight
Another potential weight function, based on the nearest
neighbors property, is defined by , where l
indicates that county j is the lth closest county to county i. So the weight for county i itself is 1, the weight for its
clos-est neighbor is , the weight for its second closest
neighbor is , and so on. This weight function is
based on spatial contiguity of counties adjusted with dis-tance. It may be desirable when the hazard risk does not decrease proportionally with distance. A small value of the parameter s will give more weight to the counties far from county i, while a large s will give more weight to county i and its closest neighbors. We set s = 0.1, 0.5, 1, 2, 8 to study the property of the parameter. We denote the
EET test statistic with this weight as
Distance adjusted weight
The next weight function is defined by
. This weight function gives more
weight to the counties that are geographically close to each other. The 1 in the denominator is used to adjust the weight so that when the distance is very small, the weight will not be too large. H is used to adjust the weight with the total number of counties. The EET test with this weight is written as
Distance and area adjusted weight
For a different spatial statistical method, Gangnon and Clayton [19] used the weight function
, where ai denotes the area of
county i, A denotes the total area of all counties. The test statistic is denoted as
Distance and population adjusted weight
By replacing the area size in the above weight function with population size, we get another weight function
. The test statistic is
Adjacent neighbor weight
If we define two individual persons to be neighbors if they are in the same county or neighboring county, then we can get the stepwise weight function
Test statistic with this weight is
Population based weight
Another possible weight function is to use the product of the proportion of the corresponding counties to the total
population, so that . The test statistic is then
Note that this population based weight does not take into account any distance information between counties.
Maximized tests over spatial scale parameters
Three EET tests, PE_EET, NN_EET and D_EET, depend on a parameter. By using Tango's maximization technique, which uses the minimum profile p-value of EET for the parameter, we get the maximized tests for these three tests. For PE_EET(k), the MEET is defined as
where pe_eet(k) is the observed value of the excess events test statistic conditioning on k, and V is an upper limit on
k. H0 denotes the null hypothesis of no spatial correlation for the data. Our implementation of the test is carried out by choosing k as 5%, 10%, 15%, ..., 50% of the popula-tion.
w l
ij s = 1
1 2 s 1 3 s
NN EET s
l c n C N c n
C N
s
j
i i j j
i
_ ( )=
∑
∑
( ) (1 − )( − ).w d d H ij ij i s = + ∗
( 1 )
1
max
D EET s
d
d H
c n C N c n
C N
ij i
s
i i j j
j i _ ( )= ( ) ( )( ). + ∗ − −
∑
∑
1 1 maxw w a
A
d d
d
area ij i
i j ij
i = = (max+1)−
DA EET w c n C N c n
C N
area i i j j
j i
_ =
∑
∑
( − )( − ).w w n
N
d d
dmax
pop ij i
i j ij
i = = (+1)−
DP EET w c n C N c n
C N
pop i i j j
j i
_ =
∑
∑
( − )( − ).wnb =wij = 1
0
if country i and j are neighbors or i = j. if countrry i and j are not neighbors.
N EET w c n C N c n
C N
nb i i j j
j i _ =
∑
∑
( − )( − ). w n N n N ij i j = ∗P EET n N
n N c n
C N c n
C N
i j
i i j j
j i
_ =
∑
∑
∗ ( − )( − ).PE MEET P PE EET k pe eet k H k
k V
_ = min ( _ ( )> _ ( ) , ),
≤ ≤
Similarly, for NN_EET(s), we define the MEET as
where nn_eet(s) is the observed value of the excess events test statistic conditioning on s. The implementation of this test is carried out by choosing s as 0.1, 0.25, 0.5, 1, 1.5, 2, 4, 8, 10. The MEET for D_EET(s) is similar to NN_EET(s), and it is defined as
The implementation of this test is carried out by the same collection of s as for NN_MEET.
Benchmark data
To evaluate statistical power, we used a collection of benchmark data sets based on the 1990 female popula-tion in the 245 counties and county equivalents in the northeastern United States, consisting of the states of Maine, New Hampshire, Vermont, Massachusetts, Rhode Island, Connecticut, New York, New Jersey, Pennsylvania, Delaware, Maryland and the District of Columbia. The benchmark data has been described in detail elsewhere [13]. It can be downloaded at 'http://www.satscan.org/ datasets'.
Under the null hypothesis of no clustering, 99,999 ran-dom data sets were generated by ranran-domly allocating 600 cases to various counties, with the probabilities propor-tional to the county population. The null data is used to estimate the critical values, which is the cut-off point for the significance.
For each clustering model, 10,000 random data sets were used to estimate the power. The counties are tied together sequentially on a chain that passes through each county exactly once, after which it reconnects with the first county on the chain, forming a Hamiltonian cycle. A map of the Hamiltonian cycle used has been illustrated in figure 1. The clusters are generated by first locating 300 cases ran-domly on the map under the null hypothesis. Then each of these original cases generates one new case for a total of 600. There are three types of clustering models with the distance between the twins along the chain being either constant or exponentially distributed with different means. For the first type of clustering models, the distance between twins is zero, which means the twins are always in the same county. For the second type of clustering, six clustering models were constructed by setting the distance between twins to be fixed with the mean corresponding to 0.5%, 1%, 2%, 4%, 8% and 16% of the overall population along the chain. For the third type of clustering models,
NN MEET P NN EET s nn eet s H s
s
_ =min ( _ ( )> _ ( ) , ),
≤
0 0
D MEET P D EET s d eet s H s
s
_ =min ( _ ( )> _ ( ) , ).
≤
0 0
Hamiltonian chain of counties used for the global chain clustering Figure 1
the distance was set to be exponentially distributed and span over 0.5%, 1%, 2%, 4%, 8% and 16% of the overall population size. The Hamiltonian cycle does not imply that the disease itself spreads around the chain, just that twin cases are located in either of the two directions, as defined by the chain.
Results
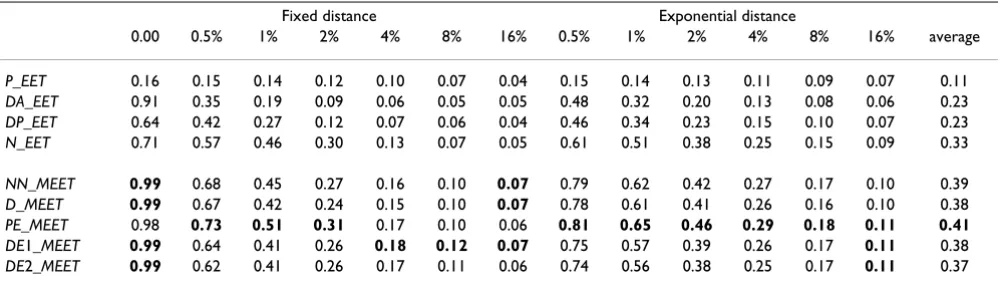
Table 1 shows the estimated power of Tango's EET and
MEET with different choice of weight. The highest power for each clustering model is highlighted. The power varies
greatly with different choice of weight. PE_MEET,
DE1_MEET, DE2_MEET, NN_MEET and D_MEET all have very good power. DA_EET, DP_EET and N_EET have good power for some clustering models, but not as good as the
MEET tests. P_EET does not perform well. All tests have lower power as the distance between twins increases since there is less clustering in the data.
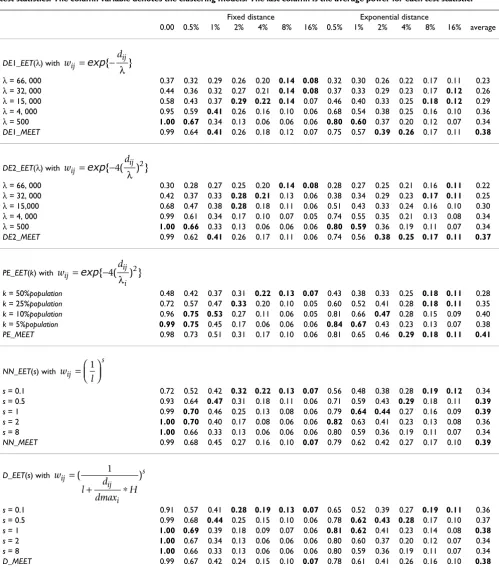
In Table 2, we present the estimated power of the four weight functions that depend on a parameter. For each weight function, we choose different parameter values that can represent its overall strength and compare them with the maximized test. For DE1_EET(λ), DE2_EET(λ) and PE_EET(k), large parameter value is more sensitive to clustering with large scale, while small parameter value is more sensitive to clustering with small scale. For
NN_EET(s) and D_EET(s), large parameter value is more sensitive to clustering with small distance, while small parameter value is more sensitive to clustering with large distance. DE1_EET(λ) and DE2_EET(λ) have very similar performance, but DE2_EET(λ) is more sensitive to the choice of parameter. For all the five tests, the maximized tests have less power compared to the maximum power that can be obtained by the EET test with an appropriately chosen parameter, but the maximized test has reasonably good power overall. For example, for the fixed 1% dis-tance clustering, the maximized test PE_MEET has the power of 0.73. The original test PE_EET(k) has the power
of 0.75 with k equal to 5% or 10% of the population, but it has a low power of 0.42 when k is 50% of the popula-tion.
Discussion
In this paper, we evaluated Tango's EET and MEET using both used and unused weight functions. The power can vary greatly with the choice of weight. This indicates that for global clustering test, consideration of weight is important. For the weight functions that incorporate good distance information, the power of the test is much better than the weight functions that do not incorporate the spa-tial relationship between counties.
With reasonable parametric distance based weights, the power of Tango's MEET is rather robust. For this study,
PE_MEET, DE1_MEET, DE2_MEET, NN_MEET and
D_MEET all have good power, and their average power for all clustering models considered are very similar.
Tango's DE1_MEET and DE2_MEET scan over the study area by distance. These two tests have similar perform-ance. Both tests are based on the summation of the weighted excess events and they collect clustering infor-mation throughout the map, which makes them good glo-bal tests. Previous studies [12,13] indicated that
DE2_MEET perform well when the cluster is large in pop-ulation size.
For the clustering models considered in this paper,
PE_MEET performs a little better than the tests with other weights. The reason for this may be due to the way that the data were generated based on the population density. We believe some of the test statistics may have better strength under other alternate models. We use the female popula-tion in the 245 counties and county equivalent in North-eastern United States as the underlying population. It is possible that the relative strength of the various test statis-tics may be different for other underlying population or
Table 1: Power of the test statistics for the global twin clustering. The row variable denotes the test statistics. The column variable denotes the clustering models. The last column is the average power for each test statistic.
Fixed distance Exponential distance
0.00 0.5% 1% 2% 4% 8% 16% 0.5% 1% 2% 4% 8% 16% average
P_EET 0.16 0.15 0.14 0.12 0.10 0.07 0.04 0.15 0.14 0.13 0.11 0.09 0.07 0.11
DA_EET 0.91 0.35 0.19 0.09 0.06 0.05 0.05 0.48 0.32 0.20 0.13 0.08 0.06 0.23
DP_EET 0.64 0.42 0.27 0.12 0.07 0.06 0.04 0.46 0.34 0.23 0.15 0.10 0.07 0.23
N_EET 0.71 0.57 0.46 0.30 0.13 0.07 0.05 0.61 0.51 0.38 0.25 0.15 0.09 0.33
NN_MEET 0.99 0.68 0.45 0.27 0.16 0.10 0.07 0.79 0.62 0.42 0.27 0.17 0.10 0.39
D_MEET 0.99 0.67 0.42 0.24 0.15 0.10 0.07 0.78 0.61 0.41 0.26 0.16 0.10 0.38
PE_MEET 0.98 0.73 0.51 0.31 0.17 0.10 0.06 0.81 0.65 0.46 0.29 0.18 0.11 0.41
DE1_MEET 0.99 0.64 0.41 0.26 0.18 0.12 0.07 0.75 0.57 0.39 0.26 0.17 0.11 0.38
Table 2: Power of the test statistics for the global twin clustering using different spatial scale parameters. The row variable denotes the test statistics. The column variable denotes the clustering models. The last column is the average power for each test statistic.
Fixed distance Exponential distance
0.00 0.5% 1% 2% 4% 8% 16% 0.5% 1% 2% 4% 8% 16% average
DE1_EET(λ) with
λ = 66, 000 0.37 0.32 0.29 0.26 0.20 0.14 0.08 0.32 0.30 0.26 0.22 0.17 0.11 0.23
λ = 32, 000 0.44 0.36 0.32 0.27 0.21 0.14 0.08 0.37 0.33 0.29 0.23 0.17 0.12 0.26
λ = 15, 000 0.58 0.43 0.37 0.29 0.22 0.14 0.07 0.46 0.40 0.33 0.25 0.18 0.12 0.29
λ = 4, 000 0.95 0.59 0.41 0.26 0.16 0.10 0.06 0.68 0.54 0.38 0.25 0.16 0.10 0.36
λ = 500 1.00 0.67 0.34 0.13 0.06 0.06 0.06 0.80 0.60 0.37 0.20 0.12 0.07 0.34
DE1_MEET 0.99 0.64 0.41 0.26 0.18 0.12 0.07 0.75 0.57 0.39 0.26 0.17 0.11 0.38
DE2_EET(λ) with
λ = 66, 000 0.30 0.28 0.27 0.25 0.20 0.14 0.08 0.28 0.27 0.25 0.21 0.16 0.11 0.22
λ = 32, 000 0.42 0.37 0.33 0.28 0.21 0.13 0.06 0.38 0.34 0.29 0.23 0.17 0.11 0.25
λ = 15,000 0.68 0.47 0.38 0.28 0.18 0.11 0.06 0.51 0.43 0.33 0.24 0.16 0.10 0.30
λ = 4, 000 0.99 0.61 0.34 0.17 0.10 0.07 0.05 0.74 0.55 0.35 0.21 0.13 0.08 0.34
λ = 500 1.00 0.66 0.33 0.13 0.06 0.06 0.06 0.80 0.59 0.36 0.19 0.11 0.07 0.34
DE2_MEET 0.99 0.62 0.41 0.26 0.17 0.11 0.06 0.74 0.56 0.38 0.25 0.17 0.11 0.37
PE_EET(k) with
k = 50%population 0.48 0.42 0.37 0.31 0.22 0.13 0.07 0.43 0.38 0.33 0.25 0.18 0.11 0.28
k = 25%population 0.72 0.57 0.47 0.33 0.20 0.10 0.05 0.60 0.52 0.41 0.28 0.18 0.11 0.35
k = 10%population 0.96 0.75 0.53 0.27 0.11 0.06 0.05 0.81 0.66 0.47 0.28 0.15 0.09 0.40
k = 5%population 0.99 0.75 0.45 0.17 0.06 0.06 0.06 0.84 0.67 0.43 0.23 0.13 0.07 0.38
PE_MEET 0.98 0.73 0.51 0.31 0.17 0.10 0.06 0.81 0.65 0.46 0.29 0.18 0.11 0.41
NN_EET(s) with
s = 0.1 0.72 0.52 0.42 0.32 0.22 0.13 0.07 0.56 0.48 0.38 0.28 0.19 0.12 0.34
s = 0.5 0.93 0.64 0.47 0.31 0.18 0.11 0.06 0.71 0.59 0.43 0.29 0.18 0.11 0.39
s = 1 0.99 0.70 0.46 0.25 0.13 0.08 0.06 0.79 0.64 0.44 0.27 0.16 0.09 0.39
s = 2 1.00 0.70 0.40 0.17 0.08 0.06 0.06 0.82 0.63 0.41 0.23 0.13 0.08 0.36
s = 8 1.00 0.66 0.33 0.13 0.06 0.06 0.06 0.80 0.59 0.36 0.19 0.11 0.07 0.34
NN_MEET 0.99 0.68 0.45 0.27 0.16 0.10 0.07 0.79 0.62 0.42 0.27 0.17 0.10 0.39
D_EET(s) with
s = 0.1 0.91 0.57 0.41 0.28 0.19 0.13 0.07 0.65 0.52 0.39 0.27 0.19 0.11 0.36
s = 0.5 0.99 0.68 0.44 0.25 0.15 0.10 0.06 0.78 0.62 0.43 0.28 0.17 0.10 0.37
s = 1 1.00 0.69 0.39 0.18 0.09 0.07 0.06 0.81 0.62 0.41 0.23 0.14 0.08 0.38
s = 2 1.00 0.67 0.34 0.13 0.06 0.06 0.06 0.80 0.60 0.37 0.20 0.12 0.07 0.34
s = 8 1.00 0.66 0.33 0.13 0.06 0.06 0.06 0.80 0.59 0.36 0.19 0.11 0.07 0.34
D_MEET 0.99 0.67 0.42 0.24 0.15 0.10 0.07 0.78 0.61 0.41 0.26 0.16 0.10 0.38
wij =exp{−dij} λ
wij =exp{ (−4 dij) }2 λ
wij dij
i =exp{ (−4 ) }2
λ
w l
ij s = 1
w
l d
d H
ij
ij
i s =
+ ∗
( 1 )
Publish with BioMed Central and every scientist can read your work free of charge "BioMed Central will be the most significant development for disseminating the results of biomedical researc h in our lifetime."
Sir Paul Nurse, Cancer Research UK
Your research papers will be:
available free of charge to the entire biomedical community
peer reviewed and published immediately upon acceptance
cited in PubMed and archived on PubMed Central
yours — you keep the copyright
Submit your manuscript here:
http://www.biomedcentral.com/info/publishing_adv.asp
BioMedcentral
different alternative clustering models. The type of power evaluations done in this paper are, in spite of these limita-tions, very important. For practical applicalimita-tions, the power estimates presented in this paper provides some help when we choose a test.
Conclusion
The power of Tango's MEET varies greatly with different choice of weight. In general, with reasonable parametric distance based weights, the power of Tango's MEET is robust. Tango's original choice for the weight function works well. At the same time, there are also other weight functions for which the test has good power.
List of abbreviations
EET: Excess Events Test.
MEET: Maximized Excess Events Test.
Authors' contributions
CH and MK jointly designed the study and chose the methods for evaluation. CH programmed the S-Plus code, carried out the power calculations and wrote the first draft of the manuscript. Both authors interpreted the results and wrote the final version of the paper.
Acknowledgements
This study was funded by grant RO1CA095979-01 from the National Can-cer Institute.
References
1. Fotheringham AS, Charlton M, Brunsdon C: The geography of parameter space: an investigation of spatial non-stationarity. International Journal of Geographical Information Systems 1996, 10:605-627.
2. Gatrell A, Bailey T, Diggle P, Rowlingson B: Spatial point pattern analysis and its application in geographical epidemiology. Transactions of the Institute of British Geographers 1996, 21:256-274. 3. Ruiz-Garcia M: Genetic relationships among some new cat
populations sampled in Europe: A spatial autocorrelation analysis. Journal of Genetics 1997, 76:1-24.
4. Aubry P, Piegay H: Spatial autocorrelation analysis in geomor-phology: Definitions and tests. Geographic Phisique et Quaternaire 2001, 55:111-129.
5. Clark SA, Richardson BJ: Spatial analysis of genetic variation as a rapid assessment tool in the conservation management of narrow-range endemics. Invertebrate Systematics 2002, 16:583-587.
6. Liebhold AM, Gurevitch J: Integrating the statistical analysis of spatial data in ecology. Ecography 2002, 25:553-557.
7. Gustine DL, Elwinger GF: Spatiotemporal genetic structure within white clover populations in grazed swards. Crop Science 2003, 43:337-344.
8. Meirmans PG, Vlot EC, Den Nijs JCM, Menken SBJ: Spatial ecolog-ical and genetic structure of a mixed population of sexual diploid and apomictic triploid dandelions. Journal of Evolutionary Biology 2003, 16:343-352.
9. Tango T: A test for spatial disease clustering adjusted for mul-tiple testing. Statistics in Medicine 2000, 19:191-204.
10. Cuzick J, Edwards R: Spatial clustering for inhomogeneous pop-ulations. Journal of the Royal Statistical Society 1990, B52:73-104. 11. Moran PAP: Notes on continuous stochastic phenomena.
Biometrika 1950, 37:17-23.
12. Song C, Kulldorff M: Power evaluation of disease clustering tests. International Journal of Health Geographies 2003, 2(1):9.
13. Kulldorff M, Tango T, Park P: Power comparisons for disease clustering tests. Computational Statistics and Data Analysis 2003, 42:665-684.
14. Besag J, Newell J: The detection of clusters in rare diseases. Journal of the Royal Statistical Society 1991, A154:143-155.
15. Bonetti M, Pagano M: On detecting clustering. Proceedings of the Biometrics Section American Statistical Association 2001:24-33. 16. Swartz JB: An entropy-based algorithm for detecting clusters
of cases and controls and its comparison with a method using nearest neighbors. Health and Place 1998, 4:67-77.
17. Whittemore AS, Friend N, Brown BW, Holly EA: A test to detect clusters of disease. Biometrika 1987, 74:631-635.
18. Tango T: A class of tests for detecting 'general' and 'focused' clustering of rare diseases. Statistics in Medicine 1995, 14:2323-2334.
19. Gangnon RE, Clayton MK: A weighted average likelihood ratio test for spatial clustering of disease. Statistics in Medicine 2001, 20:2977-2987.
20. Dwass P: Modified randomization tests for nonparametric hypotheses. Annals of Mathematical Statistics 1957, 28:181-187. 21. Tango T: Adjusting Moran's I for population density by N.
Oden, Statistics in Medicine, 14, 17–26 (1995). Statistics in Med-icine 1998, 17:1055-1058.
22. Oden N: Adjusting Moran's I for population density. Statistics in Medicine 1995, 14:17-26.