R E S E A R C H
Open Access
Integration of evolutionary computation
algorithms and new AUTO-TLBO technique
in the speaker clustering stage for speaker
diarization of broadcast news
Karim Dabbabi
1*, Salah Hajji
2and Adnen Cherif
1Abstract
The task of speaker diarization is to answer the question "who spoke when?" In this paper, we present different clustering approaches which consist of Evolutionary Computation Algorithms (ECAs) such as Genetic Algorithm (GA), Particle Swarm Optimization (PSO) algorithm, and Differential Evolution (DE) algorithm as well as Teaching-Learning-Based Optimization (TLBO) technique as a new optimization technique at the aim to optimize the number of clusters in the speaker clustering stage which remains a challenging problem. Clustering validity indexes, such as Within-Class Distance (WCD) index, Davies and Bouldin (DB) index, and Contemporary Document (CD) index, is also used in order to make a correction for each possible grouping of speakers' segments. The proposed algorithms are evaluated on News Broadcast database (NDTV), and their performance comparisons are made between each another as well as with some well-known clustering algorithms. Results show the superiority of the new AUTO-TLBO technique in terms of comparative results obtained on NDTV, RT-04F, and ESTER datasets of News Broadcast.
Keywords: Speaker diarization, PSO algorithm, GA algorithm, DE algorithm, TLBO technique, EA algorithms, Clustering validity index, DER
1 Introduction
Nowadays, the fast progress in multimedia sources make the use of archived audio documents an increasing need for efficient and effective means of searching and index-ing through voluminous databases. In order to facilitate the access to the recording in audio databases, searching and tagging based on who is speaking can be at the top of many basic components required for dealing with audio archives, such as recorded meetings or an audio portion of News Broadcast shows.
The old approaches in speaker recognition are devel-oped for speakers’ identification and verification in a
speech sample pronounced by one person. However, the basic recognition approach has to be extended to in-clude both speaker detection and tracking in multi-speaker audio. In this work, we highlight the multi-speakers’ indexation and research in audio broadcast news (NDTV) for speaker diarization task. Indeed, speaker diarization is one of the speaker-based processing tech-niques in which the feature representation of the acous-tic signal aims to represent the speaker information and discriminate between different talkers. It has been intro-duced in the NIST project of Rich Transcription in“who spoke when” evaluations [1]. According to the first def-inition in 1999 NIST Speaker Recognition evaluation, the identification of audio regions based on a given speaker is a tracking speaker task [2]. Concerning the speaker detection task in audio data, it is performed by diarization and tracking procedures and it has an
* Correspondence:[email protected]
1Research Unity of Analysis and Processing of Electrical and Energetic
systems, Faculty of Sciences of Tunis, University of Tunis El Manar, 2092 Tunis, Tunisia
Full list of author information is available at the end of the article
objective to make speaker-based indexation according to the detected speaker and ensure good retrieve of speaker-based information in audio recording. For the speaker diarization task, it aims to structure audio docu-ments into speaker turns and give their true identities so that we can make an automatic transcription.
In the speaker diarization task, there is any prior knowledge about the speakers and their number. It consists of two main phases: the first one is a seg-mentation phase in which the speech is segmented into many smaller segments at the detected change points in a recording. Ideally, each small segment contains speech from just one speaker. The second phase is a clustering phase, which makes the cluster-ing of the neighborcluster-ing segments uttered by the same speaker. Currently, a bottom-up approach known as Hierarchical Agglomerative Clustering (HAC) is the most popular method for clustering [3]. Speaker diari-zation has been applied in several speech areas [4]. The transcription of telephone and broadcast meet-ings, auxiliary video segmentation, and dominant speaker detection represent its main applications. The alleviation of the amount of speech document man-agement tasks can be performed by such an effective tool like speaker clustering [5, 6]. This latter can group and attribute similar audio utterances to the same speaker in audio document by some distance measures and clustering schemes in an unsupervised condition [7]. In previous years, spectral clustering has been proved have better effect than hierarchical clustering in speaker clustering [8, 9]. This is due to greedy research for hierarchical clustering, which has high computation complexity and produces a subopti-mal solution. In contrast, spectral clustering has rela-tive lower computation complexity and can produce a global solution.
Searching for suitable model which can represent short segments and enable a similarity and difference measure between neighboring segments for clustering represent an open search topic. Previous approaches have been used to model each segment with a single GMM model or I-vectors extracted from a Universal Background Model (UBM) like it has been described in [10]. Indeed, a Gaussian Mixture Model (GMM) adapted from the UBM which has been used to form an I-vector represents the state-of-the-art systems to rep-resent segments. Generally, good results have been re-ported using UBM/I-vector. In [11], deep neural network (DNN) has been trained to construct UBM and T-matrix in order to make the extracted I-vectors better models of the underlying speech. This method has shown capability to construct accurate models of speech, even for short segments. This system has also achieved a significant improvement on the NIST 2008
speaker recognition evaluation (SRE) telephone task data compared to state-of-the-art approaches. In this work, we have tried to optimize the clustering of the extracted I-vectors using evolutionary algorithms (EAs), and teaching-learning-based optimization (TLBO) technique.
Speaker clustering based on feature vector distance employs the distance of samples to measure the similar-ity of two speech segments. Thus, a two-step clustering based on Cross Likelihood Ratio (CLR) has been used by some researchers at the aim to measure the similarity between segments [10]. This approach has been shown its effectiveness to resolve the problem of a single Gaussian model describing the complex distribution of the features. Also, in [12], Rand index has shown good efficiency by reducing the overall clustering errors when it has been used to measure the similarity between utter-ances. During the agglomeration procedure, Bayesian In-formation Criteria (BIC) can only make each individual cluster as homogenous as possible, but it cannot guaran-tee that the homogeneity for all clusters can finally be summed to reach a maximum [12]. In this work, we have used EAs at the aim to optimize the generated clusters and the required number of clusters by estimat-ing and minimizestimat-ing the clusterestimat-ing validity indexes (cri-teria). These metrics reflect the clustering errors that arise when utterances from the same speaker are clus-tered in different clusters or when utterances from dif-ferent speakers are clustered in the same cluster. We approximate the clustering validity index by a function of similarity measures between utterances and then use the EAs to determinate the cluster in which each utter-ance should be located, such that function is minimized.
evolution strategies (ES), and differential evolution (DE) algorithm. A common concept based on simulating the evolution of the individuals that form the population using a predefined set of operators is a shared concept by all these algorithms. Therefore, the selection and search oper-ators are the two kinds of operoper-ators commonly used. For the mutation and recombination, they constitute the most widely used search operators. To determine the optimal number of clusters, the within-class distance (WCD), Da-vies and Bouldin (DB), and contemporary document (CD) clustering validity indexes have been used in this work at the aim to provide global minima/maxima at the exact number of classes in the dataset. Thus, the quantitative evolution with global clustering validity index permits a correction of each possible grouping. For the evolution process, it starts by the domination of the best solutions in the population and the elim-ination of the bad ones. After that, the evolution of solutions converges when the near optimal partition-ing of the dataset is represented by the fittest solution with the respect of the employed clustering validity index. By this way, in only one run of the evolution-ary optimization algorithm, the optimal number of classes along with the accuracy cluster center coordi-nates can be located. In fact, the performance of the evolutionary optimization algorithm relies sharply on the selection of the clustering validity index.
For the GA, it has been first applied in 1975 by Hol-land [13] and it is well known in many application fields as a new tool for complex systems optimization. Its main feature is represented by its capability to avoid local minima. Also, the GA is an unsupervised optimization method which can be used freely without any constraint to find the best solution. Therefore, it is the most popu-lar EA and it is well known for resolving hard optimization problems. The GAs have shown their best performance in many application areas, such as pattern recognition, image processing, and machine learning [14]. Comparing GAs to EP and ES techniques, these latter techniques have performed better than GAs for real-valued function optimization. In the speaker diariza-tion research area, there are some works recorded using GA, such as that one in [15] where the GA has been ex-plored to design filter bank in feature extraction method destined for speaker diarization application. Also, in [16], the feature dimension reduction has been made through GAs in the objective to speed up speaker recognition task. In this work, we have used both GA binary and real-coded representations beside different variation of the major control parameters like selec-tion, crossover, and different distance measures of the fitness function using WCD, DB, and CD clustering validity indexes. These indexes have been also ex-plored by PSO and DE algorithms.
PSO, and DE algorithms have been applied and com-pared to new TLBO optimization technique, which has been used for automatic clustering of large un-labeled dataset. Indeed, the TLBO technique does not need any prior information about the data to be classified, and it can find the optimal number of data partitions in some iterations. Therefore, this algo-rithm can be defined as a population-based iterative learning and it possesses more common characteris-tics than other EC algorithms. Indeed, this technique has shown more improvement in convergence time for solving an optimization problem in real-world real-time applications compared to GA, PSO, DE, and artificial bee colony (ABC) algorithms. In [30], an investigation has been performed about the effect of the introduction of the elitist concept in TLBO al-gorithm on the performance. In addition, another in-vestigation about the common controlling parameters (population size and the number of generations) and their effects on the performance of the algorithm has been performed too. Moreover, the TLBO technique has been used in [31] in order to optimize four truss structures. In [32], the introduction of the concepts of number of teachers, adaptive teaching factor, tu-torial training, and self-motivated learning has been proposed at the aim to improve the performance of the TLBO algorithm. In [33], the θ-multi-objective TLBO algorithm has been presented in the purpose of resolving the dynamic economic emission dispatch problem. Therefore, for the purpose of global optimization problems, a dynamic group strategy has been suggested in [34] in order to improve the per-formance of the TLBO algorithm too. In addition, the ability of the population has been explored in the original TLBO technique by introducing a ring neighborhood topology [35]. In [36], it has been con-sidered that TLBO technique is one of the simplest and most efficient techniques, as it has been empiric-ally shown to perform well on many optimization problems. From our knowledge, there is any work re-corded in speaker diarization research area using TLBO algorithm. More details about the basis TLBO concept can be found in [37].
The remained sections of this paper are organized as follows: In Section 2, we explain the different components of our proposed model. Concerning the next section, we discuss the experimental results. In Section 4, we conclude our paper with fewer discussions.
2 Overview of the methodology
Our model consists of many phases, and a detailed description of each phase is given in the following sub-sections.
2.1 Feature extraction (MFCCs)
Only the first 19 Mel Frequency Cepstral Coefficient (MFCC) features have been used in the Speech Activity Detector (SAD) module, speaker segmentation module, and speaker clustering module. Beside these features, the short-time energy (STE) and the zero-crossing ratio (ZCR) plus the first- and second-order derivatives of MFCCs have been employed in the SAD module. Also, for the speaker segmentation, only 19 MFCCs and short-time energy (STE) have been used, whereas in the speaker clustering stage, the first- and second-order derivatives of MFCCs have been added. The frame sizes for the analysis windows were set to 30 ms with 20 ms frame overlap. For the sampling frequency, it was set to 16 KHz.
2.2 SAD
This subsystem was used for both silence and music re-moval modules. For the silence rere-moval module, the si-lence was suppressed from the whole audio recording using energy-based bootstrapping algorithm followed by an iterative classification. After the removal silence, the identification of music and other audible no-speech sounds from the recording have been performed using music vs. speech bootstrap discriminator, which con-sists to train music model from frames, which are identified as music and have high confidence level. Thus, the music model is refined iteratively. For both silence and music removal modules, in order to avoid the sporadic no-speech to speech transitions, only the segments with more than 1 s duration has been con-sidered as no-speech.
2.2.1 Silence removal
speech and silence GMMs till the maximum. The Gaussian Mixtures Model (GMM) with 32 components for the speech and 16 components for no-speech have been given the best results for silence and pauses removal. Also, the high-energy no-speech named the audible no-speech, such as music and jingles, have been classified as speech because the MFCCs and frames energy for music are more similar to speech more than silence.
2.2.2 Music removal
The frames which have high confidence level from the histogram of ZCR for music and from the histogram of energy for the speech are used to train both music and speech models in order to estimate their initial models. Thus, only 40% of the highest zero-crossing rate frames from the ZCR histograms are used as high-confidence music frames and train the music model. After that, a refinement of speech and music classes has been per-formed in order to discard only music segments in the iterative classification. Thus, this refinement is similar to that performed in silence removal module. In this stage (music removal), 19 MFCC features and their first- and second-order derivatives concatenated with ZCR have been used. Also, the STE has not exploited within the it-erative classification process, and by its elimination, the speech with background music which has been classified as music has been changed to speech class.
2.3 Speaker segmentation
Growing window based on the delta Bayesian Infor-mation Criteria (ΔBIC) distance has been used as a speaker segmentation algorithm. It consists to make a research of a single change point in each frame of the audio recording. This research restarts from the next frame each time when a single change point is detected. In this case, the window size is initialized to 5 s, and for that frame, the distance ΔBIC is calcu-lated. Indeed, a change point is declared as maximum point if the maxima in the window exceed a thresh-old value θ. In contrast, if there is no change point is detected, then the window size is increased by 2 s and the process is repeated till a change point is de-tected. We have to remember here that we deal only with speech frames as those no-speech are discarded by the SAD module. Thus, the corresponding loca-tions of change points in the original audio found in these speech frames are declared as change points.
According to both broadcast diarization toolkits in [38, 39], speaker segmentation is performed in two phases: In the first one, a threshold value of zero is used by the ΔBIC-based change detection, and in the second one, the consecutive segments are merged when the ΔBIC score is positive. So, we can sum up these two phases in only one phase by considering maxima, which
are greater than a threshold θ. By this way, we can re-duce significantly the over segmentation engendered by the zero thresholdΔBIC-based segmentation. TheΔBIC expression is given as follows:
△BICð Þ ¼xi Nlogj jΣ−N1logj jΣ1−N2logj jΣ2−λ 2ðdþ
d
2ðdþ1ÞlogN
ð1Þ
where Σ is the covariance matrix of the merged cluster (c1andc2),Σ1of cluster c1, andΣ2of clusterc2, and N1
and N2are, respectively, the number of acoustic frames
in cluster c1andc2, λis a tunable parameter dependent
on the data.N=N1+N2denotes the size of two merged
clusters. In this speaker segmentation stage, only the 19 MFCC features have been used with their short time energies.
2.4 I-vector extraction
The success of I-vectors has been reached the language recognition [40, 41], and it is not only dedicated to speaker diarization, clustering tasks, and speaker recog-nition [42] ([2]). For the I-vector extraction, it is defined as the mapping of high-dimensional space to low-dimensional one named total variability space. The mathematic expression of mapping the super vector X
to an I-vectorxis given as follows:
X¼XUBMþTx ð2Þ
where XUBM denotes the Universal Background Model
(UBM) and T is the rectangular matrix called total variabil-ity matrix. In this work, UBM is a diagonal covariance GMM of size 512, and it is one-time computation. Indeed, obtaining GMM for a segment is done by mean adapting the UBM for the feature vectors of the concerned segment.
2.4.1 WCCN
2.5 Speaker clustering
2.5.1 EAs
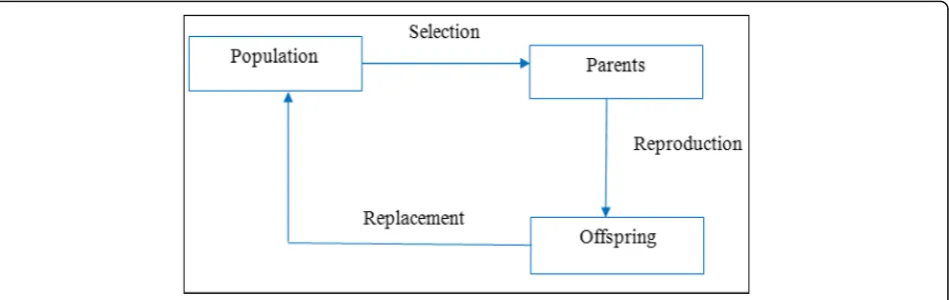
Under EAs, we can find evolution strategies, pro-gramming strategies, genetic propro-gramming, and evolu-tionary programming. All of these algorithms share a common structure based on simulating the evolution of individual structures through the process of selec-tion, mutaselec-tion, and reproduction. This process relies on the perceived performance of the individual struc-tures as defined by the problem. The EAs start at first by initializing the population of candidate solu-tions, and then, new populations are created by ap-plying reproduction operators (mutation and/or crossover). After that, the fitness evaluation of the resulting solutions is performed and the suitable se-lection strategy is applied in order to determine which are the solutions that will be maintained into the next solution. The iteration of the EAs process is performed as it is illustrated in the Fig. 1.
The algorithm of the EAs is given as follows:
2.5.2 DE algorithm
This algorithm uses non-linear and non-differentiable functions for optimization problems [44]. Indeed, differ-ential evolution (DE) algorithm looks to optimize these functions from a set of randomly generated solutions using specific operators of recombination, selection, and replacement. The different steps of the DE algorithm are given below.
Concerning the PSO algorithm, more details about it can be found in [45].
2.5.3 TLBO algorithm
The TLBO method is one of the population-based methods, which relies on population of solutions to
reach the global one (solution). It has been used for clustering tasks [46]. The main idea behind this optimization method is to profit from the influence of a teacher on the learners’output in a class [47]. For this, in this algorithm, the population is considered as a group of learners. Concerning the optimization algo-rithms, the population is composed of different design variables, while for the TLBO approach, different design variables are similar to different subjects that are sug-gested to learners. Thus, concerning the learners’result here, it is similar to the “fitness” like in other population-based optimization techniques. In TLBO al-gorithm, the best solution obtained so far is considered to be given by the teacher.
The TLBO technique consists of two phases: the first one is the “teacher phase” and the second one is the
“learner phase.” Concerning the teacher phase, it con-sists to make learning from the teacher, and concerning the learner phase, the learning is made via the inter-action between learners.
2.5.3.1 Teacher phaseThe main idea behind this phase is to consider a teacher as the knowledgeable person in the society who transfers his knowledge among learners, which can contribute to increase the knowledge level of the entire class and allows learners to get good marks or grades. So, the mean of the class is increased by the teacher’s capability, i.e., moving the mean M1 towards the teacher’s level is performed according to the capabil-ity of the teacher T1, which enables to increase the learner’s level into a new mean M2. Also, the student’s knowledge is increased according to his quality in the class and to the teaching quality given by the teacher T1. Changing the student’s quality from M1 to M2 is re-lied on the effort of the teacher T1. Consequently, the student at the new level needs a new teacher T2 who has more quality than him [45].
Let us considerMithe mean andTithe teacher at any
iteration. Trying to move Mi by the teacher Ti towards
its own level engenders consequently the creation ofMnew, which is a design of the new meanTi. The
solu-tion update is performed according to the difference be-tween the existing and new mean, and it is given by the following expression:
Differencemeani ¼riðMnew−TFMiÞ ð3Þ
whereTFis the teaching factor which is responsible for
taking the decision about the mean value to change, and ri is the random number in the range [0 1]. Also,
the value of TFcan be either 1 or 2, which is again a
heuristic step or it is decided randomly with equal probability as:
TF ¼round 1½ þ rand 0ð ;1Þ ð2−1Þ ð4Þ
This subtraction modifies the existing solution, and it depends on the following expression:
Xnew;i¼Xold;iþDifferencemeani ð5Þ
2.5.3.2 Learner phase Increasing the learners’ know-ledge is performed from the teacher through an input and via the interaction between learners themselves. Each learner has a randomization interaction with other learners with the assistance of group discussions, presen-tations, formal communication, and others. Each time that the learner’s knowledge is less than the knowledge of another one, then the learner will learn something new [45]. Thus, the modification in the learner is given by the following algorithm:
2.6 Statistical clustering criteria
The measure of the partition’s adequacy is performed by different statistical criteria, which allow a comparison through different partitions. Other transformations can be usually involved by these criteria, such as the trace or determinant of both pooled-within groups scatter matrix (W) and between groups scatter matrix (B). The pooled-within scatter matrix (W) is expressed as follows:
W¼Xg
k¼1Wk ð6Þ
where Wk denotes the variance matrix of the objects’
features allocated to cluster Ck(k= 1,…,g). Therefore, if
Xlð Þk designs thelth object in clusterCkandnk, the
Wk ¼ Xnk
l¼1
nk xð Þlk−x k
ð Þ
xð Þlk−xð Þk
′
ð7Þ
Where, xð Þk ¼ Pnk l¼1xlð Þk
=nk is the vector of the cen-troids for clusterCk[48]. In this work, we have used the
trace of the pooled-within groups scatter matrix (W) as a distance measure of the fitness function and it is de-noted by WCD. Also, the computation of the fitness function has been carried out according to distance measures using DB and CS indexes as clustering validity index.
2.6.1 DB index
The minimization of the average similarity between each cluster and the one most similar to it is performed by this clustering validity index, which is defined as [49]:
DB¼ 1
K
XK
k¼1max
diamð Þ þCk diamðCkkÞ
distðCk;CkkÞ
ð8Þ
withkk= 1 ,…,Kandk≠kk.
Where, diam denotes the perfect diameter which is de-fined as the inter-cluster and intra-cluster distance ofCk
andCkkclusters.
2.6.2 CS index
The Constructability Score (CS) Index measures the par-ticle’s fitness, and it is defined such as [50]:
CSð Þ ¼K 1 T
P
i¼1
T 1
Ni P
xj∈Ci xk∈Cimax dðxj;xk
n o
1 T
P
i−1
T min dðZi;Zj
j∈T;j≠i ¼ P i−1 T 1 Ni P
xj∈Ci xk∈Cimax dðxj;xk
n o
P iT¼1
mindðZi;Zj j∈T;j≠i
ð9Þ
Zi¼ 1 Ni
X
xj∈Ci
xj;i¼1;2;…T; d xj ;xk
¼
ffiffiffiffiffiffiffiffiffiffiffiffiffiffiffiffiffiffiffiffiffiffiffiffiffiffiffiffi XNd
p¼1
xjp−xkp
2
v u u
t ð10Þ
WhereZidenotes the cluster center ofCi, Cidesigns the
set whose elements are the data points attributed to the
ith cluster, Ni the number of elements in Ci, andd
de-signs a distance function.
The CS measure is also a function of the ratio of the sum of within-cluster scatter between-cluster separ-ation [45]. In order to reach proper clustering results for the PSO algorithm, this measure (CS measure) has to be minimized. Consequently, the computation of the fitness function for each individual particle is expressed as follows:
F¼ 1
CSiþeps ð
11Þ
where CSi is the CS measure computed for theith
par-ticle, and eps is a very small-valued constant.
3 Experiments and analysis 3.1 Evaluation criteria
The evaluation of speaker diarization is an optimal measure obtained by mapping one-to-one of the ref-erence speakers’ identities (IDs) and the hypothesis ones. The first metric for this task is concerned with the speaker match error, which corresponds to the fraction of speaker’s time, which is attributed incor-rectly to the correct speaker, obtaining consequently the optimum speaker mapping. The second metric is the overall speaker diarization error rate (DER), which involves the missed and false alarm speaker times. This metric is defined in absence of overlap-ping such as:
DER¼E1þE2þE3 ð12Þ
whereE1¼missed speech timeS 100, E2¼false alarm speech timeS 100, and E3¼incorectelly labelled speech timeS 100
Where, s is the total speech time. For E3, it is engen-dered by errors in both speaker segmentation and clus-tering stages, and it is often named speaker error (SPK_ERR). The illustration of these measures is given in Fig. 2.
The performance analysis of the speaker clustering methods involves also the average frame-level cluster purity as well as the cluster coverage [51]. For the speaker purity performance, it is calculated as the number of frames by the dominant speaker in a ter divided by the total number of frames in the clus-ter. Concerning the cluster coverage, it takes into consideration the dispersion of a given speaker data across clusters and it is given by the percentage of speaker’s frames in cluster, which contain most of the speaker data [52]. The purity of a cluster pi is given
as follows:
pi¼X Ns
j¼1
n2 ij
n2
i
ð13Þ
where nij is the total number of frames in cluster i
spoken by speaker j,ni is the total number of frames in
cluster i, and Ns is the total number of speakers. The
acp¼ 1
N XNc
i¼1
pi:ni ð14Þ
Where N is the total number of frames for the speaker purity pjand for the average speaker purity (asp), which
are respectively defined as:
pj¼ XNc
i¼1
n2 ij
n2
j
ð15Þ
and
asp¼ 1
N XNs
j¼1pj:nj ð16Þ
Where nj is the total number of frames spoken by
speakerjandNcis the total number of clusters.
We can mention here that good measure limitation of a speaker to belong to only one cluster is given by asp and good measure limitation of a cluster to be assigned to only one speaker is given by acp [52]. So, we have used an overall evaluation criterion which is the square of the product of these two factors such as:
K¼pffiffiffiffiffiffiffiffiffiffiffiffiffiffiffiffiffiffiffiffiaspacp ð17Þ
It is important to mention that the DER values ob-tained in all experiments of this work are the overall dia-rization error rates which can be calculate as the averages of the individual DER per episode multiplied by the duration of the episode.
Also, the segments obtained after segmentation should contain a single speaker and give the correct speaker
Fig. 2Example of performance measures for speaker diarization task used in the NIST RT-04F evaluations
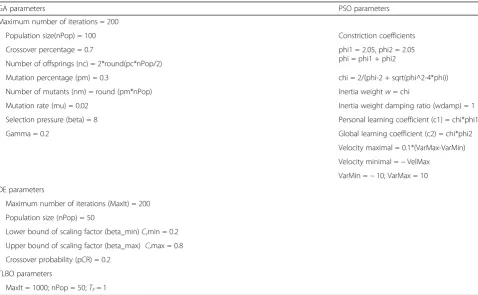
Table 1The best parameters setting given the best cost solution for all proposed algorithms
GA parameters PSO parameters
Maximum number of iterations = 200
Population size(nPop) = 100 Constriction coefficients
Crossover percentage = 0.7 phi1 = 2.05, phi2 = 2.05
phi = phi1 + phi2 Number of offsprings (nc) = 2*round(pc*nPop/2)
Mutation percentage (pm) = 0.3 chi = 2/(phi-2 + sqrt(phi^2-4*phi))
Number of mutants (nm) = round (pm*nPop) Inertia weightw= chi
Mutation rate (mu) = 0.02 Inertia weight damping ratio (wdamp) = 1
Selection pressure (beta) = 8 Personal learning coefficient (c1) = chi*phi1
Gamma = 0.2 Global learning coefficient (c2) = chi*phi2
Velocity maximal = 0.1*(VarMax-VarMin)
Velocity minimal =−VelMax
VarMin =−10; VarMax = 10
DE parameters
Maximum number of iterations (MaxIt) = 200
Population size (nPop) = 50
Lower bound of scaling factor (beta_min)Crmin = 0.2
Upper bound of scaling factor (beta_max) Crmax = 0.8
Crossover probability (pCR) = 0.2
TLBO parameters
turns at their boundaries. In fact, there are many kind of errors attached to speaker turns detection which can be recognized. In our work, we have used PRC, RCL, andF
as assessment measures. For the first two, they are de-fined as:
RCL¼ number of correctly found turns
total number of correct turns ð18Þ
PRC¼ number of correctly found turns
total number of turns found ð19Þ
In the purpose of evaluation of the segmentation qual-ity, F has been used as a measure combination of RCL and PRC of change detection. Thus,Fis defined such as:
F¼2RCLPRC
RCLþPRC ð20Þ
3.2 NDTV evaluation corpus
The experiments presented below for speaker diarization have been developed on MATLAB and have been tested on the News database (NDTV). The development data-base (NDTV) contains 22 episodes of the Hindu news Headlines Now Show from the NDTV news channel. It includes English new reading of a length of 4 h and 15 min with Indian accent, and it was manually annotat-ing. The dominant speaker in the episodes is the anchor as he takes more much time talking than other speakers. Also, across all episodes, the anchors differentiate to each another. The announcement of the headlines is ac-companied with music in the background, which is a common point in all episodes. In addition, the speaker in a single episode is labeled by its genre, background environment (clean, noise, or music), and identity (ID). Therefore, the silence segment length varies from 1 to 5 s, and there is no advertisement jingles presented in the dataset. For the silence, noise, speaker’s pauses, or music, they are labeled as no-speech, which represents 7% of the total recording. Thus, the annotation of the speaker overlap has been performed with the most dom-inant speaker in the overlap.
3.3 Implementation and parameter setting
The parameter setting, which has given the best cost so-lution for all implemented algorithms, is given in Table 1.
3.4 Results
The Speech Activity Detector (SAD) has been imple-mented by cascading the silence removal module to the music removal module. This implementation has been shown an improvement in both missed speech ratio (MSR) and false alarm speech ratio (FASR) comparing to the implementation of each module alone. Indeed, the implementation of the silence removal module alone or the music removal module alone engenders high false alarm rate. The results obtained for both cases are sum-marized in Table 2.
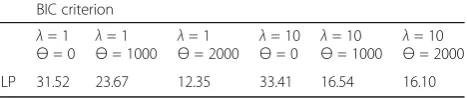
Beside the evolutionary and TLBO algorithms, our model has been tested with the well competitive algo-rithm in speaker diarization, which is the Integrated Lin-ear Programming (ILP) algorithm. Table 3 exhibits the different DER values obtained with ILP algorithm for different Bayesian Information Criteria (BIC) parame-ters. Here, the best DER values have been reached with highλ and θvalues. In contrast, the low values of these parameters have led to high DER values. Thus, the latter parameter setting engenders an over segmentation, which due to the increase of the average duration of seg-ments, which is caused by increasing theθvalue.
Also, our model has been tested with hierarchical ag-glomerative clustering (HAC) and ILP algorithms using GMM and I-vectors as speaker models. The best results in this test have been obtained with ILP-I-vector cluster-ing as it is mentioned in Table 4. This proves the super-iority of ILP clustering compared to HAC method.
Therefore, our model has been tested using different evolutionary algorithms (EAs) with specificity for GA al-gorithm for which we have made different variation in its control parameters such as the selection and cross-over, as well as the clustering validity index. The
Table 2SAD results obtained using: silence removal module alone, music removal module alone, and by cascading both modules
Error MSR FASR Total
SAD method
Silence removal 1.37 3.31 4.68
Music removal 1.42 5.62 7.04
Cascade 2.79 8.93 11.72
Table 3DER results obtained using ILP clustering algorithm
BIC criterion
λ= 1
ϴ= 0 λ = 1
ϴ= 1000 λ = 1
ϴ= 2000 λ = 10
ϴ= 0 λ = 10
ϴ= 1000 λ = 10
ϴ= 2000 ILP 31.52 23.67 12.35 33.41 16.54 16.10
Table 4Best DER result obtained for both speaker models and clustering algorithms
Clustering algorithm
Speaker model HAC ILP
GMM 19.45 17.15
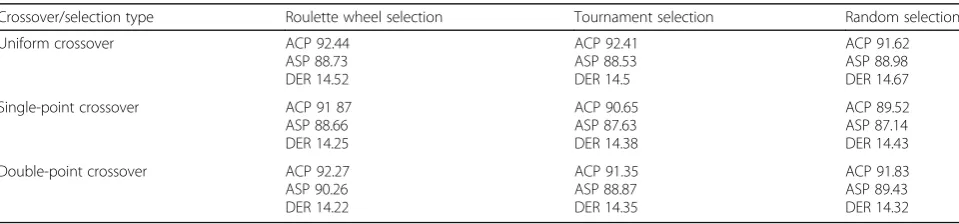
computational cost in this section is given by the object-ive function, which has reached the best cost solution. From Tables 5 and 6, we can mention that the CD index is the best clustering validity index, which has reached the best results for GA algorithm in terms of ACP, ASP, and DER comparing to those obtained with DB and WCD indexes. This is due to the best cost solution reached by this index comparing to other ones. In addition, the GA algorithm with CD index has exceeded in the achieved results of both GA-based binary repre-sentation and GA-based real-coded reprerepre-sentation using
“sphere” as a cost function. From Table 6, we can also show that thesingle-point crossoverand the double-point crossoverare the bestcrossovermodes, which have led to good results for GA algorithm using WCD index. For the selection, in some cases, the Roulette wheel selection
seems the best kind of selection, and in other ones, the
tournament selectionis the best one.
Also, the DE algorithm is the best EAs in terms of DER, ACP, and ASP results in which it contributes to obtain the lowest values, and this is in virtue of the CD index. But, comparing DE algorithm to TLBO technique, the best DER, ACP, and ASP values have been obtained by the TLBO technique as it is mentioned in Table 7.
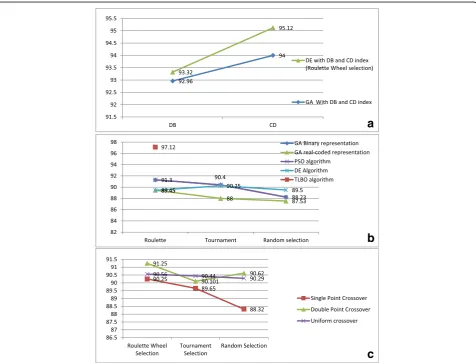
From the Fig. 3b, we can show the domination of the TLBO algorithm compared to other algorithms in terms of indexing results (K) in which it has reached the best value (97.12%). In addition, for the same evaluation, the CD index is better than DB index using both GA and
DE algorithms (Fig. 3a) and its best result has been achieved with DE algorithm (95.12%). Therefore, for dif-ferent selection and crossover combinations using GA algorithm, the Roulette wheel selection used with double-point crossover is the best combination, which has succeed to reach the best indexing results (K) (91.25%) (Fig. 3c). Also, we have to mention here that the different indexing results (K) have been obtained with different WAV files, which contain a number of speakers ranged between three and five speakers.
Concerning the segmentation results (F), our system has been evaluated using GA algorithm with DB index, DE algorithm with CD index, PSO algorithm, and TLBO algorithm. This evaluation has been performed on WAV files, which contain between three and five speakers. As it is shown in Table 8, the TLBO algorithm remains the best in terms of segmentation results compared to other algorithms. Indeed, it has reached the best average seg-mentation scores (F) with the WAV files, which contain either three or five speakers (98.45 and 97.84, respect-ively). Also, we can see clearly here that increasing the number of speakers in the audio files decreasing conse-quently the segmentation results. In fact, the record in terms of best results reached by the TLBO algorithm has been achieved in virtue of SAD which has contributed sharply to decrease the percentage of both missed and false speech alarms.
To look for the efficiency of our proposed system, we have tested it on two datasets of News Broadcast shows,
Table 5DER results for GA algorithm obtained using DB and CD clustering validity indexes, with different selection, and the DER results obtained with“sphere”cost function for both GA-based binary representation and GA-based real-coded representation
ACP % ASP % DER %
GA-based binary representation Random selection 93.54 98.13 14.62
Roulette wheel selection 92.72 88.14 14.8
Tournament selection 90.37 86.16 14.4
Ga-based real-coded represention Roulette wheel selection 91.32 87.63 14.3
Tournament selection 90.17 85.90 14.19
Random selection 89.35 85.75 14.35
GA with DB and CD indexes Roulette wheel selection DB index 94.36 91.60 14.19
CD index 95.17 92.85 14.12
Table 6DER results obtained for GA algorithm with WCD index, using different selection as well as different crossover modes
Crossover/selection type Roulette wheel selection Tournament selection Random selection
Uniform crossover ACP 92.44
ASP 88.73 DER 14.52
ACP 92.41 ASP 88.53 DER 14.5
ACP 91.62 ASP 88.98 DER 14.67
Single-point crossover ACP 91 87 ASP 88.66 DER 14.25
ACP 90.65 ASP 87.63 DER 14.38
ACP 89.52 ASP 87.14 DER 14.43
Double-point crossover ACP 92.27 ASP 90.26 DER 14.22
ACP 91.35 ASP 88.87 DER 14.35
which are RT-04F and ESTER datasets. We have per-formed a comparison between the best proposed algo-rithm in this work, which is the TLBO algoalgo-rithm and the multi-stage portioning system proposed in [53]. This system used BIC-based agglomerative clustering (AC)
followed by another clustering stage of GMM-based speaker identification as well as a post-processing stage. Indeed, the proposed system in [53] is composed of baseline portioning system (c-std), speaker identification system (c-sid) (with threshold δ), and agglomerative
Table 7ASP, ACP, and DER results obtained using PSO and DE algorithms with different selection modes and with different clustering validity indexes (DB and CS indexes). Also, ASP, ACP, and DER results are obtained using TLBO algorithm
ACP % ASP % DER %
PSO algorithm Roulette wheel selection 93.54 89.13 14.62
Tournament selection 92.72 88.14 14.8
Random selection 90.37 86.16 14.4
DE algorithm Roulette wheel selection 91.32 87.63 14.3
Tournament selection 91.87 88.66 14.25
Random selection 90.54 88.48 14.37
Roulette wheel selection DB index 95.35 91.35 13.87
CD index 96.88 93.40 13.72
TLBO algorithm 98.63 95.65 13.27
a
b
c
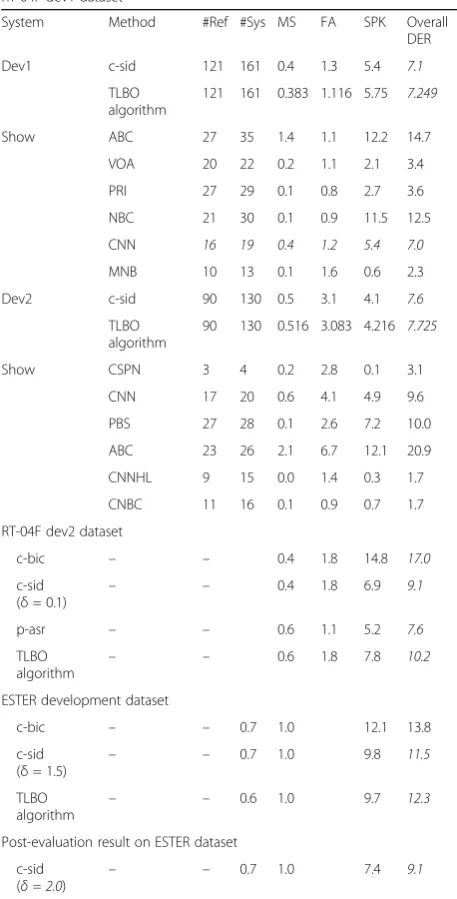
clustering system based on BIC (c-bic) as well as an automatic speech recognition system with post-processing (p-asr), which has been proposed in [54]. As it is showed in Table 9, we can say that the TLBO technique has been succeeded to reach petitive performance results on both datasets com-pared to those algorithms used in [53]. Indeed, on the dev1 dataset, the c-sid system has reached the best overall DER value (7.1%) compared to the TLBO algorithm (7.249%). Also, this system (with also p-asr system) has exceeded the TLBO algorithm on the dev2 dataset in terms of overall DER result in which it has reached the best value (7.6%). In addition, the best overall DER value (11.5%) has been achieved by c-sid system (with a threshold δ = 1.5) on the ESTER dataset against 12.3% for the TLBO algorithm. Therefore, using post-evaluation on ESTER dataset, the c-sid system (δ = 2.0) has suc-ceeded to reach good overall DER result (9.1%). We can mention from Table 9 that the speaker errors (SPK) have been increased by increasing the number of speakers in the audio files as it is clearly demon-strated by the high SPK values (12.2 and 11.5%) ob-tained with ABC and NBC audio files, respectively. Consequently, the high SPK values contribute sharply to obtain high overall DER values. Concerning the missed speech (MS) values, they are so low in all tests performed on both RT-04F and ESTER data-sets, while the false alarm (FA) values obtained on the same datasets are quiet high.
4 Conclusions
In this paper, we have used the EAs and teaching-learning-based optimization technique (TLBO) in the speaker clus-tering stage for speaker diarization of broadcast news. We have evaluated the proposed model on NDTV database which consists of different speakers. The results have dem-onstrated the high performance of the TLBO algorithm in terms of ASP, ACP, and DER results comparing to different
EAs using different clustering validity indexes (CD, WCD, and DB indexes) and to ILP algorithm. Future work may consist of more improving of the evaluated performances by making hybridization between TLBO technique and EAs with k-means algorithm (Table 10).
Table 8Segmentation results using NDTV dataset
Number of speakers
File duration F
GA PSO DE TLBO
3 10 mn 96.4 97.1 97.3 97.62
10 mn and 2 s 96.75 97.12 97.42 97.84
10 mn and 33 s 97.3 97.85 98.32 98.45
Average 96.81 97.35 97.54 97.97
5 10 mn 95.52 97.32 97.12 97.54
10 mn and 2 s 95.95 97.32 97.26 97.69
10 mn and 33 s 95.3 97.65 98.00 98.30
Average 95.59 97.26 97.46 97.84
Table 9Performance results of TLBO algorithm,c-bic,c-sid,and p-asrsystems obtained on the RT-04F and ESTER datasets. Scores are given for missed speech (MS), false alarms (FA), speaker errors (SPK), and overall diarization error rate (DER). #REF and #Sys are, respectively, thereferenceandsystemspeaker number
RT-04F dev1 dataset
System Method #Ref #Sys MS FA SPK Overall DER
Dev1 c-sid 121 161 0.4 1.3 5.4 7.1
TLBO algorithm
121 161 0.383 1.116 5.75 7.249
Show ABC 27 35 1.4 1.1 12.2 14.7
VOA 20 22 0.2 1.1 2.1 3.4
PRI 27 29 0.1 0.8 2.7 3.6
NBC 21 30 0.1 0.9 11.5 12.5
CNN 16 19 0.4 1.2 5.4 7.0
MNB 10 13 0.1 1.6 0.6 2.3
Dev2 c-sid 90 130 0.5 3.1 4.1 7.6
TLBO algorithm
90 130 0.516 3.083 4.216 7.725
Show CSPN 3 4 0.2 2.8 0.1 3.1
CNN 17 20 0.6 4.1 4.9 9.6
PBS 27 28 0.1 2.6 7.2 10.0
ABC 23 26 2.1 6.7 12.1 20.9
CNNHL 9 15 0.0 1.4 0.3 1.7
CNBC 11 16 0.1 0.9 0.7 1.7
RT-04F dev2 dataset
c-bic – – 0.4 1.8 14.8 17.0
c-sid
(δ= 0.1) – –
0.4 1.8 6.9 9.1
p-asr – – 0.6 1.1 5.2 7.6
TLBO algorithm
– – 0.6 1.8 7.8 10.2
ESTER development dataset
c-bic – – 0.7 1.0 12.1 13.8
c-sid
(δ= 1.5) – –
0.7 1.0 9.8 11.5
TLBO
algorithm – –
0.6 1.0 9.7 12.3
Post-evaluation result on ESTER dataset
c-sid
(δ= 2.0) – –
0.7 1.0 7.4 9.1
Table 10Benchmark function
Function Formula Range Optima
Authors’contributions
DK and HS designed the speaker diarization model, performed the experimental evaluation, and drafted the manuscript. CA reviewed the paper and provided some advice. All authors read and approved the final manuscript.
Competing interests
The authors declare that they have no competing interests.
Publisher’s Note
Springer Nature remains neutral with regard to jurisdictional claims in published maps and institutional affiliations.
Author details
1
Research Unity of Analysis and Processing of Electrical and Energetic systems, Faculty of Sciences of Tunis, University of Tunis El Manar, 2092 Tunis, Tunisia.2Research Laboratory of Information and Image Processing, National School of Engineers of Tunis, University of Tunis El Manar, 2092 Tunis, Tunisia.
Received: 15 March 2017 Accepted: 30 August 2017
References
1. J. Kennedy, Some issues and practices for particle swarms, in IEEE Swarm Intelligence Symposium, pp.162-169, 2007.
2. A. Veiga, C. Lopes, and F. Perdig~ao.Speaker diarization using Gaussian mixture turns and segment matching. Proc. FALA, 2010.
3. Tranter, S., & Reynolds, D. (2006). An overview of automatic speaker diarization systems, Audio, Speech, and Language Processing.IEEE Transactions on, 14(5), 1557–1565.
4. Gauvain, J. L., Lamel, L., & Adda, G. (1998). Partitioning and transcription of broadcast news data. In ICSLP(Vol. 98-5, pp. 1335–1338).
5. Tang, H., Chu, S., et al. (2012). Partially supervised speaker clustering.IEEE Trans. Pattern Anal. Mach. Intell., 34, 959–971.
6. Li, Y.-X., Wu, Y., & He, Q.-H. (2012). Feature mean distance based speaker clustering for short speech segments.Journal of Electronics & Information Technology, 34, 1404–1407 (In Chinese).
7. W. Jeon, C. Ma, D. Macho, An utterance comparison model for speaker clustering using factor analysis, IEEE International Conference on Acoustics, Speech and Signal Processing, 2011, pp. 4528-4531.
8. Iso, K. (2010).Speaker clustering using vector quantization and spectral clustering(pp. 4986–4989). Dallas: IEEE International Conference on Acoustics, Speech and Signal Processing.
9. Ning, H. Z., Liu, M., Tang, H., et al. (2006).A spectral clustering approach to speaker diarization(pp. 2178–2181). Pittsburgh: IEEE Proceedings of the 9th International Conference on Spoken Language Processing.
10. Wu, K., Song, Y., Guo, W., & Dai, L. (2012). Intra-conversation intra-speaker variability compensation for speaker clustering. In Chinese Spoken Language Processing (ISCSLP), 2012 8th International Symposium on(pp. 330–334). https://doi.org/10.1109/ISCSLP.2012.6423465.
11. Rouvier M., Favre B. Speaker adaptation of DNN-based ASR with i-vectors: does it actually adapt models to speakers?INTER SPEECH14-18 September 2014, Singapore.
12. Wei-Ho Tsai and Hsin-Min Wang, Speaker clustering based on minimum rand index, Department of Electronic Engineering, National Taipei University of Technology, Taipei, Taiwan, 2009.
13. S. Paterlini, T. KrinkDifferential evolution and particle swarm optimization in partitional clustering. Science direct. Computational Statistics & Data Analysis 50 (2006) 1220–1247.
14. Goldberg, Genetic algorithms in search, optimization, and machine learning, Addison-Wesley Longman Publishing Co., Inc. Boston, MA, USA ©1989. 15. G. Liu, Y. Xiang Li and G.HeDesign of digital FIR filters using differential
evolution algorithm based on reserved genes.978-1-4244-8126-2/10/$26.00 ©2010 IEEE.
16. Jain, A.K., Murty, M.N. and Flynn, P.J. (1999), Data clustering: a review.ACM Computing Surveys, 31.264-323. https://doi.org/10.1145/331499.331504. 17. Kennedy, J., & Eberhart, R. C. (1995). Particle swarm optimization. In
Proceedings of IEEE International Conference on Neural Networks, Piscataway, New Jersey(pp. 1942–1948).
18. Clerc, M., & Kennedy, J. (2002). The particle swarm––explosion, stability, and convergence in a multidimensional complex space.IEEE Trans. Evol. Comput., 6(1), 58–73.
19. Tillett, J. C., Rao, R. M., Sahin, F., & Rao, T. M. (2003). Particle swarm optimization for clustering of wireless sensors. In Proceedings of Society of Photo-Optical Instrumentation Engineers(Vol. 5100, p. No. 73).
20. Cui, X., Palathingal, P., & Potok, T. E. (2005). Document clustering using particle swarm optimization. In IEEE Swarm Intelligence Symposium, Pasadena, California(pp. 185–191).
21. Alireza, Ahmadyfard and Hamidreza Modares, Combining PSO and k-means to enhance data clustering, 2008 International Symposium on
Telecommunications, pp. 688-691, 2008.
22. S.M. Mirrezaie & S.M. Ahadi, Speaker diarization in a multi-speaker environment using particle swarm optimization and mutual information, Department of Electrical Engineering, Amirkabir University of
Technology 424 Hafez Avenue, Tehran 15914, Iran. 978-1-4244-2571-6/ 08/$25.00 ©2008 IEEE.
23. M. Zhang, W. Zhang and Y. Sun, Chaotic co-evolutionary algorithm based on differential evolution and particle swarm optimization,Proceedings of the IEEE International Conference on Automation and Logistics Shenyang, China August 2009.
24. R. Yadav, D. Mandal, Optimization of artificial neural network for speaker recognition using particle swarm optimization. International Journal of Soft Computing and Engineering (IJSCE) ISSN: 2231-2307, Volume-1, Issue-3, July 2011. 25. Poli, R., Kennedy, J., & Blackwell, T. (2007). Particle swarm optimization.
Swarm Intelligence, 1(1), 33–57.
26. R. Poli, An analysis of publications on particle swarm optimization applications, Essex, UK: Department of Computer Science, University of Essex, May - Nov2007.
27. Sun, J., Feng, B., & Xu, W. (2004). Particle swarm optimization with particles having quantum behavior. In Proceedings of Congress on Evolutionary Computation, Portland (OR, USA)(pp. 325–331).
28. Z. Hong, Z. JianHua Application of differential evolution optimization based Gaussian mixture models to speaker recognition. School of Information Science and Engineering, East China University of Science and Technology, Shanghai 200237. 978-1-4799-3708-0/14/$31.00_c , 2014, IEEE.
29. R. Storn and K. V. Price, Differential evolution: a simple and efficient adaptive scheme for global optimization over continuous spaces, ICSI, USA, Tech. Rep. TR-95-012, 1995 [Online]. Available: http://www.icsi.berkeley.edu/~ storn/litera.html.
30. R.V. Rao and V. Patel, An elitist teaching-learning-based optimization algorithms for solving complex constrained optimization problems. International Journal of Industrial Engineering Computations, vol. 3, no. 4, pp. 535–560, 2012.
31. S. O. Degertekin and M. S. Hayalioglu, Sizing truss structures using teaching-learning-based optimization. Computers and Structures, vol. 119, pp. 177– 188, 2013.
32. R. V. Rao and V. Patel, An improved teaching-learning-based optimization algorithm for solving unconstrained optimization problems. Scientia Iranica, vol. 20, no. 3, pp. 710–720, 2013.
33. T. Niknam, F. Golestaneh, and M. S. Sadeghi, -Multiobjective teaching-learning-based optimization for dynamic economic emission dispatch. IEEE Systems Journal, vol. 6, no. 2, pp. 341–352, 2012.
34. Zou, F., Wang, L., Hei, X., Chen, D., & Yang, D. (2014). Teaching-learning-based optimization with dynamic group strategy for global optimization. Inf. Sci., 273, 112–131.
35. Wang, L., Zou, F., Hei, X., Yang, D., Chen, D., & Jiang, Q. (2014). An improved teaching learning-based optimization with neighborhood search for applications of ANN.Neurocomputing, 143, 231–247.
36. Suresh Chandra Satapathy, Anima Naik and K Parvathi, A teaching learning based optimization based on orthogonal design for solving global optimization problems. SpringerPlus 2013.
37. Waghmare, G. (2013). Comments on a note on teaching-learning-based optimization algorithm.Information Sciences, 229, 159–169.
38. M. Rouvier, G. Dupuy, P. Gay, E. Khoury, T. Merlin, and S. Meignier, An open source state-of-the-art toolbox for broadcast news diarization. Technical report, Idiap, 2013.
39. M. Anthonius, H. Huijbregts, Segmentation, diarization, and speech transcription, surprise data unraveled. 2008.
41. S. Cheng, H. Min Wang, and H. Fu, Bic-based speaker segmentation using divide-and-conquer strategies with application to speaker diarization. Audio, Speech, and Language Processing, IEEE Transactions on, 18(1):141-157, 2010. 42. T. Nguyen, H. Sun, S. Zhao, S. Khine, HD Tran, TLN Ma, B Ma, ES Chng, and
H Li. The speaker diarization systems for RT 2009. In RT’09, NIST Rich Transcription Workshop, May 28-29, 2009, Melbourne, Florida, USA, volume 14, pages 1740, 2009.
43. H. K. Maganti, P. Motlicek, and D. Gatica-Perez. Unsupervised speech/non-speech detection for automatic speech/non-speech recognition in meeting rooms. In Acoustics, Speech and Signal Processing, 2007. ICASSP 2007. IEEE international conference on, volume 4, pages IV{1037. IEEE, 2007. 44. Luz-Marina Sierra, Carlos Cobos, Juan-Carlos Corrales (2014), Continuous
optimization based on a hybridization of differential evolution with K-means, In computer science, November, 2014.
45. Murty, M.R.,et al.(2014), Automatic clustering using teaching learning based optimization. AppliedMathematics, 5, 1202-1211. https://doi.org/10. 4236/am.2014.58111.
46. Pal, S.K. and Majumder, D.D. (1977). Fuzzy sets and decision making approaches in vowel and speaker recognition. IEEE Transactions on Systems, Man, and Cybernetics,7, 625-629.
47. Satapathy, S.C. and Naik, A. (2011), Data clustering based on teaching-learning-based optimization.Lecture Notes in Computer Science, 7077, 148-156. 48. Blake, C., Keough, E., & Merz, C. J. (1998).UCI repository of machine learning
databasehttp://www.ics.uci.edu/~mlearn/MLrepository.html.
49. D. Davies and D. Bouldin, A cluster separation measure.Determining the number of clusters In CROKI2 algorithm, IEEE PAMI, vol. 1, no. 2, pp. 224– 227, 1979.
50. Malika Charrad RIADI and CEDRIC, Determining the number of clusters In CROKI2 algorithm. First Meeting on Statistics and Data Mining, MSriXM‘09, 2009
51. S. Bozonnet, NWD Evans, and C. Fredouille, The LIA-EURECOM RT’09 speaker diarization system: enhancements in speaker Gaussian and cluster purification. In Acoustics Speech and Signal Processing (ICASSP), 2010 IEEE International Conference on, pages 4958{4961. IEEE, 2010.
52. S.M. Mirrezaie & S.M. Ahadi (2008), Speaker diarization in a multi-speaker environment using particle swarm optimization and mutual information. 978-1-4244-2571-6/08/$25.00 ©2008 IEEE.
53. C. Barras, X. Zhu, S. Meignier, and J. Gauvain, (2006), Multistage speaker diarization of broadcast news. IEEE Transactions on Audio, Speech, and Language Processing, VOL. 14, NO.5, SEPTEMBER 2006.