Osama K.; et al … -157-
P P P P
EPICARDIAL FAT VOLUME AS A PREDICTOR OF THE SEVERITY OF CAD BY MSCT
Osama Khalil Mohammed, Magdy Mohammed Abd-Elsamee, Hisham Samir Roshdy, Mohammed Hassan Soliman
Cardiovascular Medicine Faculty of Medicine, Zagazig University
ABSTRACT
Background: Distribution of body fat is known to be more independent and potent predictor of morbidity and mortality than total body adipocity. Each visceral fat storage is anatomically and functionally different and according to its closeness to an organ, it exerts a specific local function for each one. Epicardial adipose tissue (EAT) as a fat depot is further implicated on coronary artery disease (CAD) because of proximity to the adventitia of major epicardial coronary arteries. Epicardial fat volume (EFV) can be evaluated by MSCT even without contrast injection which helps in prediction of the presence and the severity of CAD.
Objectives: To evaluate the relationship between epicardial fat volume and the severity of coronary artery disease among patients presented by chest pain with low to intermediate pretest probability for CAD using Multi-Slice CT coronary angiography.
Subjects and methods: The study included 100 patients, 94 males and 6 females with mean age 56.03 ± 10.24 years who were referred to the MSCT coronary angiography unit in Zagazig University Hospital and Kobri Elkobba Military Hospital during the period from January 2017 to August 2017. All patients were subjected to through history taking including age, sex, family history of CAD, DM, HTN, smoking, complete clinical examination including BMI and overweight was defined as ≥ 25 kg/m2, standard ECG, analysis of lipid profile, measurement of serum creatinine and random blood glucose level as well as Multi-slice CT angiography.
Results: There was significant relationship between EFV and Proximal LAD and D1 lesions (p = 0.020) as regarding segment involvement score (SIS) and segment stenosis score (SSS) by MSCT. Epicardial fat volume (EFV) was
125.34 ± 35.37 cm3 (range from 47.4 to 221.3 cm3 and the median value of EFV in our patients was 123.35 cm3) and Coronary artery calcium score (CACS) was 157.69 ± 352.95 (range from 0 to 2212 and the median value was 29.55) with significant relationship between EFV and Ca score (p = 0.009), highly significant relationship between EFV and SIS score and SSS score (p < 0.001). There was significant relationship between EFV and sex (p = 0.002), highly significant relationship between EFV and hypertension and diabetes mellitus (p < 0.001), no significant relationship between EFV and smoking (p = 0.754) and family history of ischemic heart disease (p = 0.082), significant relationship between EFV and age (p = 0.011), highly significant relationship between EFV and serum cholesterol, LDL, serum triglycerides, LDL/HDL ratio, BMI and inversely proportional to HDL (p < 0.001).
Conclusion: we concluded in our study that EFV was associated with coronary atherosclerosis and EFV increased steeply in patients with significant coronary artery stenosis and in those with severe coronary artery calcification as revealed by MSCT angiography. Quantitation of EFV may be useful in addition to coronary artery calcium score as a predictor to identify patients at risk for CAD.
Keywords: Epicardial fat volume, coronary artery disease and Multi-slice CT angiography. Corresponding Author: Osama Khalil Mohammed
Tel: 01110595069
Email: [email protected]
INTRODUCTION
he distribution of body fat varies among individuals and may be as important as the amount of body fat in determining risk. In fact, excess accumulation of fat around the upper body is associated with a higher risk of coronary heart disease regardless of total body
fat (1).
This fat deposit is a major source of biomolecules and compartmentalized production of cytokines and hormones, acting as a localized gland. Moreover, it regulates heart and blood vessel physiologically, via paracrine and vasocrine mechanisms. It has
also been reported that epicardial adipose tissue (EAT) acts as an important energy reservoir for cardiomyocytes, which depend on
fatty acid oxidation as energy source (2). Although EAT is needed for heart muscle function, in recent decades it has been published that CVD and metabolic syndrome (MS), becoming a new pharmacological target for primary and secondary prevention
strategies (3).
P facilitating adipokines distribution into the heart muscle and arteries, and finally exerting a morphofunctional modulation in such
organs (4).
Epicardial adipose tissue (EAT) has been proposed as a risk factor for coronary artery disease (CAD), as well as a predictor for the development of future cardiovascular events. Located between the myocardium and the visceral pericardium, EAT is visceral fat that directly surrounds the coronary arteries. It may work as an endocrine organ secreting hormones, bioactive adipocytokines and chemokines, in this way potentially promoting CAD. Consequently, EAT may have a potential role as a parameter for risk stratification purposes in patients presenting
with chest pain (5).
Multi-slice CT is a noninvasive tool that allows to reliably assessing both obstructive and non-obstructive subclinical coronary artery disease in an earlier stage than invasive angiography and providing data on calcium burden, the presence of coronary artery stenosis, but also, more recently, on coronary atherosclerotic plaque morphology and composition and epicardial fat volume (EFV) evaluation even without contrast injection which helps in prediction of the presence and the severity of CAD (6).
SUBJECTS AND METHODS
Patient selection:
This current cross sectional study included 100 patients with suspected coronary artery disease, selected according to inclusion and exclusion criteria and referred for multi-slice CT angiography in Zagazig University Hospital and kobri El kobba Military Hospital during the period from January 2017 to August 2017.
Inclusion Criteria:
The study included:
All patients presenting by chest pain with low to intermediate PTP of CAD according to Diamond and Forrester Pre-Test Probability of Coronary Artery Disease (Modified from the ACC/AHA 2002 Guideline Update for Exercise Testing).
Exclusion criteria: The study excluded:
1- Patients with renal insufficiency (S. creatinine
>1.5 mg/dl).
2- Patients with previous history of PCI or previous CABG.
3- Patients with dye allergy.
4- Patients with irregular heart rythm like AF and frequent extrasystoles.
5- Patients have difficulties in performing CT, like inadequate breath holding and heart failure.
6- Patients diagnosed as having acute coronary syndrome.
Methods:
All patients were subjected to:
A- Full history taking fulfilling the following data:
1- Age. 2- Sex.
3- Family history of ischemic heart disease (first degree relatives).
4- Smoking. 5- Hypertension. 6- Diabetes mellitus
B- Complete clinical examination including:
Body mass index (BMI)
Normal BMI: 18.5 – 24.9 Kg/m2 Overweight: if ≥ 25 Kg/m2
C- Standard ECG including the following data:
1- Rhythm. 2- Rate. 3- Ischemic changes.
D- Routine laboratory investigations including:
1- Random Blood glucose level 2- Serum creatinine.
3- Complete Lipid profile: Which included the serum assay of:
Total Cholesterol, triglycerides, HDL, LDL and LDL/HDL ratio.
E- Multi-slice CT angiography:
All CT scans were performed on The SEMINS Somatom Definition Flash which is a second generation dual source 128-slice CT scanner.
We measured coronary calcium score and epicardial fat volume without contrast injection followed by measurement of plaque burden in the form of segment involvement score (SIS) and segment stenosis score (SSS) after contrast injection.
RESULTS
Osama K.; et al … -159- unit in Zagazig University Hospital (about 36
patients) and Kobri Elkobba Military Hospital
(about 64 Patients) during the period from January 2017 to August 2017.
Table (1): Shows prevalence of risk factors for atherosclerosis among the study group (Qualitative factors).
Qualitative Risk Factors Count %
Sex M 94 94 %
F 6 6 %
HTN 48 48 %
DM 57 57 %
Smoking 52 52 %
Family history of CAD 16 16 %
Table (2): Shows prevalence of risk factors for atherosclerosis among the study group (Quantitative factors).
Quantitative Risk Factors Mean Standard
Deviation Median Minimum Maximum
Age (Ys) 56.03 10.24 57.00 31.00 78.00
S. Cholesterol (mg/dl) 211.53 38.42 225.00 130.00 280.00
LDL (mg/dl ) 162.20 46.49 185.00 70.00 220.00
HDL (mg/dl ) 43.08 12.23 36.00 29.00 65.00
S. Triglycerides (mg/dl ) 160.61 28.86 170.00 110.00 220.00
LDL/HDL 4.26 1.95 5.10 1.10 7.30
Body Mass Index (Kg/m2) 27.11 1.96 27.40 23.80 30.90
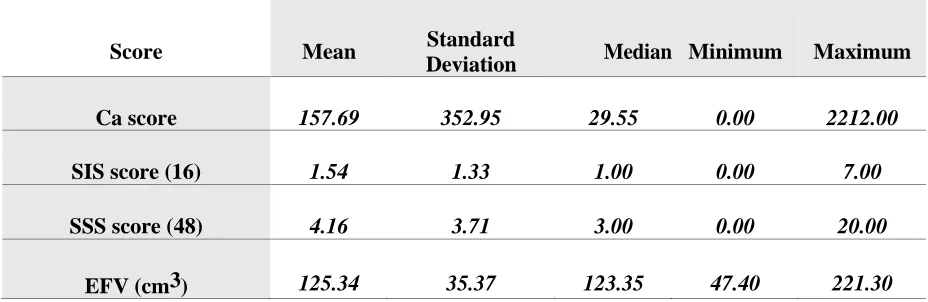
Table (3): Scores that measure extent and severity of CAD plaque and EFV of the study group.
Score Mean Standard
Deviation Median Minimum Maximum
Ca score 157.69 352.95 29.55 0.00 2212.00
SIS score (16) 1.54 1.33 1.00 0.00 7.00
SSS score (48) 4.16 3.71 3.00 0.00 20.00
EFV (cm3) 125.34 35.37 123.35 47.40 221.30
Figure (1): Bar diagrams shows significant correlation between EFV and qualitative risk factors for atherocclerosis
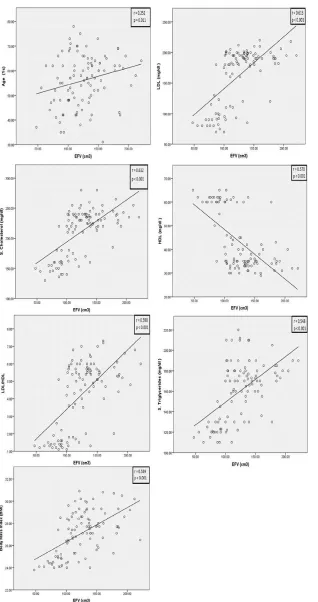
Osama K.; et al … -161- Figure (2): Scatter diagrams with trend line shows linear regression analysis between EFV and quantitative risk factors for atherosclerosis (Age, cholesterol, triglycerides, LDL, HDL,
LDL/HDL ratio and BMI).
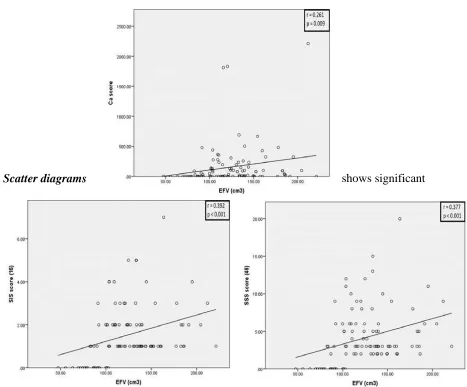
* Scatter diagrams shows significant
relationship between EFV and Ca score (p = 0.009), highly significant relationship between EFV, SIS score and SSS score (p < 0.001).
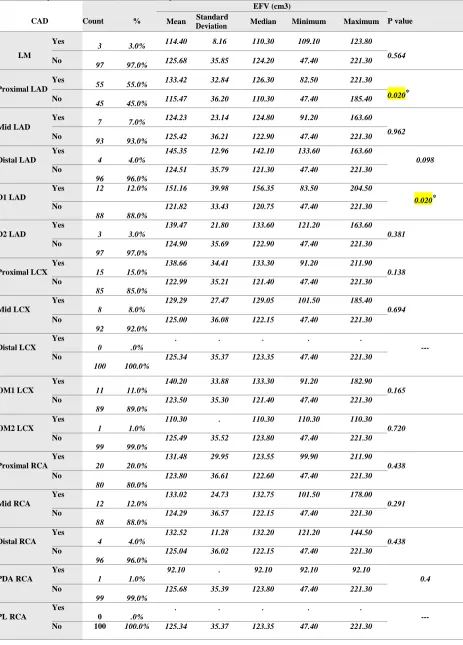
Osama K.; et al … -163- Table (4): Shows relationship between epicardial fat volume and the coronary lesions assessed by MSCT and evaluated by SIS Score
CAD Count %
EFV (cm3)
P value Mean Standard
Deviation Median Minimum Maximum
LM
Yes
3 3.0% 114.40 8.16 110.30 109.10 123.80 0.564
No
97 97.0% 125.68 35.85 124.20 47.40 221.30
Proximal LAD Yes
55 55.0% 133.42 32.84 126.30 82.50 221.30
0.020*
No
45 45.0% 115.47 36.20 110.30 47.40 185.40
Mid LAD
Yes
7 7.0% 124.23 23.14 124.80 91.20 163.60 0.962
No
93 93.0% 125.42 36.21 122.90 47.40 221.30
Distal LAD Yes
4 4.0%
145.35 12.96 142.10 133.60 163.60
0.098
No
96 96.0%
124.51 35.79 121.30 47.40 221.30
D1 LAD
Yes 12 12.0% 151.16 39.98 156.35 83.50 204.50
0.020*
No
88 88.0%
121.82 33.43 120.75 47.40 221.30
D2 LAD
Yes
3 3.0%
139.47 21.80 133.60 121.20 163.60 0.381
No
97 97.0%
124.90 35.69 122.90 47.40 221.30
Proximal LCX Yes
15 15.0%
138.66 34.41 133.30 91.20 211.90 0.138
No
85 85.0%
122.99 35.21 121.40 47.40 221.30
Mid LCX
Yes
8 8.0%
129.29 27.47 129.05 101.50 185.40 0.694
No
92 92.0%
125.00 36.08 122.15 47.40 221.30
Distal LCX Yes
0 .0%
. . . . .
---
No
100 100.0%
125.34 35.37 123.35 47.40 221.30
OM1 LCX Yes
11 11.0%
140.20 33.88 133.30 91.20 182.90 0.165
No
89 89.0%
123.50 35.30 121.40 47.40 221.30
OM2 LCX Yes
1 1.0%
110.30 . 110.30 110.30 110.30 0.720
No
99 99.0%
125.49 35.52 123.80 47.40 221.30
Proximal RCA Yes
20 20.0%
131.48 29.95 123.55 99.90 211.90 0.438
No
80 80.0%
123.80 36.61 122.60 47.40 221.30
Mid RCA
Yes
12 12.0%
133.02 24.73 132.75 101.50 178.00 0.291
No
88 88.0%
124.29 36.57 122.15 47.40 221.30
Distal RCA Yes
4 4.0%
132.52 11.28 132.20 121.20 144.50 0.438
No
96 96.0%
125.04 36.02 122.15 47.40 221.30
PDA RCA Yes
1 1.0%
92.10 . 92.10 92.10 92.10
0.4
No
99 99.0%
125.68 35.39 123.80 47.40 221.30
PL RCA
Yes
0 .0%
. . . . .
---
P P
DISCUSSION
This study aimed to investigate the relationship between epicardial fat volume and atherosclerosis as well as other risk factors of atherosclerosis. Our study was conducted in Zagazig University Hospital and Kobri Elkobba military Hospital in the period between January 2017 and August 2017. It included 100 patients referred for MSCT along with full labs including renal function tests and lipid profile. The mean age of the studied population is 56.03 ± 10.24 years, most of them (94%) where males.
While analyzing the data obtained from the current study it is important to keep in mind the study population characteristics. All study group was presented by chest pain with low to intermediate PTP of CAD. In our study, we used scores to measure extent and severity of atherosclerosis in coronaries (SIS, SSS and Ca score).
The study showed that EFV was significantly associated with both coronary atherosclerosis and coronary artery stenosis. EFV increased step-wise with increased coronary plaque burden (increased coronary segments containing plaques) and increased steeply with the presence of significant coronary artery stenosis, defined as percent diameter stenosis >50%. Also in this study dyslipidemia was significantly associated with increased epicardial fat volume, especially LDL.C and total cholesterol.
In our study the HDL.C was significant risk factor and epicardial fat volume is inversely proportional to its increase and was approved
by Okada et al. (2014) who found
correlations between increased EAT and reduced HDL-C and increased IL-6 and high sensitivity C-reactive protein (hs-CRP) (7).
Mahabadi et al. (2013) found from the
overall 4,093 participants (age 59.4 years, 47% male), 130 subjects developed a fatal or nonfatal coronary event and they concluded that epicardial fat is associated with fatal and nonfatal coronary events in the general population independent of traditional
cardiovascular risk factors (5), but we were different in MSCT was conducted on patients with suspected CAD not on general
population.
Bastarrika et al. (2010) performed automatic volumetry of epicardial fat by MSCT and patients with significant coronary artery stenosis had significantly greater EFV (154.58 ± 58.91 mL) than those without significant
CAD (120.94 ± 81.85 mL) (8) and this was found in our study.
Park et al. (2010) analyzed Effects of Statins on the epicardial fat thickness in patients with coronary artery stenosis. The use of statins, particularly atorvastatin, is associated with a reduction in the volume of EAT in patients with CAD; EAT change was 0.47 ± 0.65mm in the atorvastatin group versus 0.12 ± 0.52mm in the simvastatin/ezetimibe group
(9). Our study showed that increase serum
cholesterol and LDL (which are controlled by statins) were directly proportional to EFV.
Lima et al. (2011) measured the epicardial fat volume using cardiac MRI in asymptomatic persons and it was correlated more strongly with plaque burden than body mass index (BMI). However, data about epicardial fat in asymptomatic individuals was limited, partially because the primary assessment method, intravascular ultrasound, was
invasive (10). In contrast our study cardiac CT was used and conducted on patients with suspected CAD.
Hirata et al. (2015) tested the hypothesis that echocardiographic adipose thickness especially adipose thickness in anterior interventricular groove (EAT-AIG), where the left descending coronary artery runs, can be a marker for the presence and severity of CAD. According to the coronary angiography, subjects were divided into two groups with (CAD group: 113 patients, 67 ± 11 years, 89 male) and without (non- CAD group: 50
patients, 69 ± 11 years, 31 male) (11). There was agreement between this study and affected coronaries in our study as there was significant relationship between EFV and proximal LAD and D1 lesions (p = 0.020).
Osama K.; et al … -165- disease risk factors. They also found that
epicardial fat was associated with coronary artery calcification (12) as shown in our study by significant correlation between EFV and coronary calcium score, whereas intrathoracic fat was associated with abdominal aortic calcification.
CONCLUSION
Our results showed that EFV was associated with coronary atherosclerosis and EFV increased steeply in patients with significant coronary artery stenosis and in those with severe coronary artery calcification as revealed by multi-slice computed tomography.
Quantitation of EFV may be useful, in addition to coronary calcium score and can be used as a predictor to identify patients at risk for CAD.
REFERENCES
(1)Mazurek T, Zhang L, Zalewski A, et al. Human epicardial adipose tissue is a source of inflammatory mediators. Circulation. 2003; 108: 2460–2466.
(2)Iacobellis G., Malavazos A., and Corsi M., “Epicardial fat: from the biomolecular aspects to the clinical practice,” International Journal of Biochemistry and Cell Biology, vol. 43, no.12, pp. 1651–1654, 2011.
(3)Cikim A, Topal E, Harputluoglu M, et al. “Epicardial adipose tissue, hepatic steatosis and obesity,” Journal of Endocrinological Investigation, vol. 30, no. 6, pp. 459–464, 2007.
(4)Lima M. and Iacobellis G., “Grasa epic´ardica: Una nueva herramienta para la evaluaci´on del riesgo cardiometab´olico,”
Hipertensi´on y Riesgo Vascular, vol. 28, no. 2, pp. 63–68, 2011.
(5)Mahabadi A, Berg M, Lehmann N, et al.
Association of epicardial fat with
cardiovascular risk factors and incident myocardial infarction in the general population: The heinz nixdorf recall study. J
Am Coll Cardiol 2013; 61:1388-95.
(6)Leber A, Knez A, von Ziegler F, et al.
Quantification of obstructive and
nonobstructive coronary lesions by 64-slice computed tomography. A comparative study with quantitative coronary angiography a n d intravascular ultrasound. J Am Coll Cardiol 2005; 46:147–54.
(7)Okada K, Ohshima S, Isobe S, et al. “Epicardial fat volume correlates with severity of coronary artery disease in non-obese patients,” Journal of Cardiovascular Medicine, vol. 15, no. 5, pp. 384– 390, 2014.
(8)Bastarrika G, Broncano J, Schoepf U, et al. Relationship between coronary artery disease and epicardial adipose tissue quantification at cardiac CT: comparison between automatic
volumetric measurement and manual
bidimensional estimation. Acad Radiol 2010; 17:727–734.
(9)Park J. H, Park Y. S, Kim Y. J, et al. “Effects of Statins on the epicardial fat thickness in patients with coronary artery stenosis underwent percutaneous coronary intervention: comparison of Atorvastatin with
Simvastatin/Ezetimibe,” Journal of
Cardiovascular Ultrasound, vol. 18, no. 4, pp. 121–126, 2010.
(10) Lima M. and Iacobellis G., “Grasa epic´ardica: Una nueva herramienta para la evaluaci´on del riesgo cardiometab´olico,”
Hipertensi´on y Riesgo Vascular, vol. 28, no. 2, pp. 63–68, 2011.
(11) Hirata Y, Yamada H, Kusunose K, et al. Clinical Utility of Measuring Epicardial
Adipose Tissue Thickness with
Echocardiography Using a High-Frequency Linear Probe in Patients with Coronary Artery
Disease. J Am Soc Echocardiogr.
2015;28(10):1240–1246. e1241.