Open Access
Research
Reference signal extraction from corrupted ECG using wavelet
decomposition for MRI sequence triggering: application to small
animals
Dima Abi-Abdallah*
1, Eric Chauvet
1,2, Latifa Bouchet-Fakri
3,
Alain Bataillard
4, André Briguet
2and Odette Fokapu
1,2Address: 1Laboratoire de Biomécanique et Génie Biomédical, UMR CNRS 6600, Université de Technologie de Compiègne, France, 2Université de
Picardie Jules-Verne, IUT de L'Aisne, France, 3Laboratoire de RMN Méthodologie et Instrumentation en Biophysique, UMR CNRS 5012, UCB Lyon
1-ESCPE, France and 4FRE 2678, Physiologie et Pharmacie Clinique, Université Lyon 1, France
Email: Dima Abi-Abdallah* - [email protected]; Eric Chauvet - [email protected]; Latifa
Bouchet-Fakri - [email protected]; Alain Bataillard - [email protected]; André Briguet - [email protected]; Odette Fokapu - [email protected]
* Corresponding author
Abstract
Background: Present developments in Nuclear Magnetic Resonance (NMR) imaging techniques strive for improved spatial and temporal resolution performances. However, trying to achieve the shortest gradient rising time with high intensity gradients has its drawbacks: It generates high amplitude noises that get superimposed on the simultaneously recorded electrophysiological signals, needed to synchronize moving organ images. Consequently, new strategies have to be developed for processing these collected signals during Magnetic Resonance Imaging (MRI) examinations. The aim of this work is to extract an efficient reference signal, from an electrocardiogram (ECG) that was contaminated by the NMR artefacts. This may be used for image triggering and/or cardiac rhythm monitoring.
Methods: Our method, based on sub-band decomposition using wavelet filters, is tested on various ECG signals recorded during three imaging sequences: Gradient Echo (GE), Fast Spin Echo (FSE) and Inversion Recovery with Spin Echo (IRSE). In order to define the most adapted wavelet functions to use according to the excitation protocols, noise generated by each imaging sequence is recorded and analysed. After exploring noise models along with information found in the literature, a group of 14 wavelets, members of three families (Daubechies, Coiflets, Symlets), is selected for the study. The extraction process is carried out by decomposing the contaminated ECG signals into 8 scales using a given wavelet function, then combining the sub-bands necessary for cardiac synchronization, i.e. those containing the essential part of the QRS energy, to construct a reference signal.
Results: The efficiency of the presented method has been tested on a group of quite representative signals containing: highly contaminated (mean SNR<-5 dB) simulated ECGs that replicate normal and pathological human heart beats, as well as some pathological and healthy rodents' actual ECG records. Despite the weak SNR of the contaminated ECG, the performances were quite satisfactory. When comparing the wavelet performances, one may notice that for a
Published: 20 February 2006
BioMedical Engineering OnLine2006, 5:11 doi:10.1186/1475-925X-5-11
Received: 04 November 2005 Accepted: 20 February 2006
This article is available from: http://www.biomedical-engineering-online.com/content/5/1/11
© 2006Abi-Abdallah et al; licensee BioMed Central Ltd.
given sequence, some wavelets are more efficient for processing than others; for GE, FSE and IRSE sequence, good synchronisation condition is accomplished with coif5, sym8, and sym4 respectively.
Conclusion: Sub-band decomposition proved to be very suitable for extracting a reference signal from a corrupted ECG for MRI triggering. An appropriate choice of the wavelet function, in accordance with the image sequence type, could considerably improve the quality of the reference signal for better image synchronization.
Background
Magnetic Resonance Imaging (MRI) has become by far the primary tool for gaining important insights into the func-tional and metabolic bases of heart disease. However, the observation of a moving organ, such as a beating heart, requires synchronization: since an image cannot be acquired in one heart cycle, its successive acquisitions have to be accurately combined with the cardiac phase motion. Such requirements depend on a reliable detec-tion of the R-wave of the electrocardiogram (ECG) to guarantee that consecutive image data collections always start at the same point of the cardiac cycle. Still, a funda-mental problem for monitoring a subject's cardiac activity during MRI is the corruption of the ECG signal due to adverse electromagnetic effects [1-4]. The oscillating mag-netic fields may induce voltage artefacts which do not reflect actual electrophysiological events. This effect is par-ticularly pronounced in small animals MRI microscopy, where strong and rapidly-switching gradients, leading to elevated induced voltages, are needed to obtain high spa-tial and temporal resolution. Conversely, a small animal's ECG is just few millivolts in amplitude and with the spu-rious signals often resembling the QRS spike, correct car-diac gating is often greatly disrupted. Recent works have proposed to improve motion gating strategies [5,6], how-ever the system presently commercialized for small ani-mal monitoring is still in its early development stage.
During cardiac MRI, the signal acquired by the ECG sen-sor does not only contain the electrophysiological infor-mation, it also includes some components generated by the NMR environment, and the collected signal S(t) can be modelled as [3]:
S(t) = Sel(t) + Sflow(t) + Smove(t) + SMR(t) + Srf(t) (1)
Sel(t) represents the signal to be analysed (ECG). Sflow(t) is induced by the magnetohydrodynamic effect, and Smove(t) is due to subject-related sensor motions in the magnetic field (respiration, heart beat and voluntary motion). These two contaminating signals cover a range of several Hz which may overlap the ECG spectrum. Radiofrequency pulses are of several MHz (typically 64 MHz at 1.5 T) and induce the Srf(t) noise in this frequency range or in the order of the inverse of duration pulses, which is several tens of kilohertz. SMR(t) is due to the temporal variations
of the magnetic field gradients which are typically switched during some 10 ms, thus the corresponding induced voltages are in a frequency range of several Hz to kHz. The frequency distribution of the overall signal is a major point to take into account if any filtering is to be carried out, since the artefacts to be removed should be distinguishable from the desired signal (ECG) which is at several Hz. But given that there is some spectral overlap-ping between the noise and the desired components of the ECG, we turned to wavelet decomposition which has proven to be particularly well suited for such cases [7-10]. ECG signals are characterized by a cyclic occurrence of pat-terns (QRS complexes, P and T waves) with different fre-quency content. Power spectral analysis of the ECG shows that, P and T waves usually have an important spectral density up to 10 Hz only, while most of the QRS power lies in the 3–17 Hz band [11]. Moreover, NMR induced noise and artefacts disturbing the ECG signal appear at disparate frequency bands. Thus, a strategical approach for detecting heartbeats is to analyze the different sub-bands of the ECG [12], for this we make use of the wavelet transform that can provide a description of the signal in the time-scale domain, allowing the representation of the temporal features of a signal at different resolutions. By exploiting this powerful tool here, we aim to extract a ref-erence signal from a contaminated ECG signal. This refer-ence signal can be either used for subject heart rate monitoring or for synchronization during MRI scans. The proposed extraction method relies on a multidimensional modeling technique and it consists in decomposing the contaminated ECG signal into frequency sub-bands using the wavelet transform. Since the wavelet shape must be carefully adapted to achieve good event detection, the choice of the wavelet function is at the center of this study. The wavelets already used to detect QRS complex are con-sidered again. Furthermore, some particular characteris-tics of artefact noise generated by the NMR environment are also taken into account. The extraction procedure is applied to several signals using various wavelet functions, to determine the most suitable wavelets to locate R peaks according to the employed MRI sequence.
Methods
Experimental setup and data acquisition
gradient system, and a MR compatible ECG sensor which technical details are provided in [1]. This device is designed to reduce the interaction sources: three bypasses (100 pF capacitors) guarantee a reduction of RF contami-nation of the ECG amplifier by the MR system. The ECG is amplified and converted into an optical signal which is transmitted out of the magnet bore by optical fibre and then converted back to electrical. The experimental signals were detected using three carbon electrodes (3M™ Red Dot™ Radiolucent Electrode), then lowpass filtered (0.5 -20 Hz) and sampled at 1 kHz. A digital signal processing system (NI DAQCard-6024E, and a PC with Matlab) was placed outside the Faraday cage for data acquisition, processing and storage.
Ten seconds of signal were recorded during MR scanning using three imaging sequences: Gradient Echo (GE), Fast Spin Echo (FSE) and Inversion Recovery with Spin Echo (IRSE). The scan parameters for theses sequences are out-lined in Table 1 and they correspond to mice cardiac MRI parameters. Three types of data were recorded:
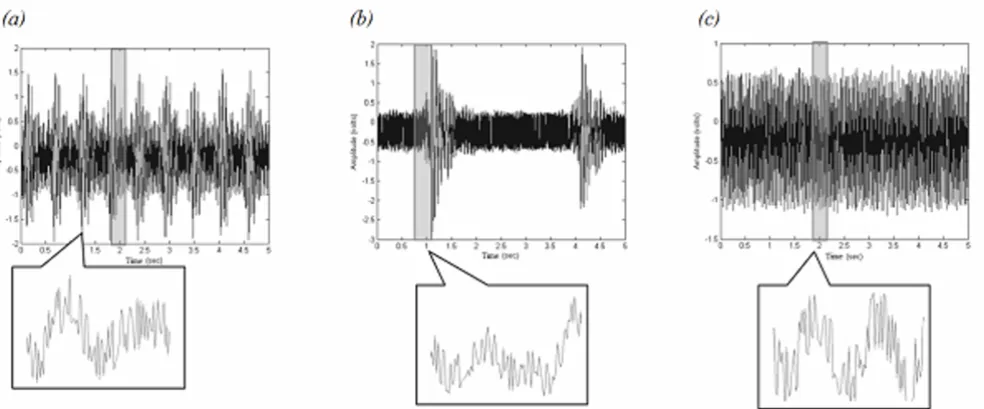
a) Noise generated by the NMR environment: two electrodes, immersed in a conducting fluid (salt water) made it pos-sible to collect noise signals corresponding to three NMR sequences (figure 1). These signals, mainly due to gradient artefacts, would then be analysed to select the wavelets for ECG decomposition.
b) Corrupted simulated ECG: an ECG simulator (phantom
320 GmbH Mebsystem für Medizintechnik) placed out-side the magnet provided signals that were driven inout-side the MRI tunnel using carbon cables. These signals could then be contaminated by the NMR artefacts, while the imaging sequences were activated. The simulated signals included 4 ECG types: Two Normal simulated ECGs
denoted "75 bpm" (simulation of a normal human ECG) and "180 bpm" (simulation of a normal small animal ECG: high frequency heart beat) where bpm represents the beat number per minute. Two Pathological simulated ECGs denoted "Bigeminy" (simulation of premature ven-tricular contraction where an elevated venven-tricular prema-ture beat follows each normal beat) and "Sinus Arrhythmia" (simulation of variable R wave occurence periods). The choice of the ECG signal types was directly related to the study context, especially in the case of path-ological signals that involve rather distorted characteris-tics. Figure 2 shows the four simulated ECGs before (recorded outside the NMR environment) and after (recorded in the magnet bore) contamination by the noise of the different sequences. For each signal, the con-tamination level was evaluated, according to the sequence noise, resulting in the following SNR mean values: -5.92 Table 1: Description of rodents and imaging sequence
parameters
Weight Sequence parameters (TR/TE in ms) GE FSE IRSE rat 170 g – 550 g 150/5 1700/18 1900/30 mouse 30 – 32 g 385/10 370/10 370/10
Recorded noise signals Figure 1
dB for GE, -5.07 dB for FSE, and -8.15 dB for IRSE. Such poor SNR are due to the long cables necessary to drive the signal from the simulator device to the MRI magnet bore. They constitute after all, a very interesting aspect for eval-uating the effectiveness of our algorithm.
c) Rodent bipolar ECG signals: They were collected, during MR scanning, on anaesthetized mice and rats which weight ranges are given in Table 1. Rodents were anesthe-tized by intraperitoneal injection of sodium pentobarbital (50 mg/kg, Sanofi, France). ECG electrodes were posi-tioned on the animal's thorax in a lead II configuration. The ECG sensor was placed close to the animal, and short cables were used to connect it to the electrodes, thus avoiding additional artefacts. The animal was then secured on a cradle, inside a birdcage RF coil, and placed at the centre of the gradient set.
Selection of the wavelet functions
There is no absolute rule to determine the most adequate analyzing wavelets; the choice must always be specific to the application as well as to the analysis requirements [13]. Since the characteristics of the noise generated by the NMR environment vary greatly according to the excitation sequence, one may have to test a large number of wavelets in order to associate the most appropriate wavelet with each imaging sequence. For this study, three wavelet fam-ilies were retained that represent the most commonly used families of orthogonal wavelets for detecting ECG events: Daubechies, Coiflets and Symlets. The members of the corresponding families to use were then picked out: on the one hand by relying on a thorough investigation of related literature. And on the other, by analysing noise characteristics observed during the different excitation sequences.
Simulated ECG recorded before and after contamination Figure 2
a) Wavelet selection based on literature data
Among the wavelet families mentioned above, we selected the members that have proven to be very efficient for ECG denoising and/or QRS complex detection. Some of the wavelets used in compression techniques, where the pres-ervation of the ECG waveform morphology is of great importance, were also retained. The Daubechies wavelets have shown to be very adequate for noise reduction [14,15], baseline wandering removal [16], and QRS detec-tion [17], they are also widely used for ECG compression [18-21]. Such applications have usually required the use of db1, db3, db4 or db6. On the other hand, due to their redundancy, the Coiflets insure minimum signal degrada-tion and provide a convenient technique for QRS extrac-tion [19], and data compression [22]. In particular, coif2 and coif3 were used for cardiac arrhythmia classification algorithms [23,24]. Conversely, the Symlets were mainly chosen for their resemblance to the ECG signal shape [25]. Their efficiency has been reported for ECG denoising and compression, particularly the sym3, sym 4 and sym6 wavelets [19,20]. According to this bibliographical report, the first group of wavelets to be tested by the proposed algorithm was composed of: db1, db3, db4, db6, coif2, coif3, sym3, and sym4.
b) NMR noise resembling wavelets
For this second selection, the investigation was enlarged to include wavelets generally used for denoising or detect-ing events in various electrophysiological signals (Electro-CardioGram, ElectroEncephaloGram, ElectroMyoGram, ElectroOculoGram) We set aside the wavelets, members of the three previously mentioned families, which have been used for applications such as EEG, EOG and uterine EMG denoising [26-30], respiration and arterial pressure multiresolution analysis [26], foetal ECG extraction [31], analysis of time-frequency characteristics of motor unit action potentials [32], and EMG decomposition [33,34]. The gathered wavelets were then compared with the most representative samples (temporal motifs reproduction) of
the noise signals, recorded during the three imaging sequences. The most distinguishable noise samples showed resemblance to db3, sym3, coif2, sym4, sym5, sym7 wavelets; an illustration is given figure 3. It was also possible to depict samples similar in shape to db4, coif3, sym3, and sym6. To this wavelet group we added coif4 and coif5 which resemble coif3, as well as sym8 which looks like sym6. By putting together those noise resem-bling wavelets, with the set composed in (a) we get a group of 14 wavelets to be tested with the elaborated algo-rithm: {db1, db3, db4, db6, coif2, coif3, coif4, coif5, sym3, sym4, sym5, sym6, sym7, sym8}.
The algorithm
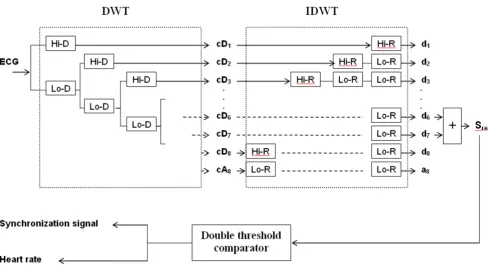
The algorithm (figure 4) includes three main steps:
i) Frequency sub-band decomposition of the contami-nated ECG signal based on discrete wavelet transform.
ii) Reference signal construction by merging the detail sig-nals where the QRS complexes have the most important frequency components.
iii) Trigger extraction by applying a threshold to the refer-ence signal.
Frequency sub-band decomposition of the contaminated ECG The sub-band decomposition is based on the orthogonal discrete wavelet transform (DWT). Detailed description of the theory and implementation of DWT is given in [35]. To summarize, the decomposition of the signal with DWT is based on a partition in the frequency plane using a quadrature mirror filter (QMF) bank [36]. The filter bank is made up of pairs of digital high-pass and low-pass filters organized in a tree structure. At each level, the signal is decomposed into detail (high frequency components) and approximation (low frequency components) coeffi-cients and is then down-sampled. The detail coefficoeffi-cients are afterwards stored and the decomposition continues by Example of comparison between noise shapes and some wavelets
Figure 3
filtering the obtained approximation. At each level j, the frequency axis is recursively divided into halves at the ideal cut-off frequencies.
fj = 2-j.1/2T (where T is the sampling period) (2)
The number of decomposition scales in this work was determined referring to [11] where it was shown that most of the QRS energy lies in the 4–17 Hz band. Accordingly, the choice of the number of decomposition scales should be performed in such a way as to isolate this particular bandwidth. Thus, the contaminated ECG signals sampled at 1 kHz were decomposed into 8 frequency sub-bands resulting in the following filter banks bandwidth: 1.96, 3.91, 7.81, 15.63, 31.25, 62.5, 125, and 250 Hz. For each level, detail signals were then reconstructed, using low-pass and high-low-pass reconstruction filters with up-sam-pling.
Extraction of the reference signal
Here 'reference signal', denoted as Sref represents an ECG model where the QRS features have the major frequency
components. After reconstruction of the detail signals, the reference signal could be performed by summing details d6 and d7 resulting in a [3.91–15.63] Hz sub-band.
Trigger computation
The computation is based on a simple Schmitt trigger principle. A double threshold comparator is applied on Sref : It switches the output to a high state when the input passes upward through a high threshold value ht. It then prevents switching back to the other state until the input passes through a lower threshold value lt. The comparator thus produces a TTL signal that reflects the R wave recur-rences and can be directly used for sequence triggering and for mean heart rate estimation. Note that the high and low threshold values are defined as a percentage of the Sref amplitude maximum and can be adjustable by the experimenter via a graphical interface.
Evaluation criteria
In order to achieve a quantitative evaluation of the algo-rithm performances for each wavelet, two parameters, usually employed to evaluate detection algorithms, were Overview of the extraction algorithm
Figure 4
Overview of the extraction algorithm. The contaminated ECG is decomposed into 8 scales; the reference signal is then constructed by adding together the 6th and 7th sub-bands signals. A simple trigger generates the cardiac rhythm as well as the synchronization signal. Hi-D and Hi-R are respectively the high pass decomposition filter and its associated reconstruction fil-ter. Lo-D and Lo-R represent the low pass decomposition and reconstruction filters. cDj denotes the detail coefficients, and dj
computed. The sensitivity (Se) and the positive predictive value (+P) of the present QRS detection algorithm were defined as:
where TP is the number of true positives, FN the number of false negatives, and FP the number of false positives. The sensitivity Se represents the percentage among real beats of those that were correctly detected by the algo-rithm. The positive predictive value +P reports the per-centage among beat detections of those corresponding to real beats. These two parameters can be combined into one: the Diagnostic Quality Factor (DQF) given as the geometric mean of Se and P+. Furthermore, the mean DQF (mDQF) can be computed as the arithmetical mean of a set of DQF values:
However this only gives a rough estimate of the perform-ances, since Se and P+ contribute equally in the
calcula-tion, while in fact the weight of each should vary depending on the considered application. In the case of QRS detection for cardiac MRI synchronization, the number of FP is more crucial than the FN. In fact, FP detections deteriorate the image quality because
acquisi-tions are triggered at inappropriate moments, blurring the image, whereas FN has no consequence on the image itself; the missed QRS complexes only extend the image acquisition duration. The ideal situation would be FP = FN = 0 (Se = +P = 100%) where the best image quality could be achieved in the shortest time. The purpose of this algorithm was to seek the wavelet that yields a FP value that tends to zero (+P tends to a 100%) with a minimum of FN (maximum Se) according to the applied MRI sequence.
Results
The algorithm performances were evaluated for each one of the selected wavelets using both real and simulated ECG signals. The test results for each signal type according to the applied sequence and the analyzing wavelet is pre-sented (Table 2). Wavelet performances appeared to vary with the signal type as well as with the noise nature (sequence type). The results were also averaged to attain a global view of the performances of the whole wavelet group according to every sequence (Table 3) as well as the
Se TP
TP FN =
+
( )
3+ =
+
( )
P TP
TP FP 4
mDQF
nk Sek Pk n
= ⋅ +
( )
=
∑
1
5 1
Table 3: Averaged results for each MRI sequences
mDQF Simulated Rodent
GE 98.06% 100.00%
FSE 93.86% 100.00%
IRSE 72.34% 98.87% For each sequence the Diagnostic Quality Factor is averaged over 14 wavelets
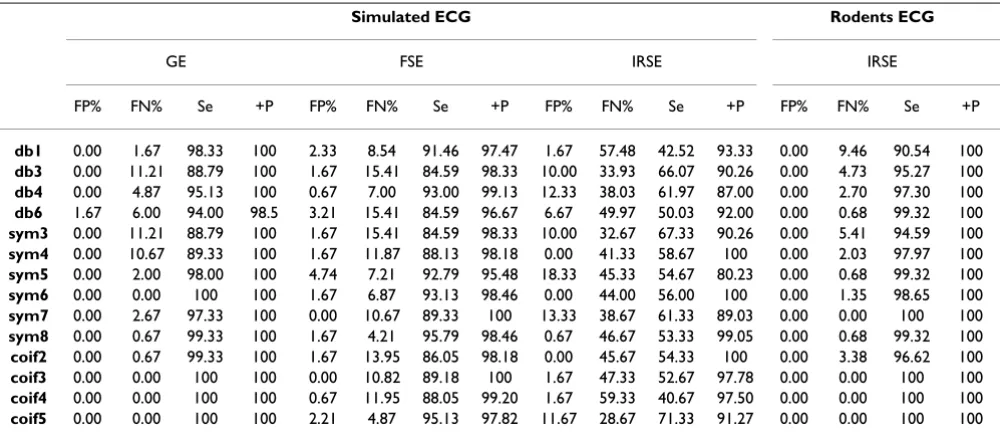
Table 2: Performance results for each of the tested wavelets according to the applied imaging sequence
Simulated ECG Rodents ECG
GE FSE IRSE IRSE
FP% FN% Se +P FP% FN% Se +P FP% FN% Se +P FP% FN% Se +P
db1 0.00 1.67 98.33 100 2.33 8.54 91.46 97.47 1.67 57.48 42.52 93.33 0.00 9.46 90.54 100
db3 0.00 11.21 88.79 100 1.67 15.41 84.59 98.33 10.00 33.93 66.07 90.26 0.00 4.73 95.27 100
db4 0.00 4.87 95.13 100 0.67 7.00 93.00 99.13 12.33 38.03 61.97 87.00 0.00 2.70 97.30 100
db6 1.67 6.00 94.00 98.5 3.21 15.41 84.59 96.67 6.67 49.97 50.03 92.00 0.00 0.68 99.32 100
sym3 0.00 11.21 88.79 100 1.67 15.41 84.59 98.33 10.00 32.67 67.33 90.26 0.00 5.41 94.59 100
sym4 0.00 10.67 89.33 100 1.67 11.87 88.13 98.18 0.00 41.33 58.67 100 0.00 2.03 97.97 100
sym5 0.00 2.00 98.00 100 4.74 7.21 92.79 95.48 18.33 45.33 54.67 80.23 0.00 0.68 99.32 100
sym6 0.00 0.00 100 100 1.67 6.87 93.13 98.46 0.00 44.00 56.00 100 0.00 1.35 98.65 100
sym7 0.00 2.67 97.33 100 0.00 10.67 89.33 100 13.33 38.67 61.33 89.03 0.00 0.00 100 100
sym8 0.00 0.67 99.33 100 1.67 4.21 95.79 98.46 0.67 46.67 53.33 99.05 0.00 0.68 99.32 100
coif2 0.00 0.67 99.33 100 1.67 13.95 86.05 98.18 0.00 45.67 54.33 100 0.00 3.38 96.62 100
coif3 0.00 0.00 100 100 0.00 10.82 89.18 100 1.67 47.33 52.67 97.78 0.00 0.00 100 100
coif4 0.00 0.00 100 100 0.67 11.95 88.05 99.20 1.67 59.33 40.67 97.50 0.00 0.00 100 100
coif5 0.00 0.00 100 100 2.21 4.87 95.13 97.82 11.67 28.67 71.33 91.27 0.00 0.00 100 100
(All values are expressed in %)
performances of each individual wavelet regardless of the sequence type (Table 4).
Simulated signals
A total of 12 simulated signals (4 signals for each of the three sequences) were processed with the proposed algo-rithm using each of the 14 analyzing wavelets. For the GE sequence, the algorithm achieved a perfect QRS detection for all ECGs. For FSE and IRSE sequences, we noticed that the heart beat frequency might affect the detection
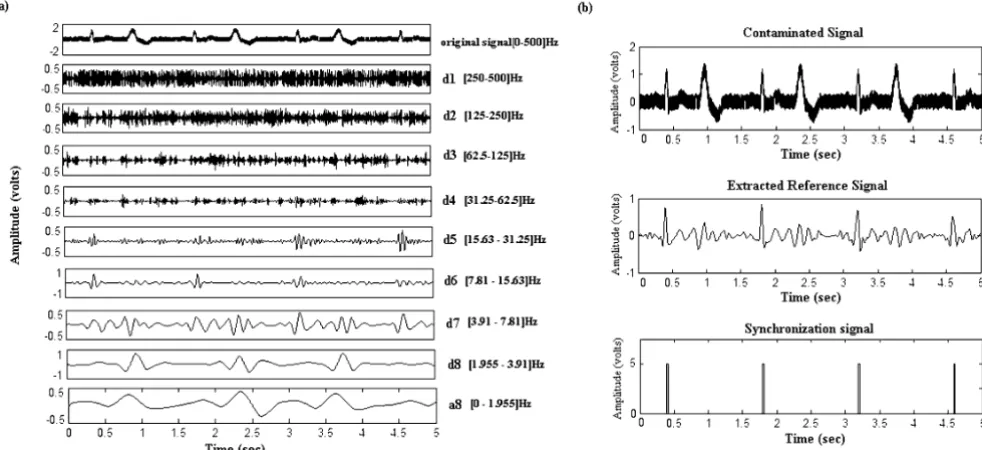
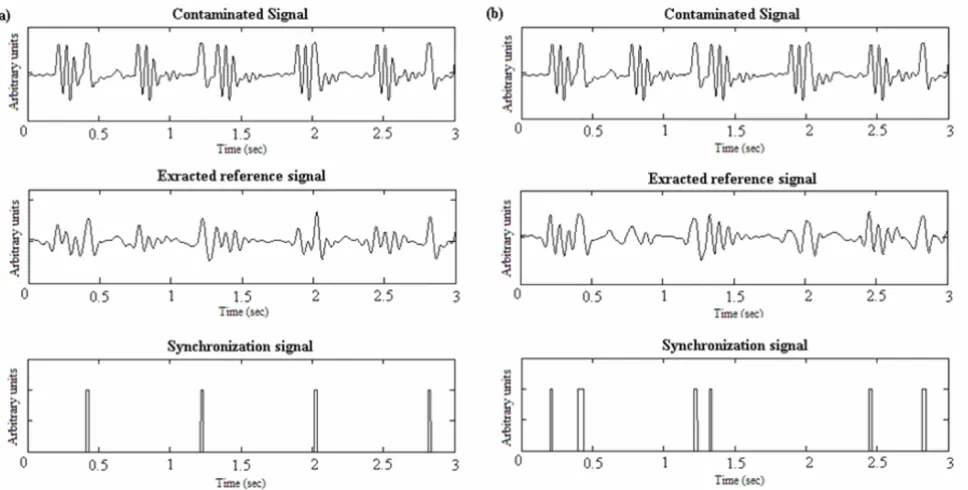
effi-ciency. In fact, when fast heart beating rates ("180 bpm") are involved, there is a higher probability that the noise generated during gradient activation time may coincide with the QRS complex, leading to confusion. On the other hand, the beat irregularity had no major effect on the per-formances. As for the "bigeminy" signals, the algorithm successfully distinguished between real QRS complexes and premature beats like illustrated in figure 5. In this example, premature beats are very prominent, but due to the fact that their energy contribution is weak in details 6 and 7, a correct QRS detection was obtained. Table 2 shows, for a given wavelet, and a given sequence, the eval-uation criteria averaged on all 4 signal types. When com-paring the wavelet performances according to the noise type, one may notice that for a given sequence, some wavelets are more efficient for processing than others (an example is given figure 6). If one considers that a proper synchronization condition is accomplished when +P presents a high value while FN is low, the following can be noted:
a) For a given wavelet, the best results are obtained for the GE sequence. For the FSE sequence, the algorithm is slightly less effective, but it is still better than the IRSE case.
b) The wavelet performances do not only depend on the noise level, but on its energy distribution as well. Despite the fact that the FSE signals have better SNR than the GE signals, the algorithm leads to lower error rates for all
Processing example of a simulated pathological ECG Figure 5
Processing example of a simulated pathological ECG. (a)Decomposition into sub-bands of a "Bigeminy" signal contami-nated by the GE sequence noise (b) Extraction of the reference and synchronization signals.
Table 4: Averaged results for each wavelet
mDQF Simulated Rodent
db1 85.52% 98.38%
db3 87.55% 99.20%
db4 88.99% 99.55%
db6 84.82% 99.89%
sym3 87.80% 99.09%
sym4 88.04% 99.66%
sym5 86.45% 99.89%
sym6 90.20% 99.77%
sym7 89.02% 100.00%
sym8 89.82% 99.89%
coif2 88.43% 99.43%
coif3 88.73% 100.00%
coif4 85.48% 100.00%
coif5 92.38% 100.00%
wavelets in the case of GE contamination. This can be explained by the fact that the noise generated by the GE sequence has relatively weak amplitude, spreading all over the signal duration; whereas the high amplitude FSE noise is concentrated in some localised parts of the signal. Which is why, despite its weaker energy, the FSE noise makes the QRS detection even harder, since its elevated peaks may be mistaken for QRS complexes.
Roughly one may conclude that it is the Coiflet family that achieves quite reliable detection. However, if we examine each sequence individually, we can define, for each, a group of the most efficient wavelets. For the GE sequence, almost all of the wavelets yielded good results. Neverthe-less, it was the sym6, coif3, coif4 and coif5 which were able to achieve a perfect detection rate. As for FSE sequence signals, we can say that processing with db4, sym6, sym7, sym8 and coif3, led to the lowest error rates. Finally, for the IRSE, sym4, sym6 and coif2 proved the superiority of their performances.
Rodent ECGs
As opposed to the simulated signals where the simulator had to be placed outside the MRI tunnel and long cables used to drive the signals inside to be contaminated, the
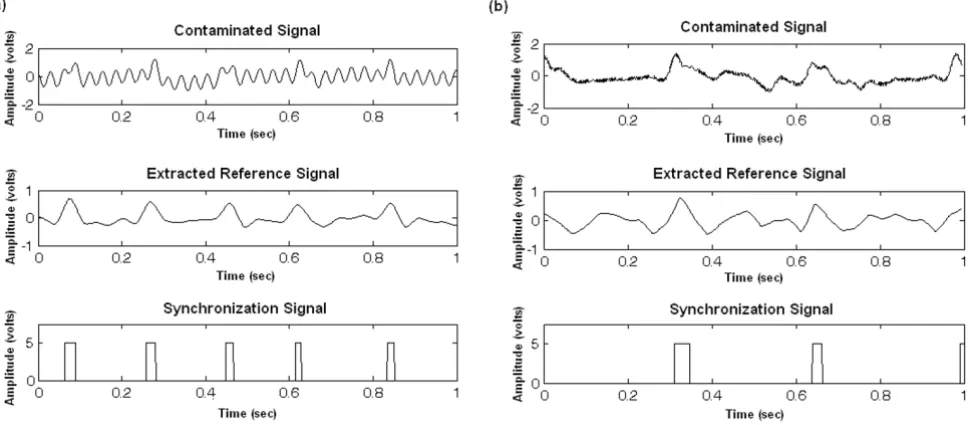
rodent ECGs were detected on the animal placed directly inside the tunnel. With this setup, the rodent signals were less contaminated than the simulated ones. However, the difficulty of synchronization in this case is due to the ani-mal's physiology resulting in weak ECG amplitude and very fast heart rate. Not to forget supplementary artefact occurrences such as respiration. Figure 7 shows two illus-trations of synchronization signal extraction from an ECG of a healthy mouse and that of a hypertensive rat. The QRS detection results on the rodent ECGs are summarized in Table 2, they show that, for signals recorded during GE and FSE sequences an ideal case of accurate detection (Se = +P = 100%) was attained. For the IRSE sequence, which is the most contaminated, the detections were less effi-cient with, however, no false detection but a few missed peaks, therefore slightly extending the image acquisition duration. The wavelets that ensured perfect detection for this sequence were the sym7, coif3, coif4 and coif5.
Discussion and conclusion
Since wavelet transform has long proven its efficiency for QRS detection in standard ECG signals, we developed a signal processing algorithm found on a wavelet-based fil-ter bank decomposition strategy, that allows the extrac-tion of an efficient reference signal from a contaminated Wavelets performances difference
Figure 6
ECG, mainly for MRI synchronization. Considering the technical aspects of the proposed algorithm, the following remarks can be made:
(i) Selection of the wavelet functions : The efficiency in extracting a given signal based on wavelet decomposition depends greatly on the choice of the wavelet function and on the number of decomposition scales [13]. In this study, a straightforward approach for wavelet selection was based on: 1°) Literature where wavelets have already been used for ECG processing. Three wavelet families Daubechies, Coiflets, Symlets were selected. 2°) Analysis of MRI sequence generated noise signals, based on the similarity between noise samples and some members of the three considered families. These two approaches resulted in an optimal group of 14 wavelets to be tested in order to define the most appropriate wavelets for each excitation sequence. Despite the fact that this selection method has produced efficient results, one may notice that it is more or less subjective.
(ii)Elaboration of a reference signal : the number of scales was fixed according to ECG spectral analysis, while considering the frequency components of the contaminat-ing artefacts. The choice of the number and levels of the details for the reference signal reconstruction was guided by the work of Thakor et al. [11]. Only the sub-bands nec-essary for cardiac synchronization (those containing the
essential part of the QRS energy) were taken into account: the complete reconstruction of the ECG signal is unneces-sary for gating applications. For an ECG sampled at 1 KHz, the decomposition process over 8 levels perfectly isolated the QRS complexes (details d6 and d7) from the undesira-ble components of the contaminated ECG, such as the NMR environment artefacts (d1 to d5), the P and T wave (d8), the baseline drift and the respiration signal (a8). The reference signal extraction was thus performed by com-bining the scales spanning over the [3.91–15.63]Hz range.
(iii) Algorithm performance : the efficiency of the pre-sented method was tested on a group of quite representa-tive signals: 1°) highly contaminated (mean SNR<-5 dB) simulated ECGs of normal and pathological heart beats, which provided a very interesting aspect for the algorithm evaluation, given that the positions of the QRS in the sig-nal were known a priori and hence could be compared to the result of the extraction algorithm. 2°) real ECG signals recorded on healthy and pathological rodents during car-diac MR imaging where the high and fast switching gradi-ents as well as animal physiology make QRS detection rather difficult.
In order to quantitavely evaluate the algorithm, two coef-ficients (+P and Se) were calculated for each wavelet and each sequence. On the basis where the highest +P and QRS detection on contaminated rodent ECG
Figure 7
lowest false detections are sought, the process turned out to be especially reliable for small animal signals. As for the simulated ECGs, despite their weak SNR, the perform-ances were quite satisfactory for both GE and FSE sequences. However, the method was less efficient in the case of the IRSE sequence, where the positive predictive value was suitable, but the false negative detections rate remained too high (>30%). This is certainly due to the particularly unfavourable contamination conditions that led to a very low SNR. As a matter of fact, the use of long cables generates supplementary artefacts in the signal which are not observable in the case of real simultaneous ECG recordings. So even though the signals were recorded during basic sequences (GE, FSE, IRSE) which contami-nate the ECG less than more complex ones, such as echo planar, the obtained noise level was somewhat compara-ble to that of sophisticated sequences.
After having computed the evaluation criteria for all sig-nals, we tried to establish which were the most efficient wavelets for each sequence: For instance, all tested coif wavelets, achieved perfect detection for the GE sequence, whereas for the FSE, it was the sym8 that produced the lowest error rates and the sym4 that yielded the most acceptable results for the IRSE.
Globally, the results produced by the whole selected wavelets set were quite acceptable, for all three considered sequences. However, later applications of the method for very complex sequences might necessitate the use of other wavelets such as the biorthogonal ones, which have already been suggested for QRS detection in extreme con-ditions and for intensive care patients [37]. The algorithm has proven to be very efficient for small rodents' signals but further research is needed to investigate whether the obtained results could be reproduced in human subjects.
In conclusion the proposed wavelet-based technique has shown to be particularly efficient in extracting a good quality reference signal for synchronization during MRI examination. Given the fact that only the details essential for synchronisation are used for the signal reconstruction, both low and high frequency artefacts are correctly removed; the synchronization problem caused by base-line wandering is thus solved. The highest degree of accu-racy of our algorithm was obtained when wavelet functions deduced from noise analysis were used to decompose the contaminated ECG. In an upcoming paper we intend to investigate the real-time implementation of the method, indispensable for the use in cardiac MRI applications.
Authors' contributions
DA and OF conceived the method, implemented the algo-rithm and drafted the manuscript. EC and LB participated
in the signal acquisitions. ABr carried out work coordina-tion and manuscript revision. ABa provided pathological animal models. All authors read and approved the final manuscript.
Acknowledgements
This work was supported in part by the Centre National de la Recherche Scientifique (projet CNRS IPA 2003) and by the Ministry of Industry France (RNTS 2003). The authors would like to thank Pr. J. Felblinger for useful technical discussions.
References
1. Felblinger J, Lehmann C, Boesch C: Electrocardiogram acquisi-tion during MR examinaacquisi-tions for patient monitoring and sequence triggering. Magnetic Resonance in Medicine 1994, 32:523-529.
2. Laudon MK, Webster JG, Frayne R, Grist TM: Minimizing Interfer-ence from Magnetic Resonance Imagers During Electrocar-diography. IEEE Transactions on Biomedical Engineering 1998, 45(2):160-164.
3. Felblinger J, Slotboom J, Kreis R, Jung B, Boesch C: Restoration of Electrophysiological Signals Distorted by Inductive Effects of Magnetic Field Gradients during MR Sequences. Magnetic Res-onance in Medicine 1999, 41:715-721.
4. Fischer SE, Wickline SA, Lorenz CH: Novel Real-Time R-Wave Detection Algorithm Based on the Vectorcardiogram for Accurate Gated Magnetic Resonance Acquisitions. Magnetic Resonance in Medicine 1999, 42:361-370.
5. Wiesmann F, Szimtenings M, Frydrychowicz A, Illinger R, Hunecke A, Rommel E, Neubauer S, Haase A: High-Resolution MRI With Cardiac and Respiratory, Gating Allows for Accurate In Vivo Atherosclerotic Plaque Visualization in the Murine Aortic Arch. Magnetic Resonance in Medicine 2003, 50:69-74.
6. Cassidy P, Schneider J, Grieve S, Lygate C, Neubauer S, Clarke K: Assessment of Motion Gating Strategies for Mouse, Mag-netic Resonance at High MagMag-netic Fields. Journal of Magnetic Resonance Imaging 2004, 19:229-237.
7. Kadambe S, Murray R, Boudreaux-Bartels GF: Wavelet transform-based QRS complex detector. IEEE Transactions on Biomedical Engineering 1999, 46(7):838-48.
8. Li C, Zheng C, Tai C: Detection of ECG characteristic points using wavelet transforms. IEEE Engineering in Medicine and Biology
1995, 42(14):21-28.
9. Lu Z, Kim DY, Pearlman WA: Wavelet compression of ECG sig-nals by the set partitioning in hierarchical trees algorithm.
IEEE Transactions on Biomedical Engineering 2000, 47(7):849-56. 10. Martínez JP, Almeida R, Olmos S: A Wavelet-Based ECG
Deline-ator: Evaluation on Standard Databases. IEEE Transactions on Biomedical Engineering 2004, 51(4):570-580.
11. Thakor NV, Webster JG, Tompkins WJ: Estimation of QRS Com-plex Power Spectra for Design of a QRS Filter. IEEE Transac-tions on Biomedical Engineering 1984, 31(11):702-706.
12. Afonso VX, Tompkins WJ, Nguyen TQ, Luo S: ECG Beat Detec-tion Using Filter Banks. IEEE Transactions on Biomedical Engineering
1999, 46(2):192-202.
13. Tewfik AH, Sinha D, Jorgensen P: On the optimal choice of a wavelet for signal representation. IEEE Transactions on Informa-tion Theory 1992, 38(2):747-765.
14. Erçelebi E: Electrocardiogram signals de-noising using lifting-based discrete wavelet transform. Computers in Biology and Med-icine 2004, 34(6):479-93.
15. Agante PM, Marques de SAJP: ECG Noise Filtering Using Wave-lets with Soft-thresholding Methods. IEEE Computers in Cardiol-ogy 1999, 26:535-538.
16. Cuesta Frau D, Novak D, Eck V, Pérez Cortés JC, Andreu García G: Electrocardiogram Baseline Removal Using Wavelet Approximations. Proceeding of the 15th Biennial Eurasip Conference BIOSIGNAL 2000:136-138.
17. Saxena SC, Kumar V, Hamde ST: Feature extraction from ECG signals using wavelet transforms for disease diagnostics.
Publish with BioMed Central and every scientist can read your work free of charge "BioMed Central will be the most significant development for disseminating the results of biomedical researc h in our lifetime."
Sir Paul Nurse, Cancer Research UK
Your research papers will be:
available free of charge to the entire biomedical community
peer reviewed and published immediately upon acceptance
cited in PubMed and archived on PubMed Central
yours — you keep the copyright
Submit your manuscript here:
http://www.biomedcentral.com/info/publishing_adv.asp
BioMedcentral 18. Chen J, Itoh S: A wavelet Transform-Based ECG Compression,
Method Guaranteeing Desired signal Quality. IEEE Transac-tions on Biomedical Engineering 1999, 45(12):1414-1419.
19. Istepanian R, Hadjileontiadis L, Panas S: ECG Data Compression Using Wavelets and Higher Order Statistics Methods. IEEE Transactions on Information Technology in Biomedicine 2001, 5(2):108-115.
20. Istepanian R, Petrosian A: Optimal Zonal Wavelet-Based ECG Data Compression for a Mobile Telecardiology System. IEEE Transactions on Information Technology in Biomedicine 2000, 4(3):200-211.
21. Alesanco A, Olmos S, Istepanian R, Garcia J: A novel real-time multilead ECG compression and de-noising method based on the wavelet transform. Computers in Cardiology 2003, 30:593-596.
22. Rajoub BA: An efficient coding algorithm for the compression of ECG signals using the wavelet transform. IEEE Transactions on Biomedical Engineering 2003, 50(8):1034-1037.
23. Khadra L, Al-Fahoum AS, Al-Nashash H: Detection of life-threat-ening cardiac arrhythmias using the wavelet transformation.
Medical and Biological Engineering and Computing 1997, 35(6):626-632. 24. Al-Fahoum AS, Howitt I: Combined wavelet transformation and radial neural networks for classifying life-threatening cardiac arrhythmias. Medical and Biological Engineering and Computing 1999, 37:566-573.
25. Cherkassky V, Kilts S: Myopotential denoising of ECG signals using wavelet thresholding methods. Neural Networks 2001, 14(8):1129-1137.
26. Akay M, Szeto HH: Investigating the relationship between foe-tus EEG, respiratory, and blood pressure signals during mat-uration using wavelet transform. Annals of Biomedical Engineering
1995, 23:574-592.
27. Fokapu O, Chahboune HP, Desgoutte R, Cespuglio R, Briguet A: Denoising EMG and EEG for monitoring small animal mod-els during NMR experiments. In Proceedings – 23rd Annual Confer-ence IEEE/EMBS Oct. 25–28 Istanbul, Turkey; 2001.
28. Adeli H, Zhou Z, Dadmehr N: Analysis of EEG records in an epi-leptic patient using wavelet transform. Journal of Neuroscience Methods 2003, 23(1):69-87.
29. Cárdenas-Barrera J, Lorenzo-Ginori J, Rodríguez-Valdivia E: A wave-let-packets based algorithm for EEG signal compression.
Medical Informatics and the Internet in Medicine 2004, 29(1):15-27. 30. Leman H, Marque C: Rejection of the maternal
electrocardio-gram in the electrohysteroelectrocardio-gram signal. IEEE Transactions on Bio-medical Engineering 2002, 49(4):355-362.
31. Mochimaru F, Fujimoto Y: Detecting the Fetal Electrocardio-gram by Wavelet Theory-Based Methods. Progress in Biomedical Research 2002, 7(3):185-193.
32. Pattichis CS, Pattichis MS: Time-Scale Analysis of motor unit action potentials. IEEE Transactions on Biomedical Engineering 1999, 46(11):1320-29.
33. Wang SY, Liu X, Yianni J, Aziz T, Stein J: Extracting burst and tonic components from surface electromyograms in dystonia using adaptive wavelet shrinkage. Journal of Neuroscience Meth-ods 2004, 139:177-184.
34. Zennaro D, Wellig P, Koch VM, Moschytz GS, Läubli T: A software package for the decomposition of long-term multichannel EMG signals using wavelet coefficient. IEEE Transactions on Bio-medical Engineering 2003, 50:58-69.
35. Mallat S: A theory for multiresolution signal decomposition: the wavelet representation. IEEE Transactions on Pattern Recogni-tion and Machine Intelligence 1989, 11(17):674-693.
36. Vetterli M, Kovacevic J: Wavelets and subband Coding Englewood Cliffs, NJ, Prentice-Hall; 1995.
37. Sivannarayana N, Reddy DC: Biorthogonal wavelet transforms for ECG parameters estimation. Medical Engineering and Physics