Vol.7 (2017) No. 1
ISSN: 2088-5334
Optimizing Utilization of Palm Oil Mill Effluent and its Influences
on Nutrient Availability and Soil Organic Matter on Ultisols
Hermansah
#, Ermadani
*, Yulnafatmawita
#, Auzar Syarif
1and Bujang Rusman
##
Department of Soil Science, Faculty of Agriculture, Andalas University, Padang, Indonesia E-mail: [email protected]; [email protected]; [email protected]
* Graduate Program of Agricultural Sciences, Andalas University, Padang , Indonesia E-mail: [email protected]
1
Department of Agronomy, Faculty of Agriculture, Andalas University, Padang, Indonesia E-mail: [email protected]
Abstract— Optimizing the utilization of agroindustrial organic waste such as palm oil mill effluent (POME) can prevent environment
pollution and soil nutrient cycling can be a valuable alternative to improve soil quality. The objective of this study was to evaluate the changes of soil organic fractions and nutrients after application of treated palm oil mill effluent. The treatments consisted of control and effluent application at rates of 5, 10, 15 and 20 ton ha-1. The treatments were arranged in a completely randomized design with three replications. Application of effluent significantly increased total organic C, labile organic C, humic acid C, pH, total N, available P, and exchangeable K. A significant reduction of exchangeable Al also occurred with effluent application. The increases of total organic C and labile organic were found with the application of 20 t ha-1 of effluent, but the increase was not significant compared to the effluent application at rates of 10 and 15 t ha-1. Sensitivity indexes of total organic C, labile organic C and humic acid C following effluent application were 24-66%, 103-197% and 95-114% respectively in which labile organic C showed the highest sensitivity index. Total organic C, labile organic C and humic acid were positively correlated with increasing rates of effluent application. Labile organic C revealed the strongest relationship (R2=0.91) with effluent application compared to total organic C (R2=0.88) and humic acid (R2=0.67). A significant increase of total N was only found by the effluent application at rate of 20 t ha-1. Significant increases in available P and exchangeable K occurred at rate of 10, 15 and 20 t ha-1. It can be concluded that the increase
in soil organic carbon levels was related to the amount of organic (effluent) input added to the soil. In addition, the application of treated effluent can improve soil pH and nutrient availability.
Keywords— effluent; optimizing; utilization; soil organic carbon; labile organic carbon; nutrient
I. INTRODUCTION
Soil has an important role in the storage of organic carbon (C). Changes in land use from natural forest into agricultural lands and other uses have resulted in a substantial loss of soil organic carbon (SOC) [1]. In the tropics, deforestations and conversion of natural vegetation into the cropland are the main causes of SOC loss [2]. Continuous decrease in SOC can lead to a great deterioration of soil function [3]. Soil functions and plant nutrient availability are strongly affected by organic matter [4]
The content of SOC is affected by a balance between C input and the loss through decomposition, erosion and leaching [5]. In general, organic matter input to the soil is evaluated by the change of total soil organic C. However, change in total SOC frequently shows low sensitivity to
organic input. Labile organic C fraction constitutes a sensitive indicator on changes of soil quality [6],[7]. Small changes of labile C fraction could provide initial indication of soil degradation and improvement in management practices [6]. The labile fraction of organic C is very important in relation to crop production in which this fraction constitutes energy source of food web in soil so that it affects nutrient cycle to maintain soil quality and productivity [8]. Beside of labile fraction, soil organic C consists of stabile fraction such as humic acid formed through biochemical and chemical stabilization [9].
is palm oil mill effluent (POME) which is produced from processing fresh fruit bunch into crude palm oil (CPO). Each ton of fresh fruit bunch processed produces 0.5 t to 0.75 t of effluent [10]. It is acid (pH of 3.5-4.7) and has high biological oxygen demand (BOD) (25000-25545 mg L
-1 ) and chemical oxygen demand (COD) (51000-55755 mg
L-1 [11], [12]. When it is discharged immediately without good management, it can pollute soil, water body and destroy water biota [13]; [14]. With such characteristics, before being applied to the soil, the effluent has to be treated. The low pH should be increased and the high content of fresh organic matters as shown by high BOD and COD should be decomposed. Study carried out by Nwoko and Ogunyemi [15] used sodium hidroxide (NaOH) to increase pH and urea as N source for decomposition. However, applying soil materials containing Na in large amount could result in salinisation and inhibit plant growth [16]. Mineralization of soil organic matter could also be hindered by salinity [17]. Therefore, other materials are needed to treat raw effluent before being applied to the land. Calcite (CaCO3) has been used to improve soil pH. With such
characteristic, calcite is one of materials that can be used to ameliorate pH of acid effluent. As a source of N for decomposition, chicken manure can be used. Kolade et al., [18] reported that composting solid waste of palm kernel oil with chicken manure with ratio 3: 1 produced good compost. The study was aimed (i) to evaluate the impact of effluent on soil organic C fractions and some soil chemical properties and (ii) to asess relationship between soil organic C fractions and soil nutrients.
II. MATERIALS AND METHOD
A pot experiment was conducted in the greenhouse at Agricultural Research Station, Faculty of Agriculture, Jambi University, Indonesia from June to December 2014. The soil used in this study was Ultisol and taken from Mendalo Darat Village, Muaro jambi Regency Jambi Province (1030 32’ 19,17” BT; 010 36” 17,76” LS) in which the land was previously secondary forest and currently has been dominated by grassland (Imperata cylindrica) after deforestation more than 20 years ago. The soil was characterized by loam (texture), low pH (4.4), total organic C (1.27), total nitrogen (N) (0.086%), Bray 1 available phosphorus (P) (7.83 ppm) and exchangeable kalium (K) (0.057 cmol kg-1) (Table 1).
TABLEI
THE PHYSICOCHEMICAL ANALYSES OF SOIL BEFORE APPLICATION OF TREATED EFFLUENT
Parameter Unit Value
pH 4.40
Organic C % 1.27
Total N % 0.086
Available P ppm 7.83
Exchangeable-K cmol kg-1 0.057
CEC cmol kg-1 4.65
Exchangeable-Al cmol kg-1 1.95
Sand % 43.30
Silt % 31.44
Clay % 25.26
Class Loam
Fresh effluent was obtained from a palm oil mill of Bahari Gembira Ria Limited located in Ladang Panjang Village, Muaro Jambi Regency, Jambi Province, Indonesia. Fresh effluent was characterized by low pH (4.34 and high BOD (26580 mg L-1) and COD (55780 mg L-1) (Table 2). The characteristics of chicken manure were characterized for pH, total C, total N, total P and total K (Table 3).
TABLEII
PROPERTIES OF FRESH EFFLUENT
Parameter Unit Value
pH mg/L 4.34
BOD mg/L 26580
COD mg/L 55780
Total solid mg/L 47380
Total N mg/L 704
Total P mg/L 98.5
Total K mg/L 1127.5
Oil and grease mg/L 384
TABLEIII
PROPERTIES OF CHICKEN MANURE
Parameter Unit Value
pH 6.99
Total organic C % 19.49
Total P % 0.96
Total K % 1.58
Total N % 1.60
C/N 12.18
Water content % 28
Fresh effluent was added with calcite (CaCO3) at ratio
10:1 (volume/weight) and chicken manure at ratio 3:1 (volume/weight) and mixed manually everyday to improve aeration and decomposition. After 4 weeks, sample analysis showed that the charactersitics of effluent were pH 6.83, 1.85% nitrogen (N), 12.53% total organic C, 0.97% phosphorous (P) and 1.32% potassium (K) (Table 4).
TABLEIV
PROPERTIES OF TREATED EFFLUENT
Parameter Unit Value
pH 6.83
Total organic C % 12.53
Total N % 1.85
Total P % 0.97
Total K % 1.32
C/N 6.77
Water content % 81
Soil samples were taken from 0–20 cm depth. The soil samples were air-dried and passed through a 2-mm sieve. Each pot (26.5 cm height, 31 cm diameter) was filled with 10 kg of soil (oven dry weight). Measurements of water content of soil, chiken manure and treated effluent were based on oven-dried at 1050 C for 24 hours). Treated effluent was applied at 0 (control, no effluent), 5 ton ha-1, 10 t ha-1, 15 t ha-1 and 20 t ha-1. The treatments were replicated three times. Soils were wetted and kept at 80% (w/w) of water-holding capacity. Water content was corrected gravimetrically every 2 days. Pots were incubated for two weeks in a glasshouse. After two weeks incubation, soil samples were collected for analyses to determine pH H2O
(NH4Ac 1 M, pH 7), CEC (NH4Ac 1 M, pH 7),
exchangeable Al (KCl 1M).
Analysis of variance (ANOVA) was conducted to test for differences in soil total organic C, labile organic C, humic acid C, pH, total N, available P, exchangeable K, exchangeable Al, and CEC among different levels of effluent application and means were tested by Duncan multiple range test at 5% . Linear regression was used to determine the correlation between soil organic C fractions and other soil chemical properties. All statistical analyses were carried out using Microsoft Excel and differences were declared significant at the 0.05 level. In addition, sensitivity index (SI) of organic C fractions was determined by using a formula of Banger et al. [20] namely SI = (C fraction in effluent treatment - C fraction in control)/ C fraction in control
III.RESULTS AND DISCUSSION
In comparison with control the application of effluent significantly increased total organic C, labile organic C and humic acid C (Table 5). The application of effluent at rate of 5 t ha-1 showed significant increases on total organic C, labile organic and humic acid C compared to control. The diferences between 10 ha-1, 15 t ha-1 and 20 t ha-1 of effluent application on total organic C and humic acid C were not statsically significant different.
TABLEV
EFFECT OF TREATED EFFLUENT APPLICATION ON TOTAL ORGANIC C,
LABILE ORGANIC C AND HUMIC ACID C
Treatments
Total Organic C
Labile organic
C Humic acid C
% mg kg-1 g kg-1
Control 1.41 c 123.21 d 1.34 c 5 t ha-1 1.75 b 249.86 c 2.61 b 10 t ha-1 2.11 a 287.77 bc 2.69 ab 15 t ha-1 2.08 ab 340.20 ab 2.93 a 20 t ha-1 2.24 a 366.10 a 2.87 ab Numbers in each column followed by the same letter are not significantly different at the P < 0.05 by the Duncan’s multiple range test.
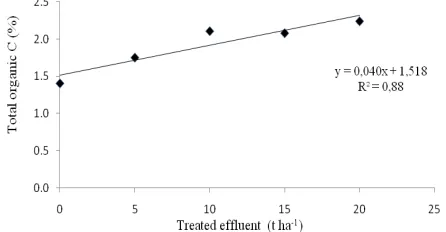
Labile organic C showed a higher sensitivity compared to total organic C and stabile organic C in which sensitivity indexes of total organic C, labile organic C and stabile organic C were 24-66%, 103-197% and 95-114% respectively (Figure 1). The application of effluent showed positive correlations with organic C fractions in which labile organic C fraction (R2=0,91) had higher correlation compared to total organic C (R2=0,88) and humic acid C (R2=0,65) (Figure 2, Figure 2 and Figure 3).
The application of effluent significantly increased soil pH, total N, available P and exchangeable K, while exchangeable Al was significantly reduced by application of effluent (Table 6). However, the application of effluent did not show significant difference on CEC. The application of 20 t ha-1 effluent showed significant increases on pH, total N, available P, exchangeable K compared to control. In general the highest values for soil pH, total N, available P were found by the application of 20 t ha-1 effluent. Eventhough, the diferences in CEC were not stastically signifcant, it showed an inreasing trend with increasing rates of effluent application.
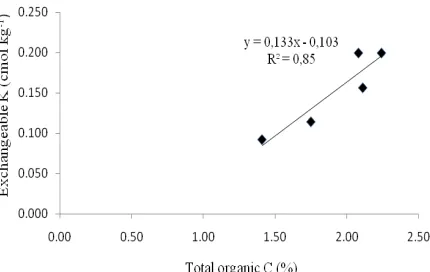
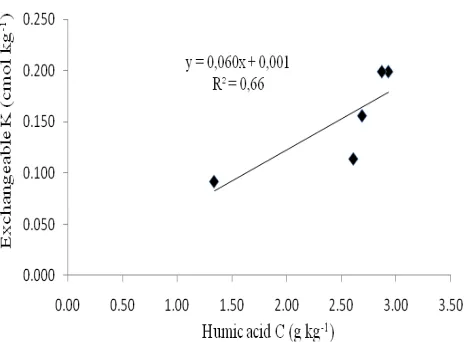
Soil nutrients were positively correlated to total organic C, labile organic C and humic acid C. Among organic C fractions, labile organic C had stronger correlation with soil total N (R2=0,68, and exchangeable K (R2=0,93), while with available P, total organic C and labile organic C had similar correlation rate.
Fig. 1. Sensitivity index of total organic C, labile organic C and humic acid C following effluent application
Fig. 2. Relationship between treated effluent application and total organic C
Fig.3. Relationship between treated effluent application and labile organic C
TABLEVI
EFFECT OF TREATED EFFLUENT APPLICATION ON PH, TOTAL N,
AVAILABLE P, EXCHANGEABLE K, EXCHANGEABLE AL AND CEC
Numbers in each column followed by the same letter are not significantly different at the P < 0.05 by the Duncan’s multiple range test.
Fig. 5. Relationship between total organic C and total N
Fig. 6. Relationship between labile organic C and total N
Fig. 7. Relationship between humic acid C and total N
Fig. 8. Relationship between total organic C and available P
Fig. 9. Relationship between labile organic C and available P
Fig. 10. Relationship between humic acid C and available P
Fig. 11. Relationship between total organic C and exchangeable K Treatme
nts pH
Total N Avai-P Exch-K Exch-Al CEC
% ppm cmol kg
-1 cmol kg-1 cmol kg-1
control 4.54 c
0.13 b
8,08 b
0.09 c
1.92 a
4.76 a
5 t ha-1 4.97 b
0.13 b
9,29 b
0.11 bc
1.09 b
5.01 a
10 t ha-1 4.96 b
0.13 b
11,05 a
0.16 ab
0.78 c
5.39 a
15 t ha-1 5.05 ab
0.14 b
12,03 a
0.20 a
0.68 c
5.90 a
20 t ha-1 5.15 a
0.15 a
12,07 a
0.20 a
0.68 c
Fig. 12. Relationship between labile organic C and exchangeable K
Fig. 13. Relationship between humic acid C and exchangeable K
Enhancement of soil organic C as a result of increased dosages of treated effluent application showed that organic matter input was higher than organic matter loss. Morra et al.[21] also reported that soil organic C increased with increasing compost application in which compost application of 15 t ha-1, 30 t ha-1 and 45 t ha-1 resulted in 2.50%, 2.95% and 3.2% of SOC respectively. Application of 52 t ha-1 of liquid sheep manure during 10 years with ten times frequency produced 608 mg kg-1 of C labile, while application of 26 t ha-1 and 22 t ha-1 during 10 years with 5 times frequency chicken manure resulted in 532 mg kg-1 and 542 mg kg-1 [22].
Labile organic C fraction is related to nutrient availability that comes from soil organic matter mineralization [23]. Labile organic C correlates directly to mineralization of C and N [24]. Mineralization of soil organic matter is caused by soil microbial activiy and labile organic C has a positive correlation with microbial biomass C [6], [7]. Labile C controls the availability of N, limits N loss due to leaching and role as substrate for heterotrophic metabolism and N immobilization [25]. Increasing humic acid has implication with stabile C fraction and represents an important indicator to C sequestration in soil [26], [9].
Labile organic C showed a higher sensitivity than total organic C and humic acid C following the application of effluent (Figure 1). This sensitivity of labile organic C shows a better indicator of change in C after application of fertilizers and /or manures [20].
The increased pH following effluent application is in agreement with [27] who found that compost increased pH
by ammonification in which H+ ions are consumed or OH- ions are released during conversion of organic N compounds into NH4+ ions [28].
Although CEC did not show significant differences, values of CEC showed an increasing trend. Humification process results in functional groups which can increase CEC [29]. Humic acid can form complex with Al that can reduces Al concentration in soil [30]. Adsorption of Al by decomposed organic matters also tends to reduce exchangeable Al concentration [31]. A study done by Patiram [32] found that chicken manure application reduced exchangeable Al during 75 days application, but its concentration increased as time and its concentration became similar after 300 and 500 days incubation. Exchangeable Al and soluble Al were decreased because of formation of Al-organic complex by organic matter accumulation [33].
Enhancement of soil N, P and K was caused by input of N, P and K originated from effluent. Organic matters contain nutrients such as N, P and K so that decomposition of organic matters releases N, P and K to the soil [34].
Soil was used for this study are deeply weathered, red-colored soils which form from various types of parent material along with leching of bases and clays from the surface soils and their accumulation in the subsoils as a result of intensive chemical weathering of rocks and minerals under tropical humid climate.
Thus, Ultisols generally show a strongly acidic reaction with high acidity and low contents of exchangeable bases and available . These characteristics typical to Ultisols were all seen in the cultural soil used for this study. The application of treated POME greatly improved fertility characteristics of soil quality through neutralization of soil pH and elimination of soil acidity as well as provision of plant nutrients such as P, K, Ca and Mg. Both elevation in soil pH and the increment in content of soil organic matter would contribute to the enhancement of soil CEC which can reduce soil Al toxicity due to increased buffering capacity against acidification. Ultisoils are dominated by 1:1 type phyllosilicate clay minerals such as kaolins and free Fe/Al oxyhydoxides, and thus have pH-dependent negative electric charges, which are generated on the surface of soil colloids by the dissociation of H+ from hydroxyl groups and increase with increasing soil pH.
Original POME often shows strongly acidic
characteristics; and thus its use in agricultural sector has been restricted to oil palm farms because it may exacerbate soil acidity problems regardless of its potential as fertilizer. In addition, original POME is in a liquid state; and it is not easy for farmers to transport/handle it. These natures of POME exhibit major constraints for its use for increasing soil quality and crop production.
IV.CONCLUSIONS
shown by labile organic C than total organic C and humic acid C. Enhancement of stable organic C could represent the potential of C sequestration in soil. The use of organic amendment derived from palm oil mill effluent can be a suitable choice to improve SOC, especially in soils with low organic C.
ACKNOWLEDGMENT
We would like to thank Indonesian Ministry for Research, Technology and Higher Degree of Education for the Funding. And We thank Andalas University Research and Community Services Institue for the supporting of administration of this study.
REFERENCES
[1] Yonekura, Y., S. Ohta, Y. Kiyono, D. Aksa, K. Morisada, N. Tanaka and I. Tayasu. 2013. Soil organic matter dynamics in density and particle-size fractions following destruction of tropical rainforest and the subsequent establishment of Imperata grassland in Indonesian Borneo using stable carbon isotopes. Plant Soil 372:683– 699.
[2] Don, A., J. Schumacher, and A. Freibauer. 2011. Impact of tropical land-use change on soil organic carbon stocks — a meta-analysis. Global Change Biology 17 (4), 1658–1670.
[3] Lal, R. 2012. Climate Change and Soil Degradation Mitigation by Sustainable Management of Soils and Other Natural Resources. Agric Res 1(3):199–212.
[4] A.McCauley, C. Jones, and J. Jacobsen. 2009. Soil pH and Organic Matter. Nutrient Management Module No. 8. MSU Extension Publications P.O. Box 172040 Bozeman, MT 59717-2040.
[5] Chirinda, N., J. E. Olesen and J. R. Porter. 2012. Root carbon input in organic and inorganic fertilizer-based systems. Plant Soil 359:321– 333.
[6] Weil, R.W., K.R. Islam, M. Stine., J.B. Gruver and S.E. Samson- Liebig. 2003. Estimating active carbon for soil quality assessment: a simplified method for laboratory and field use. American Journal of Alternative Agriculture 18:3–17.
[7] Culman, S. W. , S. S. Snapp, M. A. Freeman, M. E. Schipanski, M. E. Schipanski, J. Beniston, R. Lal., L. E. Drinkwater., A. J. Franzluebbers, J. D. Glover, A. S. Grandy, J. Lee, J. Six, J. E. Maul, S. B. Mirksy, J. T. Spargo and M.M. Wander. 2012. Permanganate oxidizable carbon reflects a processed soil fraction that is sensitive to management. Soil Sci. Soc. Am. J. 76:494–504.
[8] Majumder, B., B. Mandal, P. K. Bandyopadhyay, A. Gangopadhyay, P. K. Mani, A. L. Kundu and D. Mazumdar. 2008. Organic Amendments Infl uence Soil Organic Carbon Pools and Rice–Wheat Productivity. Soil Sci. Soc. Am. J. 72:775–785.
[9] Serramiá N.,, M.A. Sánchez-Monedero, A. Roig, M. Contin and M. De Nobili. 2013. Changes in soil humic pools after soil application of two-phase olive mill waste compost. Geoderma 192:21–30. [10] Yacob, S., M.A. Hassan, Y. Shirai, M. Wakisaka, S. Subash. 2005.
Baseline study of methane emission from open digesting tanks of palm oil mill effl uent treatment. Chemosphere 59:1575-1581. [11] Ma, A.N. 2000. Environmental management for the palm oil industry.
Palm Oil Dev. 30:1–10.
[12] Vijayaraghavan, K., D. Ahmad and M.E. Abdul Aziz. 2007. Aerobic treatment of palm oil mill effluent. J. Environ. Manage. 82, 24-31. [13] Singh, R.P., A. Embrandiri, M.H. Ibrahim and N. Esa. 2011.
Management of biomass residues generated from palm oil mill vermicomposting a sustainable option, resources. Conserv Recycling 55:423–434.
[14] Fulazzaky, M.A. 2013.Calculation of the release of total organic matter and total mineral using the hydrodynamic equations applied to palm oil mill effluent treatment by cascaded anaerobic ponds. Bioprocess Biosyst Eng. 36:11–21.
[15] Nwoko and Ogunyemi, 2010. Evaluation of pal oil ill effluen to maize (Zea as.L) croo.,yields, tissue nutrieny content and residualsoil chemical properties. Australian Journal of Crop Science. 4(1):16-22 [16] Ndakidemi, P.A and J.H.J.R.Makoi, 2009. Effect of NaCl on
productivit of four selected common bean cultivars (Phaseolus vulgaris L.). Scientific Reserach aand Essa. 4(10):1066-1072. [17] Tripathi S, S. Kumari, A. Chakraborty, A. Gupta, K. Chakrabarti and
B.K. Bandyapadhyay. 2006. Microbial biomass and its activities in salt-affected coastal soils. Biol Fertil Soils. 42:273-277.
[18] Kolade O.O., A.O. Coker, M.K.C. Sridhar and G.O. Adeoye. 2006. Palm kernel waste management through composting and crop production. J Environ Health Res UK 5(2):81–85.
[19] Tan, K.H. 1996. Soil Sampling, Preparation and Analysis. Marcel Dekker Inc. New York.
[20] Banger, K., G. S. Toor, A. Biswas, S. S. Sidhu and K. Sudhir. 2010. Soil organic carbon fractions after 16-years of applications. of fertilizers and organic manure in a Typic Rhodalfs in semi-arid tropics. Nutr Cycl Agroecosyst , 86:391–399.
[21] Morra, L., L. Pagano, P. Iovieno, D. Baldantoni dan A. Alfani. 2010. Soil and vegetable crop response to addition of different levels of municipal waste compost under Mediterranean greenhouse conditions. Agron. Sustain. Dev. 30: 701–709.
[22] Mirsky, S.B., L. E. Lanyon and B. A. Needelman. 2005. Evaluating soil management using particulate and chemically labile soil organic matter fractions. Soil Sci. Soc. Am. J. 72:180-185.
[23] Blair, G.J., A. Conteh and R.D.B. Lefroy. 1995b. Fate of organic matter and nutrients in upland agricultural systems. In: Lefroy, R.D.B., G.J Blair, E.T. Craswell, (Eds.), Soil Organic Matter Management for Sustainable Agriculture, ACIAR Proceedings No. 56, Ubon, Thailand, August 24-26, 1994. ACIAR, Canberra, Australia, pp. 41-49.
[24] Gunapala, N. and K.M. Scow. 1998. Dynamics of soil microbial biomass and activity in conventional and organic farming systems. Soil Biol. Biochem. 30:805–816.
[25] Kaye, J.P., D. Binkley, X.M. Zou, and J.A. Parrotta. 2002. Non-labile soil 15nitrogen retention beneath three tree species in a tropical plantation. Soil Sci. Soc. Am. J. 66:612–619.
[26] Ghabbour, E.A. , G. Davies, J. L. Daggett, Jr., C.A., Worgul, G. A. Wyant and Mir-M. Sayedbagheri. 2012. Measuring the humic acids content of commercial lignites and agricultural top soils in the national soil project. Annals of Environmental Science, 6: 1-12. [27] Bolan, N.S., and M.J. Hedley. 2003. Role of carbon, nitrogen and
sulfur cycles in soil acidification. In: Rengel Z (ed) Handbook of soil acidity. Marcel Dekker AG, New York, pp 29–56.
[28] Bolan N.S., A.A.Szogi, T. Chusasavathi, B. Seshadri, .J. Rohthrock Jr. And P.Panneerselvam. 2010 Uses and management of poukt litter. Orlds Polutr Sceience Journal, 66:673-698.
[29] Bernal, M.P., M.A. Sanchez-Monedero, C. Paredes and A. Roig. 1998. Carbon mineralization from organic wastes at different composting stages during their incubation with soil. Agr. Ecosyst. Environ. 69: 175–189.
[30] Wong, M.T.F., E. Akyeampong, S. Nortcliff, M.R. Rao and R.S. Swift. 1995. Initial responses of maize and beans to decreased concentrations of monomeric inorganic aluminium with application of manure or tree prunings to an Oxisol in Burund. Plant Soil 171: 275–282.
[31] Hoyt, P.B. and R.C. Turner. 1975. Effects of organic materials added to very acid soils on pH, aluminium, exchangeable NH4 and crop yields. Soil Sci. 119: 227–237.
[32] Patiram, R. 1996. Effect of limestone and farmyard manure on crop yields and soil acidity on an acid Inceptisol in Sikkim, India. Trop Agric 73: 238–241.
[33] Haynes, R.J. and M.S. Mokolobate. 2001. Amelioration of Al toxicity and P deficiency in acid soils by additions of organic residues: a critical review of the phenomenon and the mechanisms involved. Nutrient Cycling in Agroecosystems 59: 47–63.