ISSN 0975-928X
Research Note
Correlation and path analyses in Maize (
Zea mays
L.)
Udaya Bhanu Kote, P. V. Rama Kumar, M. Lal Ahamed, Y. Ashoka Rani1, V. Srinivasa Rao2 and D Adilakshmi3
Department of Genetics and Plant Breeding, Agricultural College, Bapatla-522 101, AP
1
Department of Crop Physiology, Agricultural College, Bapatla-522 101, AP
2
Department of Statistics & Mathematics, Agricultural College, Bapatla-522 101, AP
3
Regional Agricultural Research Station, Anakapalle. AP Email: [email protected]
(Received: 24 Feb 2014; Accepted:27 May 2014 )
Abstract
A study was carried out on correlation and path coefficient analysis for eighteen characters on 45 hybrids, 15 inbred lines and 3 testers along with three checks at three locations and in two seasons (kharif 2012 and rabi 2012-13). The traits days to 50 % tasseling, days to 50 % silking, days to maturity, plant height, ear height, ear length, ear girth, number of kernel rows per cob, number kernels per row, starch %, oil %, relative growth rate at 30-60 DAS, net assimilation rate at 30-60 DAS, net assimilation rate at 60-90 DAS, test weight were found to possess significant association in desirable direction with seed yield per plant at both genotypic and phenotypic levels. Path analysis revealed that ear height, ear length, ear girth, net assimilation rate at 30-60 DAS and test weight showed relationship by establishing significant positive direct association with grain yield per plant.
Key words:
Maize, correlations and path analysis
Maize (Zea mays L.) is the third most important cereal food crop of the world belonging to the family Poaceae and tribe Maydeae after wheat and rice. In India, rapid growth in population outstrips gain in cereal production. Increased production of maize and its alternate utilization in food channel can reduce the pressure on wheat and rice and its imports. Now a days, maize has been recognised as an industrial crop because of the diversified products that can be developed like starch, syrup, glucose, gluten, oil and most of the total maize produced is being utilized as raw material in the poultry feed industry.
Grain yield is a complex quantitative character with low heritability which in turn depends on a number of other factors, direct selection through correlated response entailing several contributing factors which influence grain yield both directly and indirectly shall be more appropriate. Knowing the correlations between traits is also of great importance for success of selections in breeding programmes and analysis of correlation coefficient is the most widely used one among numerous methods that can be used. Sometimes correlation coefficients give misleading results as they do not give the cause and effect relationship. It is therefore, necessary to analyze the cause and effect relationship between dependent and independent variables to entangle nature of relationship between variables. Keeping these points in view, an effort was made to study the relationship between yield and other important yield attributes in maize.
ISSN 0975-928X
parameters each time at 30 days interval. Relative growth rate and net assimilation rate were calculated using the formula suggested by Blackman (1919) and Gregory (1926), respectively. Protein percentage, starch percentage and oil percentage were analysed by NIR Analyser. The analysis of character association was worked out as suggested by Falconer (1964) and the direct and indirect contribution of component characters to yield was calculated through path coefficient anlaysis as suggested by Dewey and Lu (1959).
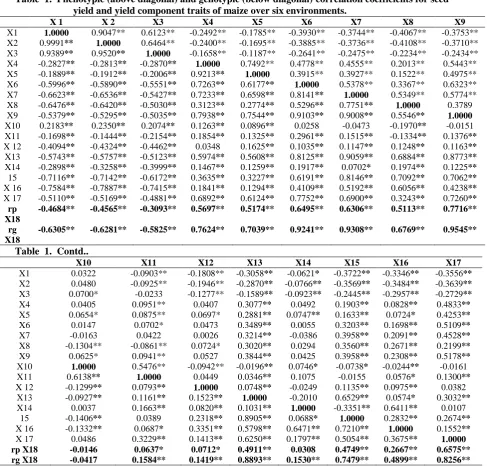
Genotypic correlations in general are higher than phenotypic correlations indicating that the apparent associations are largely due to genetic reasons (Table 1). The traits days to 50 % tasseling, days to 50 % silking, days to maturity, plant height, ear height, ear length, ear girth, number of kernel rows per cob, number kernels per row, starch %, oil %, relative growth rate at 30-60 DAS, net assimilation rate at 30-60 DAS, net assimilation rate at 60-90 DAS and test weight were found to possess significant positive association in desirable direction with seed yield per plant at both genotypic and phenotypic levels.
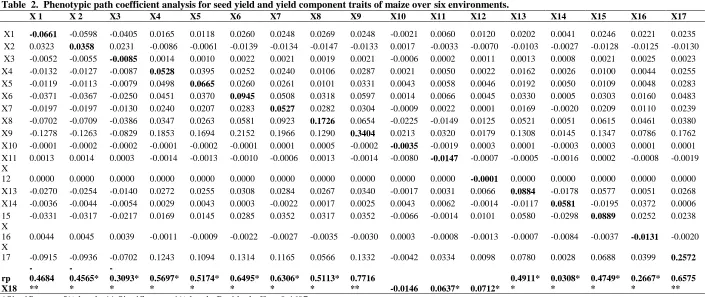
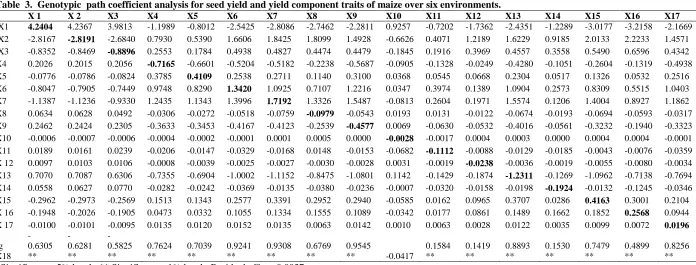
Path coefficient analysis allows separating direct effect and their indirect effects through other attributes by partitioning correlation (Wright 1921). Path coefficient analysis revealed that ear height, ear length, ear girth, net assimilation rate at 30-60 DAS and test weight had high positive direct effect on grain yield (Tables 2&3). Direct negative effects on grain yield were attributed by days to maturity.
All the three floral characters, viz., days to 50% tasseling, days to 50% silking and days to maturity showed significant negative association with seed yield per plant and with other yield attributing characters like cob length, cob girth, number of kernel rows per cob, number of kernels per row, oil, relative growth rate at 30-60 DAS, relative growth rate at 60-90 DAS, net assimilation rate at 30-60 DAS, net assimilation rate at 60-90 DAS, test weight and also manifested positive association among themselves concluding that the selection of hybrids with less number of days to tasseling, silking and maturity will automatically improve the yield along with yield component characters.
Plant height exhibited positive and significant association with ear height, ear length, ear girth, number of kernel rows per cob, number of kernels per row, starch percentage, relative growth rate at 30-60 DAS, net assimilation rate at 30-60 DAS, net assimilation rate at 60-90 DAS, test weight and seed yield per plant both at phenotypic and genotypic levels where as path analysis revealed positive direct effect at phenotypic level and
negative direct effect at genotypic level. Here the contribution of high positive indirect effects nullified the negative direct effect at genotypic level. In such situations, the high positive indirect causal factors viz., days to maturity, ear height, ear length, ear girth, net assimilation rate at 30-60 DAS and test weight are to be considered during selection process. Similar results of positive direct effect of plant height on grain yield per plant were reported by Kumar and Singh (2004), Parimala et al. (2011), Kumar et al. (2011), Raghu et al.
(2011) and Reddy et al. (2013) at both phenotypic and genotypic levels.
Ear height had positive and significant association with ear length, ear girth, number of kernel rows per cob, number of kernels per row, protein, starch, oil, relative growth rate at 30-60 DAS, relative growth rate at 60-90 DAS, net assimilation rate at 30-60 DAS, net assimilation rate at 60-90 DAS, test weight and seed yield per plant. Ear height exhibited positive direct effect coupled with significant positive correlation at both phenotypic and genotypic levels. Hence greater emphasis in selection should be placed on these characters for improvement of yield. These findings are in agreement with the findings of Muhammad et al. (2010) and Selvaraj and Nagarajan (2011).
Ear length exhibited significant association with ear girth, number of kernel rows per cob, number of kernels per row, starch, relative growth rate at 30-60 DAS, net assimilation rate at 30-60 DAS, net assimilation rate at 60-90 DAS, test weight and seed yield per plant both at phenotypic and genotypic levels. These findings are in agreement with Raghu et al. (2011) and Reddy et al. (2013). This trait showed significant positive association and positive direct effect on seed yield per plant at phenotypic and genotypic level. This trait also expressed positive indirect effects via days to maturity, ear height, ear girth, net assimilation rate at 30-60 DAS and test weight at both the levels. These results were in conformity with the findings of Parimala et al. (2011) and Reddy et al. (2013) at both phenotypic and genotypic levels. As the direct effects of cob length on yield at both genotypic and phenotypic level accounted for the major portion in the total correlation between them, direct selection on ear length will be effective.
ISSN 0975-928X
plant both at phenotypic and genotypic levels. This trait exhibited positive indirect effect on seed yield per plant through days to maturity, ear height, ear length, net assimilation rate at 30-60 DAS and test weight. Hence direct selection of ear girth and also considering positive indirect effects improves the seed yield per plant. These findings are in agreement with Muhammad et al. (2010) and Vijay Kumar et al. (2013).
Number of kernel rows per cob exhibited positive and significant association with number of kernels per row, oil, relative growth rate at 30-60 DAS, net assimilation rate at 30-60 DAS, net assimilation rate at 60-90 DAS, test weight and seed yield per plant where as with protein and starch it showed negative significant association at phenotypic and genotypic levels. Number of kernel rows per cob exhibited positive direct effect at phenotypic level while at genotypic level the low negative direct effect was observed. Significant positive correlation was observed for this trait with seed yield per plant both at phenotypic and genotypic levels. Positive indirect effects through days to maturity, ear height, ear length, ear girth, protein, starch, net assimilation rate at 30-60 DAS and test weight. Hence, selection through this character may bring improvement in seed yield per plant by considering the positive indirect casual factors. These results are in agreement with Raghu et al.
(2011a), Zarei et al. (2012) and Reddy et al.
(2013).
Number of kernels per row exhibited positive and significant association with starch oil, relative growth rate at 30-60 DAS, net assimilation rate at 30-60 DAS, net assimilation rate at 60-90 DAS, test weight and seed yield per plant both at phenotypic and genotypic levels. Muhammad et al.
(2010) and Vijay Kumar et al. (2013) reported similar results for this trait. This trait exhibited negative direct effect at phenotypic level and positive direct effect at genotypic level. Correlation with seed yield per plant exhibited positive significance at both the levels. It had positive indirect effects through days to maturity, ear height, ear length, ear girth, net assimilation rate at 30-60 DAS and test weight. Hence selection based on these characters would bring improvement in seed yield per plant considering more of positive indirect causal factors than the negative indirect casual factors.
Relative growth rate at 30-60 exhibited positive significant correlation with net assimilation rate at 30-60 DAS, net assimilation rate at 60-90 DAS, test weight and seed yield per plant both at phenotypic and genotypic levels. Relative growth rate at 60-90 DAS exhibited positive and significant association with net assimilation rate
60-90 DAS at both phenotypic and genotypic levels. Net assimilation rate at 30-60 DAS exhibited positive and significant association with net assimilation rate at 60-90 DAS, test weight, seed yield per plant both at phenotypic and genotypic levels. Net assimilation rate at 60-90 DAS exhibited positive significant association with test weight, seed yield per plant both at phenotypic and genotypic levels. All the physiological characters showed positive association among themselves and also with seed yield per plant. Net assimilation rate at 30-60 DAS exhibited positive association coupled with positive direct effect signifying the rate of dry weight that was put forth per increase in unit leaf area per unit time between the thirty and sixty days after sowing which might have directly contributed to the seed yield per plant.
Starch percentage manifested positive significant association at genotypic and phenotypic levels with number of kernels per row, plant height, ear height, net assimilation rate at 60-90 DAS, test weight, and seed yield per plant. Positive association of starch with seed yield per plant was indicated by Selvaraj and Nagarajan (2011) and Mahesh et al. (2013).
Protein per cent exhibited positive significant association with days to maturity, ear height and starch per cent while negative significant association was noticed with oil, net assimilation rate at 30-60 DAS and seed yield per plant both at phenotypic and genotypic levels. These results are in agreement with Fabijanac et al. (2006), Parimala
et al. (2011), Selvaraj and Nagarajan (2011) and Mahesh et al. (2013). An important finding of the present study is the positive correlation observed between protein and starch content. Both protein and starch are primarily present in the endosperm and a positive correlation between these two components implies that breeding for both starch and protein could be strategized simultaneously. Protein percent is negatively correlated with seed yield per plant, so a balance between the traits starch and protein must be maintained to get improvement in yield. These results are in agreement with Chaudhary et al. (2012).
ISSN 0975-928X
DAS and test weight. This clearly indicates improvement of seed yield per plant considering the above yield components will in turn helps in improvement of the quality traits like starch and oil.
Protein, starch and oil showed low negative direct effect both at phenotypic and genotypic levels. Starch and oil exhibited low positive significant correlation where as protein non significant negative association with seed yield per plant. Starch and oil exhibited positive indirect effect via
days to maturity, ear height, ear length, ear girth and test weight both at phenotypic and genotypic levels. The indirect effects seem to be the cause of positive correlations. Hence the indirect causal factors are to be considered simultaneously for selection.
Residual phenotypic and genotypic effects observed 0.4697 and 0.0037 indicating the addition of some more parameters in the study. This may also be due to the varied expression of the parameters over environments. Thus the present, investigation clearly indicated that simultaneous improvement of grain yield per plant is possible through manifestation of days to maturity, ear height, ear length, ear girth, net assimilation rate at 30-60 DAS and test weight.
References
Blackman, V.H. 1919. Soil plant relationship. John Wiley and Sons Inc., New York. Chaudhary, D. P. Sapna, S. Mandhania and R. Kumar. 2012. Inter-relationship among nutritional quality parameters of maize (Zea mays L.) genotypes. Indian J Agri. Sci., 82(8):681-686. Dewey, D. and Lu, K.H. 1959. A correlation and path
coefficient analysis of components of crested wheat grass seed production. Agron. J., 51: 515-518.
Fabijanac, D., Varag, B., Svecnjak, Z. and Grbesa, D. 2006. Grain yield and quality of semiflint maize hybrids at two sowing dates.
Agriculturae Conspectus Scientificus, 71 (2): 45-50.
Falconer, D.S. 1964. An introduction to quantitative genetics. Oliver and Boyd Publishing Co. Pvt. Ltd., Edinburgh. 312-324.
Gregory, F. G. 1926. The effect of climatic conditions on growth of barley. Annals of Bot., 40: 1-26. Kumar, T.S., Reddy, D.M., Reddy, K.H. and Sudhakar,
P. 2011. Targeting of traits through assessment of interrelationship and path analysis between yield and yield components for grain yield improvement in single cross hybrids of maize (Zea mays L.). Int. J of Appl. Biology and Phar. Tech., 2 (3): 123-129.
Kumar, A and Singh, N.N. 2004. Identification of yield contributors through path analysis in maize.
Ann. of Agri. Res., 25(3): 448-450.
Mahesh, N., Wali, M. C., Gowda, M. V. C., Motagi, B. N. and Nagaratna F. Uppinal. 2013. Genetic analysis of grain yield, starch, protein and oil content in single cross hybrids of maize.
Karnataka J. Agri. Sci., 26 (2): 185-189.
Muhammad Rafiq, Ch., Muhammad Rafique, Amer Hussain and Muhammad Altaf. 2010. Studies on heritability, correlation and path analysis in maize (Zea mays L.). J. Agri. Res., 48 (1): 35-38.
Parimala, K., Raghu, B. and Reddy, A.V. 2011. Correlation and path analysis for yield and quality traits in maize (Zea mays L.). Plant Arch., 11(2): 1045-1047.
Raghu, B., Suresh, J., Kumar, S.S. and Saidaiah, P. 2011. Character association and path analysis in maize (Zea mays L.). Madras Agri. J., 98
(1-3): 7-9.
Reddy, V.R., Jabeen, F., Sudarshan, M.R. and Rao, A.S. 2013. Studies on genetic variability, heritability, correlation and path analysis in maize (Zea mays L.) over locations. Intl. J. of Appl. Biol. and Phar. Tech., 4 (1): 195-199. Selvaraj, C.I and Nagarajan, P. 2011. Interrelationship
and path-coefficient studies for qualitative traits, grain yield and other yield attributes among maize (Zea mays L.) genotypes. Intl. J. Plant Breed. and Genet., 5(3):209-223. Vijay Kumar, K., Sudarshan, M. R., Kuldeep, S. D. and
Madhusudan Reddy, S. 2013. Character association and path coefficient analysis for seed yield in quality protein maize (Zea mays
L.). The J. of Res., ANGRAU,41(2): 153-157. Wright, S. 1921. Correlation and causation. J. Agri. Res.,
20: 557-585.
ISSN 0975-928X
Table 1. Phenotypic (above diagonal) and genotypic (below diagonal) correlation coefficients for seed yield and yield component traits of maize over six environments.
X 1 X 2 X3 X4 X5 X6 X7 X8 X9
X1 1.0000 0.9047** 0.6123** -0.2492** -0.1785** -0.3930** -0.3744** -0.4067** -0.3753**
X2 0.9991** 1.0000 0.6464** -0.2400** -0.1695** -0.3885** -0.3736** -0.4108** -0.3710** X3 0.9389** 0.9520** 1.0000 -0.1658** -0.1187** -0.2641** -0.2475** -0.2234** -0.2434** X4 -0.2827** -0.2813** -0.2870** 1.0000 0.7492** 0.4778** 0.4555** 0.2013** 0.5443** X5 -0.1889** -0.1912** -0.2006** 0.9213** 1.0000 0.3915** 0.3927** 0.1522** 0.4975** X6 -0.5996** -0.5890** -0.5551** 0.7263** 0.6177** 1.0000 0.5378** 0.3367** 0.6323** X7 -0.6623** -0.6536** -0.5427** 0.7233** 0.6598** 0.8141** 1.0000 0.5349** 0.5774** X8 -0.6476** -0.6420** -0.5030** 0.3123** 0.2774** 0.5296** 0.7751** 1.0000 0.3789 X9 -0.5379** -0.5295** -0.5035** 0.7938** 0.7544** 0.9103** 0.9008** 0.5546** 1.0000
X10 0.2183** 0.2350** 0.2074** 0.1263** 0.0896** 0.0258 -0.0473 -0.1970** -0.0151 X11 -0.1698** -0.1444** -0.2154** 0.1854** 0.1325** 0.2961** 0.1515** -0.1334** 0.1376**
X 12 -0.4094** -0.4324** -0.4462** 0.0348 0.1625** 0.1035** 0.1147** 0.1248** 0.1163**
X13 -0.5743** -0.5757** -0.5123** 0.5974** 0.5608** 0.8125** 0.9059** 0.6884** 0.8773**
X14 -0.2898** -0.3258** -0.3999** 0.1467** 0.1259** 0.1917** 0.0702* 0.1974** 0.1225**
15 -0.7116** -0.7142** -0.6172** 0.3635** 0.3227** 0.6191** 0.8146** 0.7092** 0.7062**
X 16 -0.7584** -0.7887** -0.7415** 0.1841** 0.1294** 0.4109** 0.5192** 0.6056** 0.4238**
X 17 -0.5110** -0.5169** -0.4881** 0.6892** 0.6124** 0.7752** 0.6900** 0.3243** 0.7260** rp
X18
-0.4684** -0.4565** -0.3093** 0.5697** 0.5174** 0.6495** 0.6306** 0.5113** 0.7716**
rg X18
-0.6305** -0.6281** -0.5825** 0.7624** 0.7039** 0.9241** 0.9308** 0.6769** 0.9545**
Table 1. Contd..
X10 X11 X12 X13 X14 X15 X16 X17
X1 0.0322 -0.0903** -0.1808** -0.3058** -0.0621* -0.3722** -0.3346** -0.3556**
X2 0.0480 -0.0925** -0.1946** -0.2870** -0.0766** -0.3569** -0.3484** -0.3639**
X3 0.0700* -0.0233 -0.1277** -0.1589** -0.0923** -0.2445** -0.2957** -0.2729**
X4 0.0405 0.0951** 0.0407 0.3077** 0.0492 0.1903** 0.0828** 0.4833**
X5 0.0654* 0.0875** 0.0697* 0.2881** 0.0747** 0.1633** 0.0724* 0.4253**
X6 0.0147 0.0702* 0.0473 0.3489** 0.0055 0.3203** 0.1698** 0.5109**
X7 -0.0163 0.0422 0.0026 0.3214** -0.0386 0.3958** 0.2091** 0.4528**
X8 -0.1304** -0.0861** 0.0724* 0.3020** 0.0294 0.3560** 0.2671** 0.2199**
X9 0.0625* 0.0941** 0.0527 0.3844** 0.0425 0.3958** 0.2308** 0.5178**
X10 1.0000 0.5476** -0.0942** -0.0196** 0.0746* -0.0738* -0.0244** -0.0161
X11 0.6138** 1.0000 0.0449 0.0346** 0.1075 -0.0155 0.0576* 0.1300**
X 12 -0.1299** 0.0793** 1.0000 0.0748** -0.0249 0.1135** 0.0975** 0.0382 X13 -0.0927** 0.1161** 0.1523** 1.0000 -0.2010 0.6529** 0.0574* 0.3032**
X14 0.0037 0.1663** 0.0820** 0.1031** 1.0000 -0.3351** 0.6411** 0.0107 15 -0.1406** 0.0389 0.2318** 0.8905** 0.0688* 1.0000 0.2832** 0.2674**
X 16 -0.1332** 0.0687* 0.3351** 0.5798** 0.6471** 0.7210** 1.0000 0.1552**
X 17 0.0486 0.3229** 0.1413** 0.6250** 0.1797** 0.5054** 0.3675** 1.0000
rp X18 -0.0146 0.0637* 0.0712* 0.4911** 0.0308 0.4749** 0.2667** 0.6575**
rg X18 -0.0417 0.1584** 0.1419** 0.8893** 0.1530** 0.7479** 0.4899** 0.8256**
rp- phenotypic correlation ; rg- genotypic correlation *Significant at 5% level ** Significant at 1% level
ISSN 0975-928X
Table 2. Phenotypic path coefficient analysis for seed yield and yield component traits of maize over six environments.
X 1 X 2 X3 X4 X5 X6 X7 X8 X9 X10 X11 X12 X13 X14 X15 X16 X17
X1 -0.0661 -0.0598 -0.0405 0.0165 0.0118 0.0260 0.0248 0.0269 0.0248 -0.0021 0.0060 0.0120 0.0202 0.0041 0.0246 0.0221 0.0235
X2 0.0323 0.0358 0.0231 -0.0086 -0.0061 -0.0139 -0.0134 -0.0147 -0.0133 0.0017 -0.0033 -0.0070 -0.0103 -0.0027 -0.0128 -0.0125 -0.0130 X3 -0.0052 -0.0055 -0.0085 0.0014 0.0010 0.0022 0.0021 0.0019 0.0021 -0.0006 0.0002 0.0011 0.0013 0.0008 0.0021 0.0025 0.0023 X4 -0.0132 -0.0127 -0.0087 0.0528 0.0395 0.0252 0.0240 0.0106 0.0287 0.0021 0.0050 0.0022 0.0162 0.0026 0.0100 0.0044 0.0255 X5 -0.0119 -0.0113 -0.0079 0.0498 0.0665 0.0260 0.0261 0.0101 0.0331 0.0043 0.0058 0.0046 0.0192 0.0050 0.0109 0.0048 0.0283 X6 -0.0371 -0.0367 -0.0250 0.0451 0.0370 0.0945 0.0508 0.0318 0.0597 0.0014 0.0066 0.0045 0.0330 0.0005 0.0303 0.0160 0.0483 X7 -0.0197 -0.0197 -0.0130 0.0240 0.0207 0.0283 0.0527 0.0282 0.0304 -0.0009 0.0022 0.0001 0.0169 -0.0020 0.0209 0.0110 0.0239 X8 -0.0702 -0.0709 -0.0386 0.0347 0.0263 0.0581 0.0923 0.1726 0.0654 -0.0225 -0.0149 0.0125 0.0521 0.0051 0.0615 0.0461 0.0380 X9 -0.1278 -0.1263 -0.0829 0.1853 0.1694 0.2152 0.1966 0.1290 0.3404 0.0213 0.0320 0.0179 0.1308 0.0145 0.1347 0.0786 0.1762 X10 -0.0001 -0.0002 -0.0002 -0.0001 -0.0002 -0.0001 0.0001 0.0005 -0.0002 -0.0035 -0.0019 0.0003 0.0001 -0.0003 0.0003 0.0001 0.0001 X11 0.0013 0.0014 0.0003 -0.0014 -0.0013 -0.0010 -0.0006 0.0013 -0.0014 -0.0080 -0.0147 -0.0007 -0.0005 -0.0016 0.0002 -0.0008 -0.0019 X
12 0.0000 0.0000 0.0000 0.0000 0.0000 0.0000 0.0000 0.0000 0.0000 0.0000 0.0000 -0.0001 0.0000 0.0000 0.0000 0.0000 0.0000 X13 -0.0270 -0.0254 -0.0140 0.0272 0.0255 0.0308 0.0284 0.0267 0.0340 -0.0017 0.0031 0.0066 0.0884 -0.0178 0.0577 0.0051 0.0268 X14 -0.0036 -0.0044 -0.0054 0.0029 0.0043 0.0003 -0.0022 0.0017 0.0025 0.0043 0.0062 -0.0014 -0.0117 0.0581 -0.0195 0.0372 0.0006 15 -0.0331 -0.0317 -0.0217 0.0169 0.0145 0.0285 0.0352 0.0317 0.0352 -0.0066 -0.0014 0.0101 0.0580 -0.0298 0.0889 0.0252 0.0238 X
16 0.0044 0.0045 0.0039 -0.0011 -0.0009 -0.0022 -0.0027 -0.0035 -0.0030 0.0003 -0.0008 -0.0013 -0.0007 -0.0084 -0.0037 -0.0131 -0.0020 X
17 -0.0915 -0.0936 -0.0702 0.1243 0.1094 0.1314 0.1165 0.0566 0.1332 -0.0042 0.0334 0.0098 0.0780 0.0028 0.0688 0.0399 0.2572
rp X18
-0.4684 **
-0.4565* *
-0.3093* *
0.5697* *
0.5174* *
0.6495* *
0.6306* *
0.5113* *
0.7716
** -0.0146 0.0637* 0.0712*
0.4911* *
0.0308* *
0.4749* *
0.2667* *
0.6575 **
*Significant at 5% level ** Significant at 1% level; Residual effect-0.4697
ISSN 0975-928X
Table 3. Genotypic path coefficient analysis for seed yield and yield component traits of maize over six environments.
X 1 X 2 X3 X4 X5 X6 X7 X8 X9 X10 X11 X12 X13 X14 X15 X16 X17
X1 4.2404 4.2367 3.9813 -1.1989 -0.8012 -2.5425 -2.8086 -2.7462 -2.2811 0.9257 -0.7202 -1.7362 -2.4351 -1.2289 -3.0177 -3.2158 -2.1669
X2 -2.8167 -2.8191 -2.6840 0.7930 0.5390 1.6606 1.8425 1.8099 1.4928 -0.6626 0.4071 1.2189 1.6229 0.9185 2.0133 2.2233 1.4571 X3 -0.8352 -0.8469 -0.8896 0.2553 0.1784 0.4938 0.4827 0.4474 0.4479 -0.1845 0.1916 0.3969 0.4557 0.3558 0.5490 0.6596 0.4342 X4 0.2026 0.2015 0.2056 -0.7165 -0.6601 -0.5204 -0.5182 -0.2238 -0.5687 -0.0905 -0.1328 -0.0249 -0.4280 -0.1051 -0.2604 -0.1319 -0.4938 X5 -0.0776 -0.0786 -0.0824 0.3785 0.4109 0.2538 0.2711 0.1140 0.3100 0.0368 0.0545 0.0668 0.2304 0.0517 0.1326 0.0532 0.2516 X6 -0.8047 -0.7905 -0.7449 0.9748 0.8290 1.3420 1.0925 0.7107 1.2216 0.0347 0.3974 0.1389 1.0904 0.2573 0.8309 0.5515 1.0403 X7 -1.1387 -1.1236 -0.9330 1.2435 1.1343 1.3996 1.7192 1.3326 1.5487 -0.0813 0.2604 0.1971 1.5574 0.1206 1.4004 0.8927 1.1862 X8 0.0634 0.0628 0.0492 -0.0306 -0.0272 -0.0518 -0.0759 -0.0979 -0.0543 0.0193 0.0131 -0.0122 -0.0674 -0.0193 -0.0694 -0.0593 -0.0317 X9 0.2462 0.2424 0.2305 -0.3633 -0.3453 -0.4167 -0.4123 -0.2539 -0.4577 0.0069 -0.0630 -0.0532 -0.4016 -0.0561 -0.3232 -0.1940 -0.3323 X10 -0.0006 -0.0007 -0.0006 -0.0004 -0.0002 -0.0001 0.0001 0.0005 0.0000 -0.0028 -0.0017 0.0004 0.0003 0.0000 0.0004 0.0004 -0.0001 X11 0.0189 0.0161 0.0239 -0.0206 -0.0147 -0.0329 -0.0168 0.0148 -0.0153 -0.0682 -0.1112 -0.0088 -0.0129 -0.0185 -0.0043 -0.0076 -0.0359 X 12 0.0097 0.0103 0.0106 -0.0008 -0.0039 -0.0025 -0.0027 -0.0030 -0.0028 0.0031 -0.0019 -0.0238 -0.0036 -0.0019 -0.0055 -0.0080 -0.0034 X13 0.7070 0.7087 0.6306 -0.7355 -0.6904 -1.0002 -1.1152 -0.8475 -1.0801 0.1142 -0.1429 -0.1874 -1.2311 -0.1269 -1.0962 -0.7138 -0.7694 X14 0.0558 0.0627 0.0770 -0.0282 -0.0242 -0.0369 -0.0135 -0.0380 -0.0236 -0.0007 -0.0320 -0.0158 -0.0198 -0.1924 -0.0132 -0.1245 -0.0346 X15 -0.2962 -0.2973 -0.2569 0.1513 0.1343 0.2577 0.3391 0.2952 0.2940 -0.0585 0.0162 0.0965 0.3707 0.0286 0.4163 0.3001 0.2104 X 16 -0.1948 -0.2026 -0.1905 0.0473 0.0332 0.1055 0.1334 0.1555 0.1089 -0.0342 0.0177 0.0861 0.1489 0.1662 0.1852 0.2568 0.0944 X 17 -0.0100 -0.0101 -0.0095 0.0135 0.0120 0.0152 0.0135 0.0063 0.0142 0.0010 0.0063 0.0028 0.0122 0.0035 0.0099 0.0072 0.0196
rg X18
-0.6305 **
-0.6281 **
-0.5825 **
0.7624 **
0.7039 **
0.9241 **
0.9308 **
0.6769 **
0.9545
** -0.0417
0.1584 **
0.1419 **
0.8893 **
0.1530 **
0.7479 **
0.4899 **
0.8256 ** *Significant at 5% level ** Significant at 1% level; Residual effect=0.0037