International Journal of Advances in Engineering Research http://www.ijaer.com
(IJAER) 2012, Vol. No. 3, Issue No. II, February ISSN: 2231-5152
PERFORMANCE STUDY OF SELF SCREENING AND
STAND-OFF RADAR JAMMERS
L.Surendra1,Syed Shameem2, G.Kamal Raj3, Sivaji Chowdary4 1Assistant professor Department of ECE K L University Vaddeswaram, AP, INDIA 2Associate professor Department of ECE K L University Vaddeswaram, AP,INDIA 3B. Tech IV year student Department of ECE K L University Vaddeswaram, AP, INDIA 4B. Tech IV year student Department of ECE K L University Vaddeswaram, AP, INDIA
ABSTRACT
RADARs are mainly used to detect and locate the position of objects. In the war fields it is very important that the target identity is masked so that the enemy attacks can be overcome. In order to mask the targets and create the false identity jammers are very useful. There are various types of jammers and self screening jammers and stand-off jammers are the most protecting jammers. Hence we have analysed all the parameters related to self screening jammers (SSJ) and stand-off jammers (SOJ). The variation of the cross over range with respect to jammer peak power, RADAR peak power, attenuation in SSJ and the variation of range reduction factor with respect to frequency, RADAR to jammer range, jammer peak power in SOJ are analysed using MATLAB in this article.
Keywords: RADAR, Jammers, Self Screening Jammers, Stand-Off jammers, Cross Over/Burn Through Range, Range Reduction Factor
INTRODUCTION
RADAR meant for Radio Detection and Ranging. Generally RADAR systems use the modulated waveform and directive antennas to transmit electromagnetic energy into specific volume in space for targets. Targets which are kept in a limited volume reflect energy back to the RADAR. Then the processed echoes are received by RADAR to extract target information such as range, velocity, angular position, and other characteristics.
The equation of radar is given as
𝑃𝑟 = 𝑃𝑡𝐺𝑡
4𝜋𝑅2
𝜎
4𝜋𝑅2𝐴𝑒 (1)
𝐴𝑒 = 𝜆2𝐺𝑟
4𝜋 (2)
Pr = Received power
Pt = Transmitted power Gt= Gain of transmitter Gr = Gain of receiver
International Journal of Advances in Engineering Research http://www.ijaer.com
(IJAER) 2012, Vol. No. 3, Issue No. II, February ISSN: 2231-5152
R = Distance between target and transmitter
Ae= Effective area of the receiving antenna
If we attempt to disturb the normal RADAR operation intentionally it is called as electronic counter measure (ECM). ECM accomplishes one or several objectives such as denying proper target detection, generate operator confusion, creating false tracks of targets. The purpose of electronic attack is to reduce use of portion of electromagnetic spectrum to an enemy. Jammer’s effective radiated power (ERP) which is the product of radio frequency power arriving at antenna and the power gain produced by the antenna is used to detect energy radiated in a particular direction.
RADAR JAMMING TECHNIQUES
Generally jamming techniques are of two types. They are noise jamming and deception jamming.
A. NOISE JAMMING
The objective of noise jamming is to introduce disruptive signal into hostile environment to obscure the wanted signal. The noise is due to Data link, Communication medium and RADAR receiver. On other hand in spot jamming, receiver senses the signal that is to be jammed and aligns the jammer to a particular operating frequency. By employing techniques like frequency agility, frequency hopping and spread spectrum we can detect spot jamming. This is done by drawing the jammer into broad band barrage mode.
The barrage jammer operates over wide band of frequencies rather than discrete frequencies. Barrage jamming used against frequency agile transmitters. To generate high power over wide band of frequencies comes at high cost, weight and size. When the obscuring noise appears similar to thermal noise of victim’s receiver, ideal jamming is achieved. In this situation, the presence of target is not observed by the transmitter.The main advantage of noise jamming is that only little information is enough to know the characteristics of victim emitter for jamming to be effective. Indiscriminate use of noise jammers increase the cost of jamming resources and also compromise the safety of jamming platform. If the emitter is non-radiating, it is meaningless to jam it. So most jammers use a receiver which may be a resource on the platform such as RADAR warning receiver to monitor the electromagnetic environment.
B. Deception Jamming
International Journal of Advances in Engineering Research http://www.ijaer.com
(IJAER) 2012, Vol. No. 3, Issue No. II, February ISSN: 2231-5152 used for tracking, a jamming signal of sufficient power at an appropriate frequency must be generated so that operation of enemy RADAR receiver is disrupted. When the strength of jamming signal exceeds the signal reflected from the platform to be protected, the RADAR will be unable to derive accurate range and bearing information. In practical, travelling wave tubes (TWT) and solid state devices and hybrid of both are used. These approaches find application in an overlapping spectrum of frequencies and available powers.
In general solid state devices offer lower distortion and better gain linearity than TWT’s over much of their dynamic range. These devices also provide higher maximum gain and lower noise. Substitution of solid state amplifiers for traditional TWT amplifiers failed for two reasons
1. The efficiency of wideband solid state amplifiers is much lower than TWT amplifiers.
2. The maximum power provided by the solid state microwave monolithic integrated circuit (MMIC) amplifier was low about 1 watt.
To achieve required RF power, many parallel solid state amplifiers are necessary and losses in recombination process needed to get power into a single output made solid state technology even more inefficient. The idea for exploitation of solid state devices was performing recombination process of solid state paralleled amplifiers directly in air through phased array antenna
SELF SCREENING JAMMERS
Self-screening jammers are a class of ECM systems carried on the vehicle they are protecting. SSJ exhibit the properties of barrage jammers. Self-screening jammers, also known as self-protecting jammers, are a class of ECM systems carried on the vehicle they ar e self-protecting. Escort jammers (carried on vehicles that accompany the attacking vehicles) can also be treated as SSJs if they appear at the same range as that of the target.
𝑃𝑆𝑆𝐽 = 𝑃𝑗 𝐺𝑗
4𝜋𝑅2
𝐴𝐵
𝑃𝐽𝐿𝐽 (3)
𝑃𝑆𝑆𝐽 = Power received at Radar from Jammer 𝑃𝐽 = Jammer’s peak power
A = Effective area of RADAR
𝐵𝐽 = Operating Bandwidth of Jammer R = Distance between Target and RADAR B = Bandwidth of RADAR
𝐿𝐽 = Losses
International Journal of Advances in Engineering Research http://www.ijaer.com
(IJAER) 2012, Vol. No. 3, Issue No. II, February ISSN: 2231-5152 J/S crossover range is the radar-to-target range when the power received (S) from the radar skin return from the target equals the power received (J) from the jamming signal transmitted from the target. When the ratio of radar power to jammer power is unity the range is known as cross over or burn through range (𝑅𝑐𝑜)
(Rco)SSJ = (PTGσBJLJ
4πPJGJBL)
1 2 ⁄
(4)
B. Radar cross-section
The ability of target to reflect the RADAR signals in the direction of RADAR receiver is known as RADAR cross section. It is ratio of backscatter power per steradian in the direction of the RADAR from target to the power density that is intercepted by the target.
STAND-OFF JAMMERS (SOJ)
Stand-off jammers (SOJ) emit ECM signals from long ranges which are beyond the defence’s lethal capability. The power received by the radar from an SOJ jammer at range Rj is
𝑃𝑆𝑂𝐽 = 𝑃𝐽𝐺𝐽
4𝜋𝑅2
𝜆2𝐺′ 4𝜋
𝐵
𝐵𝐽𝐿𝐽 (5)
The gain term G’ represents the radar antenna gain in the direction of the jammer and is normally considered to be the side lobe gain.
The SOJ radar equation is
S
SSOJ=
PtG2RJ2σBJLJ
4πPJGJG′R4BL (6)
When s=Ssoj then the range cross over range is given as
(RCO)SOJ = (
PtG2RJ2σBJLJ
4πPJGJG′BL)
1 4 ⁄
(7)
And the detection range is
RD= (RCO)SOJ
√(S S⁄ SOJ)min
4 (8)
When the S/Ssoj is minimum value when compared to the signal to jammer power such that the target detection can occur.
International Journal of Advances in Engineering Research http://www.ijaer.com
(IJAER) 2012, Vol. No. 3, Issue No. II, February ISSN: 2231-5152 Range reduction factor (RRF) is given as the ratio of the jamming effective RADAR range to the detection range.
RESULTS
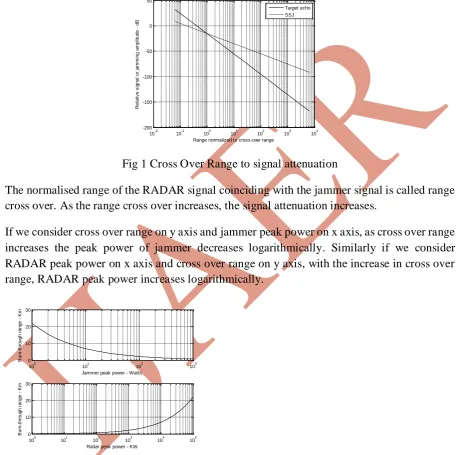
Fig 1 Cross Over Range to signal attenuation
The normalised range of the RADAR signal coinciding with the jammer signal is called range cross over. As the range cross over increases, the signal attenuation increases.
If we consider cross over range on y axis and jammer peak power on x axis, as cross over range increases the peak power of jammer decreases logarithmically. Similarly if we consider RADAR peak power on x axis and cross over range on y axis, with the increase in cross over range, RADAR peak power increases logarithmically.
Fig 2 Jammer Peak Power and Radar Peak Power to Cross Over Range
10-2 10-1 100 101 102 103 104 -200 -150 -100 -50 0 50
Range normalized to cross-over range
R e la ti v e s ig n a l o r ja m m in g a m p lit u d e d B Target echo SSJ
100 101 102 103
0 10 20 30
Jammer peak power - Watts
B u rn -t h ro u g h r a n g e K m
100 101 102 103 104 105
0 10 20 30
Radar peak power - KW
International Journal of Advances in Engineering Research http://www.ijaer.com
(IJAER) 2012, Vol. No. 3, Issue No. II, February ISSN: 2231-5152
Fig3 Detection Range and signal to jammer power
This proves that with the raise in the detecting range of the target, the S/(J+N) i.e cross over range decreases.
Fig 4 Jammer and Target Echo signal
When the wavelength increases the detection range decreases but when the radar to jammer range is increased the range reduction factor also increases and also jammer peak power increases range reduction factor decreases.
The below graph shows that as frequency increases the range reduction factor also increases as the jamming detection range reduces.
0 50 100 150 200 250 300 350 400
-20 -15 -10 -5 0 5 10 15 20
Detection range in Km
S
/(
J
+
N
)
in
d
B
10-1 100 101 102 103
-160 -140 -120 -100 -80 -60 -40 -20 0 20
Range normalized to cross-over range
R
e
la
ti
v
e
s
ig
n
a
l
o
r
ja
m
m
in
g
a
m
p
lit
u
d
e
d
B
International Journal of Advances in Engineering Research http://www.ijaer.com
(IJAER) 2012, Vol. No. 3, Issue No. II, February ISSN: 2231-5152
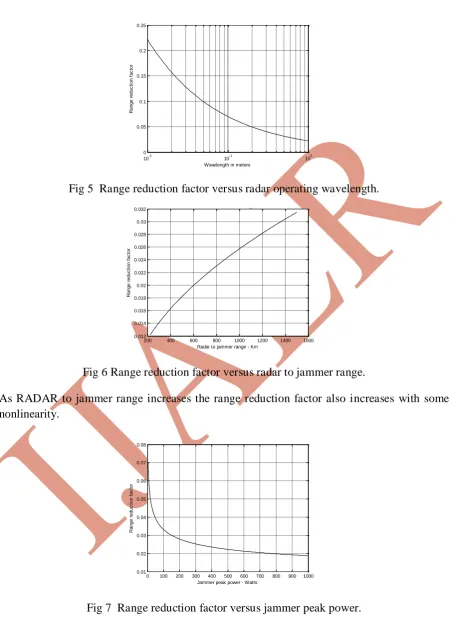
Fig 5 Range reduction factor versus radar operating wavelength.
Fig 6Range reduction factor versus radar to jammer range.
As RADAR to jammer range increases the range reduction factor also increases with some nonlinearity.
Fig 7 Range reduction factor versus jammer peak power.
As the power transmitted at the RADAR is increasing the range reduction factor reduces exponentially.
10-2 10-1 100
0 0.05 0.1 0.15 0.2 0.25
Wavelength in meters
R a n g e r e d u c ti o n f a c to r
200 400 600 800 1000 1200 1400 1600 0.012 0.014 0.016 0.018 0.02 0.022 0.024 0.026 0.028 0.03 0.032
Radar to jammer range - Km
R a n g e r e d u c ti o n f a c to r
0 100 200 300 400 500 600 700 800 900 1000 0.01 0.02 0.03 0.04 0.05 0.06 0.07 0.08
Jammer peak power - Watts
International Journal of Advances in Engineering Research http://www.ijaer.com
(IJAER) 2012, Vol. No. 3, Issue No. II, February ISSN: 2231-5152
ACKNOWLEDGEMENT
We thank the management of K L University for all the support and encouragement rendered in this project. We also extend our Sincere thanks to Vice Chancellor, Registrar and Dean Student Affairs of K L University and Head of the Department, Head of Communication and Radar Research Group Electronics and Communication Engineering Department K L University for providing the required facilities for carrying out this work.
CONCLUSION
RADAR transmission is a two-way transmission. It has to be emerged from the RADAR and hit the target where the signal is dispersed in all the directions and some part of the signal is echoed towards the RADAR which is a weak signal compared to the original signal that is transmitted. In other hand transmission through jammer is one-way, where it has to travel from target to the RADAR which is a direct signal from the jammer possessing high signal strength which can dominate the original RADAR signal. As the cross over range increases the signal attenuation increases, so the signal weakens. As operating frequency increases, there is an exponential decrease in detection range. As RADAR to jammer range increases the range reduction factor also increases with some nonlinearity. Range reduction factor and transmitted power are inversely related.
REFERENCES
[1] Introduction to Radar systems 3/E Skolnik Tata McGraw-Hill Education,
01-May-2001
[2]http://www.radartutorial.eu
[3] Advances in Bistatic Radar Nicholas J.Willis, Hugh Griffiths SciTech publishing, 01
-Jan-2007
[4]Electronic warfare and RADAR systems engineering Handbook.
[5] Radar Cross Section, Second Edition Eugene F.Knott, John Shaeffer, Michael Tuley
SciTech Publishing, 2004
[6]Principles of Modern Radar: Advanced Techniques William Melvin, James Scheer
Institution of Engineering and Technology, 01-sep-2012
[7]Principles of Modern radar Jerry L. Eaves, Edward Van Nostrand Reinhold, 30-jun-1987
[8]Understanding Radar: The ABCs of How Radar Systems Work Arnold E.Acker Inst of
Engineering & Technology, 02-Jan-2009
[9]Modern Radar Systems Hamish Meikle Artech House, 01-Jan-2001
International Journal of Advances in Engineering Research http://www.ijaer.com
(IJAER) 2012, Vol. No. 3, Issue No. II, February ISSN: 2231-5152
[11]Principles of modern radar systems Michel H.Carpentier Artech House, 1988
[12]Radar Essentials: A concise Handbook for Radar Design and Performance G. Richard
Curry Institution of Engineering and Technology, 2012