Abstract — This paper reviews software visualization focused on the educational environment. Software visualization is a very wide study field, so we have focused on two areas: recursion visualization and parsers’ visualization. The paper contains a retrospective about what has been made on it, what lacks we have found and the solution provided by the authors: SRec and VAST, two software tools trying to make a significant difference between them and the software made before.
Keywords — Software visualization, parsers’ construction, recursion, educational visualizations.
I. INTRODUCTION
OFTWARE visualizations tools are used in different context in order to improve and make easier the students learning process. Many different kinds of tools can be used to improve student learning process and motivation. For example, social networks have a large impact in student motivation and communication [45]. However, the results obtained are not always positive, so there exist different variables, which can reduce the educational impact. Nowadays, introducing multimedia techniques can improve the learning process [48]. In this work we present two different software visualization tools to display different aspects as can be recursion and parser analyzed process. However, the development and evaluation methodology used in both cases is similar: student centered. This means that all functionalities have been included, improved or removed according the evaluations results.
The rest of the paper is structured as follow. In section II we describe the most important related work in software visualization for recursion and parser generation. In section 3 we describe SRec system. VAST is described in section 4. In section 5 the evaluation process for SRec and VAST is described. Finally in section 6 we set the conclusions and future works.
II.RELATED WORKS
This section contains an introduction to software visualization and a review about how recursion and parsers are visualized by several already-made software tools, finding out lacks and shortages, and proposing a new software tool for those cases, SRec and VAST.
A.Software visualization
Software visualization is a technical tool for representing in an electronic, animated and interactive way. Most part of these representations tries to make easier the software comprehension.
The educational environment focused on computer science is one of the contexts where more software representations are used, but currently is not massive. Teachers are reluctant to adopt software and new ways to teach; they feel losing the control of the class when they use new software. Lack of evidences about visualization effectiveness is an important factor to explain why software visualization is not used in most classes.
In order to fix it, software for visualizations is created, taking usability recommendations and exhaustive analyses about what both teachers and students need.
B.Recursion visualization
Recursion visualization comprises the process of representing graphically the recursion, providing animation and interaction features. Recursion is a process or software function that requires its own service once or several times to find a solution. Every time the function is called by itself, the size of the problem is smaller, letting it to reach the base case, when the problem can be solved in an easy and direct way.
Recursion is a hard concept to be learned, help students to learn it through recursion visualization has been the main goal of a lot of software. These software applications usually use animations for describing step by step how recursion achieves to solve a problem. Student interaction is very important to make easier learning tasks [22] like algorithm analysis or debugging.
Recursion can be taught using different conceptual models. A conceptual model provides a singular representation for a concept, system or event, and must be complete, coherent and precise. For recursion, there are some conceptual models widely accepted and used for teaching recursion [19][42]. The most abstract one is the inductive model, defined as a mathematical formula where the base case is directly identified. Metaphors are very used because they make easy the identification of concepts with daily life (Russian dolls [14] or mirrors [41]).
Going deeper in computer science education, there are several conceptual models used at the classrooms. Trace is one
SRec and VAST: Visualizing Software with a
Student-Centered Aim.
Francisco Javier Almeida-Martínez and Antonio Pérez-Carrasco
Universidad Internacional de La Rioja, La Rioja, Spain
of them; every recursive call and its results are textually represented in a properly indented way. For multiple recursions the tree model is recommended, since it shows in a very clear way the nodes dependence. The animation runs over the tree in deep mode. We can find two kinds of trees: recursion tree (every node contains input parameters) or activation tree (every node contains input parameters and output result).
The third model shows a control stack where student can see a node for every unfinished call and the chronological order of callings. Copy-model broadens the control stack model, adding the source code into the visualization and/or the local variables in different windows or panels, properly stacked.
C.Software for recursion visualization
Within the functional paradigm, we can find applications like Kiel [11], RainbowScheme [21] and WinHIPE [29]. Kiel shows the execution of first-order logic programs through a syntax-structure tree, providing several functionalities for controlling the execution.
RainbowScheme allows students to see semantic content representations of programs coded using Scheme language. Students can see recursion tree and the stack status. The code is colored in order to identify the parts of the code shown in those visual representations. The program can be executed step by step.
WinHIPE is an IDE where user can see an expression evaluation as a process of rewriting. Expressions are displayed in a visual format through lists and trees. WinHIPE provides a set of configuration options for making a more understandable format. The steps sequence can be played entirely or partially, in automatic or manual ways.
Within the imperative paradigm, there are applications like ETV [34] and Jeliot [10], oriented to computer science, and other software like EROSI [18], Function Visualizer [15], Recursion Animator [40] and SimRecur [43], focused on recursion teaching.
ETV shows a copy of the code by every recursive sentence is executed. In every copy the current line is marked, that helps to follow the execution sentence by sentence. Jeliot provides a recursion tree and a copy-model view, similar to ETV, for Java-coded programs. It allows students to see which recursive calls are unfinished.
EROSI uses the copy model to show recursion. User can see the passive flow and the active flow, how data are transmitted and the output of the calls. The programs list is prefixed.
Function Visualizer works with Java-coded programs, showing step by step how the program is executed and opening a new window for every function call, so it is very easy for students to know which calls have not finished yet.
Recursion Animator requires recursive Pascal code to work. It uses the copy model, opening a new window for every called function. User can navigate forwards and backwards for repeating some parts of the execution.
SimRecur window contains several views like recursion tree, copy-model representation, stack and information about
input parameters.
TABLE I
CONCEPTUAL MODELS USED TO DISPLAY RECURSION
C
o
p
y
(v
ar
.)
C
o
p
y
(
co
d
e)
Tr
ac
e
R
ec
u
rs.
t
ree
A
ct
iv
.
tr
ee
C
o
n
tr
o
l
st
ac
k
C
o
lo
re
d
c
o
d
e
EROSI X
ETV X X X
Function Visualizer X X
Jeliot 3 X X X
KIEL X
RainbowScheme X X X
Recursion Animator X
SimRecur X X X
Most used conceptual models are copy-model and recursion tree as is shown in Table . Both of them are capable of showing how recursive programs are executed step by step and show the whole story of the execution. However, most programs chose only one or two models, so they offer a limited vision of recursion.
The previous programs work with animations, it is essential to make a representation for recursion. User can see step by step or in an automatic way how data are transmitted or calculated. However, just a few programs allow users to go backwards in order to repeat parts of the visualization.
Besides, interaction possibilities were not widely exploited by them. Sometimes ask for more information, move the animation to a determined point, or mark nodes may be interesting actions impossible to do with this programs. As we said, interaction makes easier learning tasks [22], so this is a gap that must be filled in order to improve how recursion can be shown and taught in educative environments.
D.Parsers visualization
different types of users. The first subgroup contains those tools which do not generate parsers but have a strict relationship with a specific language being able to display its behavior. Some examples could be: ICOMP [24], VisiClang [30], APA [33] and Tree Viewer [35]. In the second subgroup it could be those tools, which can generate parsers but their visualizations/animations are oriented for advance users. One example of these tools could be VCOCO [31]. Finally, in the third subgroup it could be those tools, which are able to generate both animations and parsers but any user can use their visualizations. Some examples of these tools could be LISA [27], VisualYacc [F128], ANTLRworks[12], Jaccie [23] and GYacc [25].
In Table is shown a summary of these tools analyzing their main characteristics.
TABLE II
SUMMARY OF SYNTAX ANALYSIS VISUALIZATIONS TOOLS. COLUMN PARSER TYPE INDICATES THE PARSER’S OUTPUT TYPE. COLUMNS ALGORITHM AND
TREE INDICATE IF THESE STRUCTURES ARE DISPLAYED. AVAILABILITY COLUMN INDICATES IF THE TOOL CAN DOWNLOAD.
P
ar
ser t
y
p
e
A
lg
o
ri
th
m
Tr
ee
G
en
er
at
io
n
A
v
ai
la
b
il
it
y
ICOMP LL(1) X X
VisiClang LL(1) Grammar
APA SLR/
LL(1) X X
Tree Viewer X
VCOCO LL(1) Grammar CocoR
AnaGram LALR(1) Grammar Own
CUPV LALR(1) X Cup
LISA SLR(1)/
LALR(1)/ LL(1)
X Own X
Visual Yacc LR X Yacc
ANTRLWorks LL(k) X ANTLR X
JACCIE LL(1)/
SLR(1)/ LALR(1)
X Own X
GYacc LALR(1) X Yacc
Analyzing Table we can see that all those tools, which can generate a parser, depends on an own notation or sometimes use a specific generation tool. This way of work makes difficult to use any of these tools with an educational aim because the visualizations are dependent of a generation tool.
As there do not exist any system, which implement all fundamental characteristics (algorithm, syntax tree, etc) for parser visualization, if we want to display a new dimension, it would be necessary to change both generation and visualization tools. From the students point of view it means to learn how to use two different tools with different characteristics: syntax, parser’s build process, understanding output messages (for example LR shift-reduce conflict). From the teacher point of view it means to get familiar with the new environment. As we can guess, this way of working may prevent teacher to use these tools in their lessons [28].
There exist other two aspects to take into account according to the described tools: educational evaluation and availability. Referring to the educational use of these tools, there do not
exist empirical data, which analyze the impact on the students learning process. Another aspect is the availability, so it is often difficult to get one on these tools.
III. SREC. ¿VISUALIZING RECURSION?
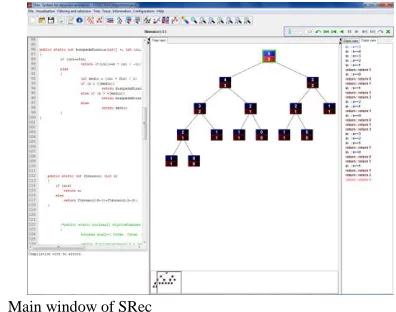
SRec [36][37][38] is a software application developed in order to provide animated and interactive visualizations about recursive Java-coded programs. SRec is aimed to help both students and teachers in algorithms courses. This software provides the visualizations generated in an automatic way, it means that users only provide the class and the method they want to run and the input parameters they want to use. SRec compiles the class, runs the program, saves the needed internal data and creates the visual representation of the views in a few seconds. After that, users can go step by step through the recursive execution (SRec does not advance sentence by sentence but opening or closing recursive calls at a time). Users can go forwards or backwards in an automatic or manual mode. Users can go step by step or skip all the steps until closing the current active node (the active node is the last opened recursive call so far).
SRec offers through its window, shown in Fig. 4, four different views at the same time. One of them (at the left) shows the source code of the Java class loaded by the users, where they can modify it, save it and recompile it again in order to add, delete, change or correct one or several sentences. The second view (located under the code view) is the compiler view, where users can see if the changes they wrote are right or generate some compilations errors.
When users create a visualization, two views are opened. These views show two different representations of the program at the same time and these representations can be changed through the tabs they contain. Every tab let see a different representation or conceptual model.
SRec offers three conceptual models for recursive programs. Users can access to the recursion tree through the "Tree" tab, where input parameters are shown in nodes, and activation tree (see Fig. 5), where every node contains input parameters and result values.
Fig. 4. Main window of SRec
view shows the unfinished calls and the dependence between them, it just contains a subset of the tree view nodes. The trace view contains a text line for every step the visualization has advanced so far. They are indented according to the depth level and the color is different for openings and closings operations.
Fig. 5. Activation tree generated by SRec for Fibonacci algorithm (input: 5)
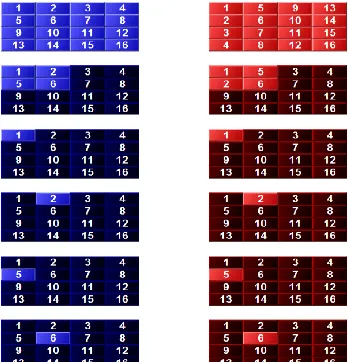
SRec provides two additional conceptual models for divide-and-conquer algorithms. These algorithms usually act on a data structure, dividing it in order to make a directly solvable problem. SRec supports arrays and matrixes, so it can represent them in an "extended" tree, where a small representation of the data structure is added to every node. Besides, two additional tabs are activated for showing a chronological view and a structure view.
Fig. 6. Chronological view (not complete) generated by SRec for divide-and-conquer algorithm (transposing a matrix).
The chronological view (see Fig. 6) shows all the statuses of the structure along the execution in a chronological order. At the left, input values are shown; at the right, returned values are displayed. User can see how the algorithm is working step by step on the different zones of the structure. The structure view (see Figure 7) always shows the current status of the structure, adding lines for arrays or boxes for matrixes below the structure for marking the affected areas by every unfinished call of the program. These views darken the areas affected by finished recursive calls and the areas not affected
by any already open call.
Figure 7: Structure view generated by SRec for binary search (searching for number 46)
The format of visualization is configurable. Colors for input parameters and output values in nodes, how source code is colored, location and separation of nodes in views, edges shape… can be configured by the user. This feature is important in order to adequate the visualization to different environments (monitor, projector, big or small screens, strong or weak illumination…).
SRec allows save on disk the current visualization. SRec can open it in another work session in a very fast way, just choosing the saved file. The visualization will be restored at the same point, with the same data, and the same format. This is a very useful functionality for teachers; they can load in a few seconds a lot of previously saved examples created by themselves.
IV. GENERAL VISUALIZATION MODEL AND VAST Once we have analyzed the general limitations of the parser’s visualization generation tools, we plan to create a system with the following objectives:
1) Independence from the parser generation tool.
Building an independent visualization tool would make easier to use it in educational context.
2) Display all fundamental structures. It should be
possible to display fundamental structures. New views should be added without effort.
3) Review of the educational impact. The generated
animations should improve or make easier the students learning process.
4) Availability. This tool should be easy to download.
5) Syntax error recovery. Generated animations
should display how the parser recovers from a syntax error.
6) Building generic syntax analysis visualizations.
Once analyzed the visualizations built by the generation tools of the compilation process, we present the design of a generic model to visualize/animate the compilation process. The main objective of this model is to set the base to develop a generic tool in order to solve the limitations found. The generic model can be divided in different independent submodels with certain functionalities.
Fig. 8. Generic model of animation
Submodel of language processing. The objective of this
submodel is to achieve the independence between the generation tools and the visualization tools. In this situation it is necessary to analyze the actions performed by the parsers during the execution in order to generate an intermeddle representation. Due to this intermeddle representation; it is necessary to insert extra information in the user's specifications. As result, this model should perform two different tasks:
1) Annotation process: modifications to get information during the parser's execution. This is usually performed in educational visualizations. The software platform does not determine if the annotation process is necessary or not. For example, to use the augmented reality it is needed to include new information in the real time image [47].
2) Generate a intermeddle representation.
As we have said in previous sections, as there exist different generation tools and different types of parsers, it is necessary to consider two different levels of independence. The first level has to be with working with different generation tools. The second level means that the model should be able to interpret the actions performed by the parsers.
Submodel of visualization. Using an annotated parser, its
execution allows to obtain an intermeddle representation containing the visual representation. The task of this submodel is to interpret this representation and build its visual representation. In the compilation process we can highlight some internals structures as the syntax tree, parser stack, etc. Due to this, the syntax tree is the main visualization built by this submodel. Besides, other structures as the input stream, the stack, grammar and the actions performed are displayed. All these views should be synchronized. One important characteristic of this model is the expandability, so it should be easy to add the visualization of a new structure.
Submodel of animation. Its main task is to animate the
static visualizations generated by the submodel of visualization. As one of the most important structures is the syntax tree, the main task of this submodel is to animate its building process keeping the synchronization between all views. The animation process should distinguish between LR and LL parser because the syntax tree and the stack have different behaviors. For a LR parser when it detects a terminal node it is added into the stack. If it detects a non terminal
node, it performs a reduction deleting nodes from the stack. When working with a LL parser, if a terminal node is detected, it is removed from the stack. For a non terminal node, a derivation is performed, which means that the rule's consequent is inserted into the stack.
Submodel of interaction. This submodel is responsible of
the interaction with the user. In order to this, we can distinguish two functionalities: make easier the animations creation and allow working with the generated visualizations.
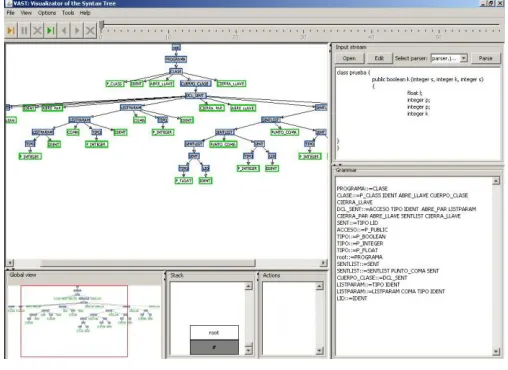
VAST. Visualizer of the Syntax Tree
VAST is the result of implementing the generic model of visualization and each submodel. In Fig. 9 we can see VAST's main window. The syntax tree is the main visualization. On the right we have the input stream and the parser grammar. In the bottom we have the parser's stack; the log for action performed (only used during the animation process) and a global view to navigate throw the syntax tree.
V.USABILITY-EDUCATIONAL EVALUATIONS
SRec and VAST have been subjected to several evaluations about usability and educational effectiveness. Next we summarize the processes and the obtained results.
A.Usability evaluation process for SRec
SRec has been evaluated five times about usability. The main principles used to develop SRec were: easy installation, easy learning to use it, and efficiency approach when user is working.
Fig. 9. VAST main user interface.
The basic schema of each evaluation session was:
- Teacher demonstration: the teacher shows to students how to create visualization from a source code for a few minutes.
- Familiarization tasks: students do some light tasks in order to get a first contact with SRec.
- Didactical exercise: one exercise must be done for the course using SRec. These exercises asked for analyzes, debugging, design or creation of an algorithm.
in order they to fill it with their opinion about SRec.
The fourth session was made using two days (taking data from both of them) and the last session took three classes (we took data only from the last day). ¡Error! No se encuentra el
origen de la referencia. contains the marks for several
general questions about SRec (the minimum value was 1 and the maximum value was 5).
TABLE III
SREC SCORES FROM USABILITY EVALUATIONS
S
ess
io
n
1
S
essi
o
n
2
S
essi
o
n
3
S
essi
o
n
4
S
essi
o
n
5
SRec is easy to use 3.88 4.50 4.20 4.19 3.94
General quality of SRec to analyze Recursion
3.38 4.29 4.00 - 3.84
I like SRec 3.63 4.26 3.95 3.98 3.84
Number of opinions 7 28 21 28/19 49
According to the ¡Error! No se encuentra el origen de la
referencia., marks were growing up while the same
functionality was improved (working in a more stable way and with a better interface), so marks were growing up from session 1 to session 2.
After that, new functionalities and possibilities were added, making harder how to learn to use SRec, and the asked tasks were more difficult too, so marks were lightly going down.
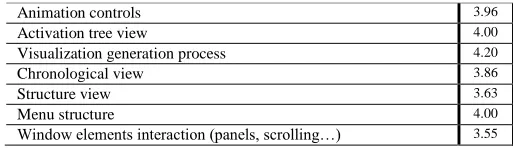
Table ¡Error! No se encuentra el origen de la referencia. contains the marks (fifth evaluation) for several important SRec features.
TABLE IV
OTHER SREC SCORES FROM USABILITY SESSIONS
Animation controls 3.96
Activation tree view 4.00
Visualization generation process 4.20
Chronological view 3.86
Structure view 3.63
Menu structure 4.00
Window elements interaction (panels, scrolling…) 3.55
The questionnaires gave some additional data through open questions. The suggestions made by students were changing in the different evaluation sessions, due to SRec was adding some previous suggestions and adding new functionalities. Some of them partially changed the way how SRec must be used and it could provoke some new issues and the lowering of the marks.
In the fifth evaluation, 30% of students did not provide any functional suggestion for SRec and only a third part of students would delete some functionality of SRec. When the questionnaire asked for the hardest parts to be learnt, 18.4% answered saying that SRec was easy to use (positive answers), and 49% did not answered the question; just 32.7% talked about dark aspects of SRec. 20.4% of students spontaneously
used SRec to study or to make activities for the course, as they say in the questionnaire.
B.VAST evaluation process
In case of VAST, once analysed different visualization tools we realized that none of them was evaluated in an educational way. As there do not exist empirical results, maybe those tools are used without adapting to students’ needs. From the educational point of view, they could have a negative impact in students’ learning process.
According to VAST, we divided the implementation process in different stages. Once finishing one stage we planned different evaluations of the generic model. Due to this, the evaluation process has been iterative, allowing adapting the functionalities to students needs. Two different types of evaluations have been executed: interactive-usability [3][4][5][9][6] and educational [2][7][8][3].
The interactive-usability evaluations had a double intention: evaluator observation and students opinion. The evaluator’s observation evaluations allowed to study and annote how students used the tool and detect the main problems. The opinion evaluations were focus on asking students about the experience when using the tools. Educational evaluations have allowed observing the impact on student’s learning process when using these tools. Due to this, we designed pre and post knowledge tests according to Bloom’s taxonomy. The methodology used is similar in all evaluations.
Although we have distinguished three different types of evaluations, they have been performed at the same time. This means that one educational evaluation consists of observations, usability tests and knowledge tests. For the usability and educational impact evaluations, students have been divided in different groups (control and treatment) [13] randomly. Groups were balanced using a knowledge pretest.
The first evaluation of VAST was focus on observing how students worked with the tool and the problems they had. In the second evaluation we compared VAST and ANTLRworks, obtaining results in favour ANTLRworks according to usability. In this case we got significant statistical differences in educational impact (synthesis level in Bloom’s taxonomy) in favour VAST. From these results we planned a global integration in VAST in order to improve its usability. Once finished the development we performed another usability evaluation. This process continued during all the development process.
VI. CONCLUSIONS AND FUTURE WORKS
This paper contains a review about software visualization aimed to students. They are not massively used in the classrooms and some causes were explained. Software visualization can be divided in several areas, and two of them were exposed in detail here: recursive programs and parsers.
software. There, SRec marks a difference with its interaction features and its wide range of visualizations for recursion.
SRec is totally functional; it allows improve teachers’ job, and students mostly like it. However, some ways to improve it have been discovered. The main future works are:
- Educational effectiveness evaluations for testing whether SRec really helps students to learn how recursion works.
- Interface simplification for making a more agile SRec. - Predictive mode for SRec, allowing students to fill
empty nodes with their expected values to check if they understood the algorithm they are visualizing.
- Enlarging the supported algorithm-design techniques in order to show specific views for them (dynamic programming, for example).
- Study several data taken from the fifth evaluation session about students’ usage in order to figure out how students work with SRec. This may make possible create students profiles and adapt SRec to them. About parsers’ visualization, this paper reviews some new methodologies focused on processors and compilers teaching. There are several software tools, catalogued into two main categories: tools with a theatrical aim for educational context and other software oriented to parsers development.
This second group contains three categories. The first one is for software aimed only to visualize how a parser behaves, not to generate it. The second one contains software that can generate parsers and their visualizations are oriented to advanced users. The last category is for software able to generate both animations and parsers to a wide target of users.
The main drawback for these software tools is that they depend on a generation tool, so it is difficult to use them in an educational environment, so students have to use two different tools to understand the whole process and teachers may be reluctant to use these tools for their classes. Here is where VAST changes the paradigm.
The development process with VAST has not finished. We plan to finish the integration of syntax error recovery visualization. As described in bibliography, the syntax error recovery is usually known as a “black art” [1]. From the students’ point of view, it is one of the most difficult parts to understand in parser construction. So, if a system can display this process, maybe students can learn it easily.
REFERENCES
[1] Aho, A.V., Lam, M.S., Sethi, R., Ullman, J.D. (2007). Compilers:
Principles, Techniques, and Tools, Prentice Hall.
[2] Almeida-Martínez, F.J., Urquiza-Fuentes, J. (2009). Long term
evaluation using VAST. Technical report. Universidad Rey Juan Carlos, 2009 1988-8074, 2011-13.
[3] Almeida-Martínez and Urquiza-Fuentes, J. (2011). Building LL(1)
grammars and parsers using VAST and ANTLR. Technical report. Universidad Rey Juan Carlos, 2011 1988-8074, 2011-10.
[4] Almeida-Martínez, F.J., Urquiza-Fuentes, J. (2011). Preliminary
evaluation of the syntax error recovery visualization using VAST. Technical report. Universidad Rey Juan Carlos, 2011 1988-8074, 2011-08.
[5] Almeida-Martínez, F.J., Urquiza-Fuentes, J. (2011). VAST. Evaluation
of the execution-visualization functional integration. Technical report. Universidad Rey Juan Carlos, 2011 1988-8074, 2011-07.
[6] Almeida-Martínez, F.J., Urquiza-Fuentes, J. (2009). Teaching LL(1)
parsers with VAST- An Usability Evaluation. Technical report. Universidad Rey Juan Carlos, 2009 1988-8074, 2009-01.
[7] Almeida-Martínez, F.J., Urquiza-Fuentes, J., Pérez-Carrasco, A. (2011).
Syntax error recovery visualization. Evaluation using VAST and Cup. Technical report. Universidad Rey Juan Carlos, 2011 1988-8074, 2011-12.
[8] Almeida-Martínez, F.J., Urquiza-Fuentes, J., Pérez-Carrasco, A. (2011).
Building LR(1) grammars and parsers using VAST and Cup. Technical report. Universidad Rey Juan Carlos, 2011 1988-8074, 2011-11.
[9] Almeida-Martínez, F.J., Urquiza-Fuentes, J., Pérez-Carrasco, A. (2011).
Building LL(1) parsers with VAST. Second usability and educational evaluation. Technical report. Universidad Rey Juan Carlos, 2011 1988-8074, 2011-06.
[10] Ben-Bassat, R., Ben-Ari, M., Uronen, P.A. (2003). “The Jeliot 2000
program animation system”. Computers & Education, 40(1), pp.1-15.
[11] Berghammer, R., Milanese, U. (2001). “KIEL: A computer system for
visualizing the execution of functional programs”. Proceedings of the International. Workshop on Functional and (Constraint) Logic Programming 2001, Technical. Report No. 2017, pp. 365-368, Kiel, Germany: University of Kiel.
[12] Bovet, J., Parr, T. (2008). ANTLRWorks: an antlr grammar
development environment. Software: Practice and Experience, 38(12):1305–1332.
[13] Cohen, L., Manion, L., Morrison, K. (2000). Research Methods in
Education. RoutledgeFalmer, 2000.
[14] Dale, N.B., Weems, C. (1991): “Pascal”, 3rd ed. Lexington, MA: D.C.
Heath.
[15] Dershem, H.L., Erin Parker, D., & Weinhold, R. (1999): “A Java
function visualizer”. Journal of Computing in Small Colleges, Vol. 15.
[16] García Osorio, C., Gómez-Palacios, C., García-Pedrajas, N. (2008). A
Tool for Teaching LL and LR Parsing Algorithms. In ITiCSE ’08: Proceedings of the 13th Annual Conference on Innovation and Technology in Computer Science Education, pages 317–317, New York, NY, USA. ACM.
[17] García Osorio, C., Mediavilla Sáiz, I., Jimeno Visitación, J., García
Pedrajas, N. (2008). Teaching Push-Down Automata and Turing Machines. In ITiCSE ’08: Proceedings of the 13th Annual Conference on Innovation and Technology in Computer Science Education, pages 316–316, New York, NY, USA. ACM.
[18] George, C.E. (2000). “EROSI: Visualising recursion and discovering
new errors”. Proceedings of the 31st SIGCSE Technical Symposium on Computer Science Education, SIGCSE’00, pp. 305-309, New York, ACM Press
[19] Haynes, S.M. (1995): “Explaining recursion to the unsophisticated”.
ACM SIGCSE Bulletin, Vol. 27(3), pp. 3-6 y 14.
[20] Hundhausen, C.D., Douglas, S.A., Stasko, J.T. (2002) A Meta-Study of
Algorithm Visualization Effectiveness. Journal of Visualization Langauge and Computer animation, 13(3):259–290.
[21] Jehng, J.-C.J., Tung, S.-H.S. & Chang, C.-T. (1999): “A visualization
approach to learning the concept of recursion”. Journal of Computer Assisted Learning, Vol. 15, pp. 279-290.
[22] Kehoe, C., Stasko, J., Taylor, A. (2001): “Rethinking the evaluation of
algorithm animations as learning aids: an observational study”. International Journal of Human-Computer Studies, Vol. 54(2), pp. 265– 284.
[23] Krebs, N., Schmitz, L. (2004). Jaccie Handbook. UniBw München.
[24] Kristy, A., Robert, H., Wayne, Y. (1998). Design and implementation of
the UW illustrated compiler. In PLDI ’88: Proceedings of the ACM SIGPLAN 1988 conference on Programming Language Design and Implementation, pages 105–114, New York, NY, USA. ACM.
[25] Ledgard, H.F. (1971). Ten mini-languages: A study of topical issues in
programming languages. ACM Computing Surveys, 3(3):115–146.
[26] Lovato, M.E., Kleyn, M.F. (1995). Parser visualizations for developing
grammars with yacc. In SIGCSE ’95: Proceedings of the twenty-sixth SIGCSE technical symposium on Computer science education, pages 345–349, New York, NY, USA. ACM.
[27] Mernik, M., Zumer, V. (2003). An educational tool for teaching
compiler construction. In IEEE Transactions on Education, volume 46, pages 61–68.
[28] Naps, T.L., Rossling, G., Almstrum, V., Dann, W., Fleischer, R.,
Computer Science Education, pages 131–152, New York, NY, USA, 2002. ACM.A. ACM.
[29] Pareja, C., Urquiza, J., Velázquez, J. Á. (2007): “WinHIPE: an IDE for
functional programming based on rewriting and visualization”. ACM SIGPLAN Notices, Vol. 42(3), pp. 14–23.
[30] Resler, D. (1990). VisiCLANG. A Visible Compiler for CLANG. ACM
SIGPLAN Notices, 25(8):120–123.
[31] Resler, D., Deaver, D. (1998). VCOCO: A Visualisation Tool for
Teaching Compilers. In ITiCSE ’98: Proceedings of the 6th annual Conference on the Teaching of Computing and the 3rd annual Conference on Integrating Technology into Computer Science Education, pages 199–202, New York, NY, USA. ACM.
[32] Rodger, S.H., Lim, J., Reading, S. (2007). Increasing interaction and
support in the formal languages and automata theory course. In ITiCSE ’07: Proceedings of the 12th annual SIGCSE conference on Innovation and technology in computer science education, pages 58–62, New York, NY, USA, 2007. ACM.
[33] Sami, K., Yanti, S. (1998) Animating parsing algorithms. In SIGCSE
’98: Proceedings of the twenty-ninth SIGCSE Technical Symposium on Computer Science Education, pages 232–236, New York, NY, USA. ACM.
[34] Terada, M. (2005): “ETV: a program trace player for students”.
Proceedings of the 10th Annual SIGCSE Conference on Innovation and Technology in Computer Science Education, ITiCSE’05, pp. 118-122, New York, ACM Press.
[35] Vegdahl, S.R. (2000). Using visualization tools to teach compiler
design. In Proceedings of the second annual CCSC on Computing in Small Colleges Northwestern conference, pages 72–83, US. Consortium for Computing Sciences in Colleges.
[36] Velázquez, J. Á., Pérez, A., Urquiza, J. (2008): “A design of automatic
visualizations for divide-and-conquer algorithms”. Electronic Notes in Theoretical Computer Science (2009), Vol. 224. Proceedings V Program Visualization Workshop (PVW 2008).
[37] Velázquez, J. Á., Pérez, A., Urquiza, J. (2009): “Interactive visualization
of Recursion with SRec”. 14th ACM-SIGCSE Annual Conference on Innovation and Technology in Computer Science (ITICSE 2009), póster.
[38] Velázquez, J. Á., Pérez, A., Urquiza, J. (2008): “SRec: An animation
system of recursion for algorithm courses”. 13rd ACM-SIGCSE Annual Conference on Innovation and Technology in Computer Science (ITICSE 2008), pp.225-229.
[39] White, E., Sen, R., Stewart, N. (2005) Hide and show: using real
compiler code for teaching. In Proceedings of the 36th SIGCSE technical symposium on Computer science education, SIGCSE ’05, pages 12–16, New York, NY, USA. ACM.
[40] Wilcocks, D., & Sanders, I. (1993): “Animating recursion as an aid to
instruction”. Computers & Education, Vol. 23, pp. 221-226.
[41] Wirth, N. (1976): “Algorithms + Data Structures = Programs”.
Englewood Cliffs, NJ: Prentice Hall (1976).
[42] Wu, C.-C., Dale, N.B., & Bethel, L.J. (1998): “Conceptual models and
cognitive learning styles in teaching recursion”. Proceedings of the 29th SIGCSE Technical Symposium on Computer Science Education, SIGCSE’98, pp. 292-296, New York, ACM Press.
[43] Wu, C.-C., Lee, Lin, J.M.-C., & Hsu I.Y-W. (1996): “Closed
laboratories using SimList and SimRecur”. Computers & Education, Vol. 28, pp. 55-64.
[44] Elizabeth L. White, Jeffrey Ruby, and Laura Denise Deddens. Software
visualization of lr parsing and synthesized attribute evaluation. Software: Practice and Experience, 29(1):1–16, 1999.
[45] J.A.Cortés, and J.O.Lozano, Social Networks as Learning Environments
for Higher Education, International Journal of Artificial Intelligence and Interactive Multimedia, vol. 2, issue Special Issue on Multisensor User Tracking and Analytics to Improve Education and other Application Fields, no. 7, pp. 63-69, 09/2014.
[46] Lorezo, W., R. Gonzalez-Crespo, and A. Castillo-Sanz, A Prototype for
linear features generalization, International Journal of Artificial Intelligence and Interactive Multimedia, vol. 1, issue A Direct Path to Intelligent Tools, no. 3, pp. 59-65, 12/2010.
[47] Neri, R. B., G. M. Lopez, H. Bolivar-Baron, and R. Gonzalez-Crespo,
Annotation and Visualization in Android: An Application for Education and Real Time Information, International Journal of Interactive Multimedia and Artificial Intelligence, vol. 2, issue Regular Issue, no. 2, pp. 7-12, 06/2013.
[48] H. Bolivar-Baron, R. Gonzlález-Crespo, J. Pascual-Espada and O.
Sanjuán-Martínez, Assessment of learning in environments interactive
through fuzzy cognitive maps, Soft Computing, vol 19, issue 4, pp. 1037-1050.
Francisco Javier Almeida-Martínez was born in 1984 Las Palmas, Spain. He graduated in Computer Science in 2007
in Rey Juan Carlos University, Spain.In 2011 finished his
PhD in software visualization in the Rey Juan Carlos University. Nowadays he works as a Software Engineer for payment services and at La Rioja International University as a lecturer.