Dynamic Respone of RCC High Rise Building
for Different Types of Sub-structure System
Vrutanki Ramteke
1, Amey R. Khedikar
21
M-Tech Research Scholar (Structure), Civil Engineering Department, Tulsiramji
Gaikwad-Patil Collegge of Engg. And Tech., Mohgaon, Nagpur, M.H. India
2
Asst. Professor, Civil Engineering Department, Tulsiramji Gaikwad-Patil Collegge of Engg. And Tech.,
Mohgaon, Nagpur, M.H. India.
[email protected]
Abstract:
This research work focuses on comparison of seismic analysis of G+15 building stiffened with soil interaction.. The performance of the building is analysed in Zone IV. The study include soil interaction for three different soil hard ,medium ,soft by fixed conventional method, FEMA 356, Wrinkler spring analysis. The study is extended for isolated footing and raft foundation . The analysed structure symmetrical,G+15,ordinary RC moment-resisting frame(OMRF). Modellimg of the structure is done as per Staad pro.V8i software. The lateral seismic forces of RC frame is carried out using dynamic static method as per IS 1893:2016 for earthquake zone. The scope of present work is to understand that the structure need to have suitable earthquake resisting features for different soil conditions. The result of the performance and the analysis of the model are the graphically represented and also in a tabular form and is compared for determining the best performance of building against lateral stiffness by arrangement of three different types of soil. A comparative analysis is done in term of base shear, displacement.
Keywords
Response Spectrum, Base Shear , Displacement.
1. Introduction
Th Earthquake is known to be one of the most destructive phenomenon experienced on earth . It is caused due to a sudden release of energy in the earth’s crust which results in seismic waves. When the seismic waves reach the foundation level of the structure, it experiences horizontal and vertical motion at ground surface level. Due to this, earthquake is responsible for the damage to various man-made structures like buildings, bridges, roads, dams, etc. It also causes landslides, liquefaction, slope-instability and overall loss of life and property. Most of the time earthquakes are caused by the slippage along a fault in the earth’s crust. When the fault ruptures in the earth’s crust, the seismic waves
will travel away from the source known as focus, in all direction to the ground surface. As they travel through different geological materials, the waves are reflected and refracted. Throughout the whole journey from the bedrock to the ground surface, the waves may experience amplification [1]. Seismic wave amplification may cause large acceleration to be transferred to the structures, especially when the resulting seismic wave frequencies match with the structure resonant frequencies. This phenomenon may result in catastrophic damages and losses. Thus, with respect to the possible risk of earthquake hazard, it is essential to estimate the peak ground acceleration at the ground surface in order to produce appropriate response spectra for the purpose of structural design and structural safety evaluation. An earthquake is a ground vibration due to the rapid release of energy.
Though the structures are supported on soil, most of the designers do not consider the soil structure interaction and its subsequent effect on structure during an earthquake. Different soil properties can affect seismic waves as they pass through a soil layer. When a structure is subjected to an earthquake excitation, it interacts the foundation and soil, and thus changes the motion of the ground. It means that the movement of the whole ground structure system is influenced by type of soil as well as by the type of structure [3].Tall buildings are supposed to be of engineered construction in sense that they might have been analyzed and designed to meet the provision of relevant codes of practice and building bye-laws. IS 1893: 2016 “Criteria for Earthquake Resistant Design of Structures” gives response spectrum for different types of soil such as hard, medium and soft soil.s
accepted structural damages but no collapse [4].The method of analysis commonly used by structural engineers assumes the structure to be attached rigidly to the ground, but as the foundation of the structure rests on the soil, it is apparent that the response depends on the properties of the structure as well as the soil. Hence the method of analysis based on soil-structure interaction gives more realistic and reasonable results.
1.1 Soil-Structure Interaction (SSI)
Soil-Structure Interaction (SSI) is phenomena in the response of structures caused by the flexibility of the foundation soils, as well as in the response of soils caused by the presence of the structures. Analytic and numerical models for dynamic analysis typically ignore SSI effects of the coupled in nature structure foundation-soil system. It has been recognized that SSI effects may have a significant impact especially in cases involving heaiver structures rest on soft soil condition.
2. Objective Of Study
Study of soil structure interaction due to seismic load with different types of soil viz. hard, medium, soft using software consisting FEMA356 and wrinkle analysis.
3. Problem Formulation
RCC Frames with G+15 have been considered in the study. Fundamental period of vibration of the frame with fixed support using codal formula in IS 1893(Part I):2016 and model analysis has been evaluated. In order to understand the effect of soil structure interaction on fundamental period of vibration soil has been modeled as Winkler spring and Fixed base model using STAAD .Pro. Response spectra method of analysis of the models are performed using STAAD Pro. Effects of soil interaction on different parameters are studied i.e. Natural Time Period, Roof Displacement, Shear force and Bending moment.
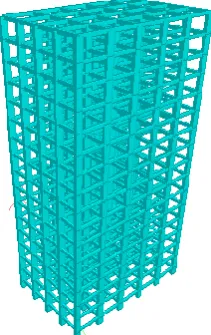
3.1 Models Model Of The Project
Model 1: Fixed based hard soil
1.1
Data for All Models
Table 1. Gravity loads Assigned to RC Building
.
No. of stories 15
Floor to Floor
Height 3000mm
Beam size 500*300mm
Column size: Hard
Medium
Soft
1000*500mm
1200*600mm
1300*600mm
Thickness of slab 125mm
Density of
concrete 25kN/m
3
Soil Type Hard, Medium, Soft
Zone Factor (Z) 0.24
Important factor
(I) 1.2
Response reduction factor (R)
3
Grade of Concrete M35
Table 2. Gravity Loads Assigned to RC Building
Gravity Load Value
Slab Load (dead
load) 3.75 kN/ m
2
Floor Finish 1.0 kN /m2
Roof Finish 1.0 kN/m2
Live Load 2.5kN/m2
Roof Live 1.5kN/m2
Wall Load 13.8kN/m
Table 3. Foundation size for isolated footing and raft footing.
Soil Type Isolated footing Raft footing
Hard soil L=4.8m
B=4.3m d=0.6m D=1.5m L=32m B=21m d =0.6m D=1.5m
Medium soil L=6m
B=5.4m d =0.7m D=1.5m L=40m B=26m d =0.7m D=1.5m
Soft soil L=7.84m
B=7.14m d=0.8m D=1.5m L=53m B=34m d=0.8m D=1.5m
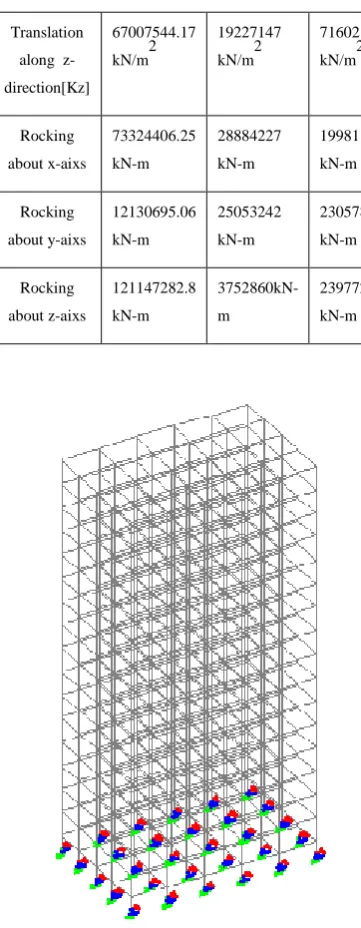
Table 4. Calculation of FEMA 356 spring constraints for isolated footing.
Degree of
freedom
Hard Soil Medium
Soil
Soft Soil
Translation
along
x-direction [Kx] 60355462.02 kN/m2 14844913 kN/m2 4965737.7 kN/m2 Translation
along
y-direction[Ky] 45428320.41 kN/m2 14709186 kN/m2 5378429.7 kN/m2 Translation
along
z-direction[Kz] 67007544.17 kN/m2 19227147 kN/m2 7160214.4 kN/m2 Rocking about x-aixs 73324406.25 kN-m 28884227 kN-m 19981192 kN-m Rocking about y-aixs 12130695.06 kN-m 25053242 kN-m 23057858 kN-m Rocking about z-aixs 121147282.8 kN-m 3752860kN-m 23977208 kN-m
MODEL 2 OF FEMA356 Isolated Footing With Different Type Of Soil.
Table 5. Calculation of FEMA 356 spring constraints for raft
footing.
Degree of
freedom Hard Soil Medium Soil Soft Soil
Translation
along
x-direction [Kx] 998035.7 kN/m2 216785.4545 kN/m2 24681.6 7kN/m2 Translation
along
Translation
along
z-direction
[Kz]
11808257
kN/m2
177303.159
kN/m2
45265.9
6kN/m2
Rocking
about
x-aixs
355957kN-m
8411.5384
kN-m
2147488
kN-m
Rocking
about
y-aixs
33204.61
kN-m
7846.5042
kN-m
2003.23
3 kN-m
Rocking
about
z-aixs
33341.18k
N-m
6828.27325k
N-m
1475.08
kN-m
Model 3 of Raft footing
Table 6 Calculation for wrinkler spring in isolated footing
Model Soil Type
SBC
(kN/m2) Load(kN)
Subgrade modulus
(kN/m2)
Hard
Soil 250 142 14200
G+15 Medium
Soil 180 121.5 12150
Soft Soil 110 75.603 7560.3
Model 4 Wrinkler fixed spring
Table 7 Calculation for wrinkler spring in Raft footing
Model Soil Type
SBC
(kN/m2) Load(kN)
Subgrade modulus
(kN/m2)
Hard
Soil 250 64.5 6450
G+15 Medium
Soil 180 48.6 4860
Soft
Soil 110 30.8 3080
4. Result And Discussion
Response Spectrum Analysis is carried out for Bare Farme. The models are checked for base shear and maximum top displacement.
Chart 2 Comparison of Base shear in X Direction for different type of soil.
Chart 3 Comparison of Base shear in Z direction for different type of soil.
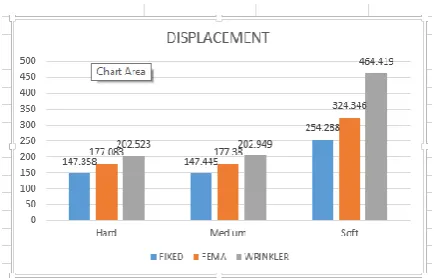
Chart 4. Comparison of Top Storey Displacement Raft footing for different type of soil interaction.
Chart 5 Comparison of Base shear in X Direction for different type of soil.
Chart 6 Comparison of Base shear in Z direction for different type of soil.
1. From chart 1 , found that the displacement in the isolated footing of soft soil is much higher then then hard and medium soil by using the method of FEMA356 and Wrinkler spring analysis.
2. From chart 2 found that base shear in X direction of isolated footing is increasing in the medium soil through FEMA 356 analysis as compared to hard and soft soil.
3. From chart 3,base shear in Z direction is increasing in medium soil whereas in soft soil the shear is increasing through Wrinkler analysis.
4. From chart 4, found that displacement in raft footing is higher in soft soil by wrinkle analsiys.
fixed medium soil by FEMA356 analysis whereas in soft soil shear is higher by wrinkle analysis
5. Conclusion
1. Wrinkler spring shows the maximum displacement than fixed based method and FEMA356 analysis.
2. Hard soil shows the minimum and soft soil shows maximum displacement.
3. Percentage of reduction is 15-30% variation in displacement by Wrinkler method than fixed and FEMA356 analysis.
6. References
[1] NithyaChandran J, AbhilashRajan Soni Syed, “Seismic Analysis of Building with Underground
Stories Considering SoilStructure Interaction.” International Journal of Emerging Technology and Advanced Engineering Volume 4, Issue 11,November 2014
[2] G. Saad, F. Saddik& S. Najjar, “Impact of Soil Structure Interaction on the Seismic Design of Reinforced Concrete Buildingswith Underground Stories.” American University of Beirut, Lebanon 2012
[3] Tuladhar, R., Maki, T., Mutsuyoshi, H. “Cyclic behavior of laterally loaded concrete piles embedded into cohesive soil,Earthquake Engineering & Structural Dynamics” Vol. 37 (1), pp. 43-59,2008
[4] Jinu Mary Mathew, Cinitha A, Umesha P K, Nagesh R Iyer and Eapen Sakaria3, “Seismic Response of Rc Building byConsidering Soil Structure Interaction.” ISSN 2319-6009, Vol. 3, IJSCER, 2014
[5] Shiji P.V, Suresh S., Glory Joseph, “Effect of Soil Structure Interaction in Seismic Loads of Framed Structure.” InternationalJournal of Scientific & Engineering Research, Volume 4, Issue 5, May-2013
[6] IS 1893(part 1):2002-Criteria for earthquake resistant design of structures.-General provisions and Buildings, Bureau of India Standards, New Delhi.
[7] IS 456:2000: Indian standard code of practice for plain andreinforced concrete, Bureau of Indian Standards, New Delhi,India
[8] ATC40,Seismic Evaluation and Retrofit of ConcreteBuildings, Applied Technology Council,1996.
[9] Federal Emergency Management Agency(FEMA),Prestandard and Commentary for the Rehabilitationof Buildings,FEMA-356,2000
[10] Federal Emergency Management Agency (FEMA), NEHRPGuidelines for the Seismic Rehabilitation ofBuildings,FEMA-273,1997.
[11] George Gazetas (1991) Member, ASCE, “Formulas and chartsfor impedances of surface and embedded foundations.”