R E S E A R C H
Open Access
t-tests, non-parametric tests, and large
studies—a paradox of statistical practice?
Morten W Fagerland
Abstract
Background: During the last 30 years, the median sample size of research studies published in high-impact medical journals has increased manyfold, while the use of non-parametric tests has increased at the expense of t-tests. This paper explores this paradoxical practice and illustrates its consequences.
Methods: A simulation study is used to compare the rejection rates of the Wilcoxon-Mann-Whitney (WMW) test and the two-sample t-test for increasing sample size. Samples are drawn from skewed distributions with equal means and medians but with a small difference in spread. A hypothetical case study is used for illustration and motivation.
Results: The WMW test produces, on average, smallerp-values than the t-test. This discrepancy increases with increasing sample size, skewness, and difference in spread. For heavily skewed data, the proportion ofp<0.05 with the WMW test can be greater than 90% if the standard deviations differ by 10% and the number of observations is 1000 in each group. The high rejection rates of the WMW test should be interpreted as the power to detect that the probability that a random sample from one of the distributions is less than a random sample from the other distribution is greater than 50%.
Conclusions: Non-parametric tests are most useful for small studies. Using non-parametric tests in large studies may provide answers to the wrong question, thus confusing readers. For studies with a large sample size, t-tests and their corresponding confidence intervals can and should be used even for heavily skewed data.
Keywords: T-test, Non-parametric test, Wilcoxon-Mann-Whitney test, Welch test, Sample size, Statistical practice
Background
In an article published in the New England Journal of Medicine (NEJM) in 2005, Horton and Switzer review the use of statistical methods in three volumes of the NEJM in 2004 and 2005 [1]. They divide the methods into 25 categories—sorted according to increasing complexity— and list the frequencies in each category. Also included are the results from previous surveys of articles published in the same journal in 1978–1979 and in 1989. Table 1 presents the proportions of articles that contained t-tests and non-parametric tests. At all three time points, t-tests or non-parametric tests or both were used in more than half of the articles. In 1978–1979, four t-tests were used for every non-parametric test. In 2004–2005, t-tests and non-parametric tests were used with equal frequency.
Correspondence: [email protected]
Unit of Biostatistics and Epidemiology, Oslo University Hospital, Oslo, N-0407, Norway
Let us compare this trend in the use of simple statis-tical methods with another development. Martin Bland [3] considers the median sample size of research reports published in the Lancet and the BMJ that used individual subject data. In September 1972, the median sample sizes were 33 and 37, and in September 2007, they were 3116 and 3104. Thus, during a similar time span as in Table 1, the sample size increased almost 100 fold.
If we assume that the NEJM is similar to the Lancet and the BMJ as regards statistical methods and sample size, research authors that publish in these high-impact medical journals have increase their use of non-parametric tests at the expense of t-tests as their studies have increased in size.
This, to me, is counterintuitive.
t-tests are parametric tests, which assume that the underlying distribution of the variable of interest is nor-mally distributed. Consider the two-sample t-test. It is fairly robust to deviations from normality [4], and—by the
Table 1 Trends in the use of t-tests and non-parametric tests in the NEJM
Statistical procedure 1978–1979 1989 2004–2005
t-tests∗ 44% 39% 26%
Non-parametric tests† 11% 21% 27% ∗one-sample, two-sample, and matched-pair [2].
†Wilcoxon-Mann-Whitney, sign, and Wilcoxon signed rank sum [2].
central limit theorem—increasingly so when the sample size increases. When the sample size of a study is 200, the t-test is robust even to heavily skewed distributions [5].
Non-parametric tests, as defined in Table 1, have, broadly speaking, two applications. First, as simple meth-ods to analyze ordinal data, such as degree of pain clas-sified as none, mild, moderate, or severe. Second, as alternatives to parametric tests, most often used when there is evidence of non-normality. This latter practice is advocated in many basic textbooks, such as Refs. [6-9].
In their capacity as alternatives to t-tests, non-parametric tests are thereby most useful when the sample size is small. One would, then, expect to observe an increase in the ratio of t-tests to non-parametric tests as studies grow in size. Instead, the opposite has occurred. The purpose of this paper is to illustrate the conse-quences of uncritical use of non-parametric tests for large studies and to discuss some possible explanations for this practice.
Methods
Suppose that we want to compare the means or medians of a continuous variable in two independent groups. Two tests are often used for this problem: the (two-sample) t-test and the Wilcoxon-Mann-Whitney (WMW) rank sum test. The t-test is a test for the hypothesis of equal means, whereas the WMW test is less specific. If the underly-ing distributions of the variable in the two groups differ only in location, i.e. in means and medians, the WMW test is a test for the hypothesis of equal medians. For all other situations, the null hypothesis of the WMW test
is Prob(X<Y)=0.5, whereX andY are random sam-ples from the two distributions. Interpretation of a small
p-value in this case is not always straightforward.
A difference in means or medians is usually accompa-nied by a difference in spread [10,11]. The WMW test is sensitive to distribution differences besides location [11] and may give a small p-value based on differences in spread even when the means and medians are equal.
A simulation study was carried out to compare the rejec-tion rates of the t- and WMW tests for increasing sample size. Due to its superior properties [5], the t-test adjusted for unequal variances—hereafter simply referred to as the t-test, though it is often called the Welch U test—was used. The Brunner-Munzel test, a non-parametric test that adjusts for unequal variances, may be used as an alternative to the WMW test. It is not widely available in software packages, performs similarly to the WMW test [11], and is not included in the simulation study. The data were drawn at random from skewed gamma and lognor-mal distributions. The amount of skewness varied, in four steps, from small (coefficient of skewness = 1.0) to con-siderable (skewness = 4.0) and was always equal in both distributions, as were the means and medians. The only difference between the two distributions was in standard deviations, which differed, in eight steps, from 5% (ratio of 1.05) to 50% (ratio of 1.50). The nominal significance level was 5% and 10 000 replications were used.
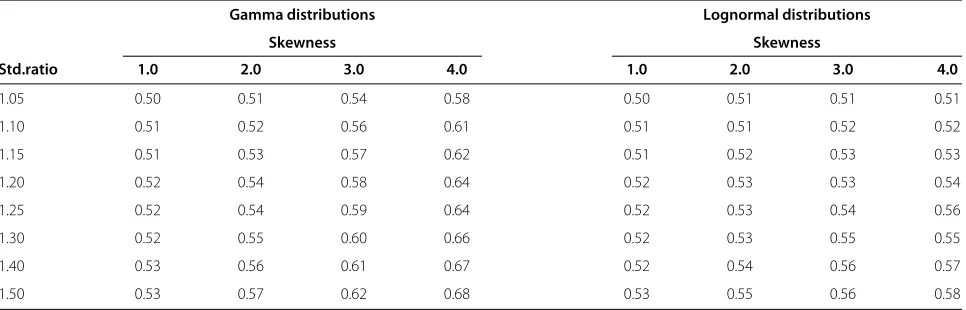
Table 2 gives the true Prob(X<Y) for each scenario in the simulation study. Since the null hypothesis of the WMW test is Prob(X<Y)=0.5, we expect the rejection rates of the WMW test to exceed the nominal significance level whenever Prob(X<Y) >0.5. That is, the rejection rates of the WMW test represent the power to detect Prob(X<Y)=0.5.
Results Case study
Consider Figure 1, which is a plot of the probability density functions of two gamma (left panel) and two lognormal
Table 2 The true Prob(X<Y)for each scenario in the simulation study
Gamma distributions Lognormal distributions
Skewness Skewness
Std.ratio 1.0 2.0 3.0 4.0 1.0 2.0 3.0 4.0
1.05 0.50 0.51 0.54 0.58 0.50 0.51 0.51 0.51
1.10 0.51 0.52 0.56 0.61 0.51 0.51 0.52 0.52
1.15 0.51 0.53 0.57 0.62 0.51 0.52 0.53 0.53
1.20 0.52 0.54 0.58 0.64 0.52 0.53 0.53 0.54
1.25 0.52 0.54 0.59 0.64 0.52 0.53 0.54 0.56
1.30 0.52 0.55 0.60 0.66 0.52 0.53 0.55 0.55
1.40 0.53 0.56 0.61 0.67 0.52 0.54 0.56 0.57
0 1 2 3 4 5 0
0.5 1 1.5 2
Probability density
Gamma distributions
pdf for X pdf for Y
0 1 2 3 4 5
0 0.1 0.2 0.3 0.4 0.5 0.6 0.7 0.8
Probability density
Lognormal distributions
pdf for X pdf for Y
Figure 1Probability density functions (pdf) of two gamma (left panel) and two lognormal (right panel) distributions.The two distributions in each panel are equal, except that the standard deviation ofXis 10% greater than that ofY.
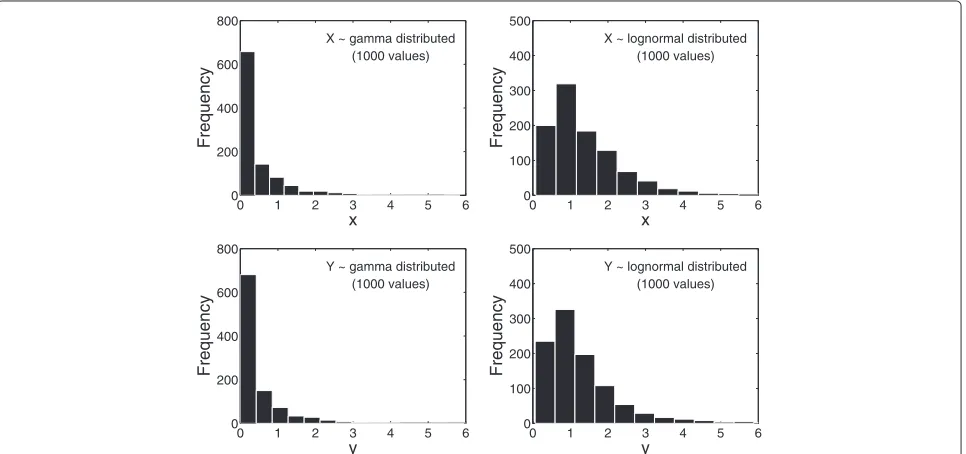
(right panel) distributions. The coefficient of skewness is 3.0 for all distributions, and the means and the medians of the two distributions in each panel are equal. The standard deviation of the distributions corresponding to the solid lines (X) are 10% greater than that of the distributions corresponding to the dotted lines (Y). That difference is almost imperceptible for the two gamma distributions.
Suppose that we draw, at random, 1000 values from each of these four distributions. The results might look like that of Figure 2. Since we, in an actual study, obviously do not know the exact distributions from which the observed data originate, it is histograms such as these that give us a clue about the underlying distributions of the data. The data in Figure 2 are markedly skewed to the right, and we may be tempted to use the WMW test instead of the t-test to compare the locations ofXandY.
If we repeatedly draw samples of size 1000 from the dis-tributions in Figure 1, we can apply the t- and WMW tests
to the samples each time and record the results. After 10 000 replications, the 5% rejection rates (the propor-tion of timesp<0.05) were 5.1% (gamma distributions) and 4.9% (lognormal distributions) for the t-test. The expected rejection rate for an unbiased test of means or medians is 5.0%, that is, a one in 20 chance of a signif-icant result when the means (and medians) are known to be equal. The t-test thus performs quite well. The rejection rates for the WMW test are 99% (gamma distri-butions) and 28% (lognormal distridistri-butions). The WMW test indicates a significant difference between the groups more often than the expected 5%. The explanation is that the two distributions are slightly different: their means and medians are equal but their standard deviations dif-fer by 10%. The WMW test is sensitive to this difference and produces a smallp-value. But, if we are interested in comparing the means or the medians—as is customary— the WMW test most likely gives us an answer to the
0 1 2 3 4 5 6 0
200 400 600 800
x
Frequency
X ~ gamma distributed (1000 values)
0 1 2 3 4 5 6 0
100 200 300 400 500
x
Frequency
X ~ lognormal distributed (1000 values)
0 1 2 3 4 5 6 0
200 400 600 800
y
Frequency
Y ~ gamma distributed (1000 values)
0 1 2 3 4 5 6 0
100 200 300 400 500
y
Frequency
Y ~ lognormal distributed (1000 values)
wrong question. The correct question for the WMW test can be formulated as: Is a random sample from one of the distributions likely to be less than a random sample from the other distribution? The skewness and standard deviation ratio of the two distributions in Figure 1 are 3.0 and 1.10, respectively. We thereby obtain the actual probability of Prob(X<Y) from Table 2, which is 56% for the gamma distributions and 52% for the lognor-mal distributions. The high rejection rates of the WMW test (99% and 28%) represent the power of the WMW test to detect that those probabilities are unequal to 50%.
If we repeat the above exercise for a range of sample size values, we can plot the rejection rate against the number of subjects in each group (Figure 3). The rejection rates of the WMW test increase as the sample size increases, whereas the rejection rates of the t-test are stable at about 5%.
Overall results from the simulation study
The patterns of rejections rates in Figure 3 persist for all combinations of skewness and standard deviation ratios considered in this study. The rejection rates of
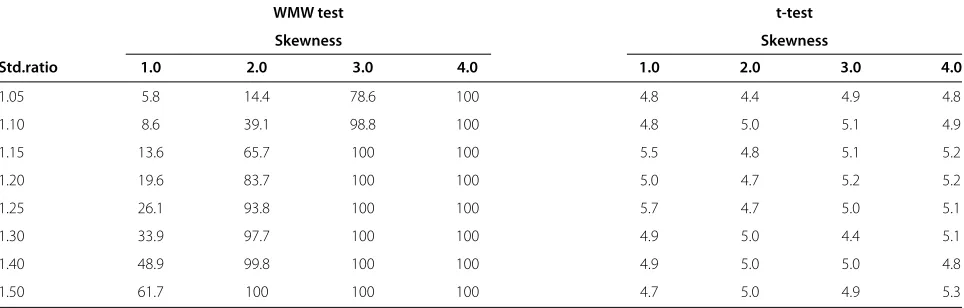
the t-test are always close to 5%, whereas the rejection rates of the WMW test increases with increasing sam-ple size. As expected, the rejection rates of the WMW test increases when the difference in standard devia-tions increases, because it is this difference that the WMW test picks up. Interestingly, the rejection rates of the WMW test also increases when the amount of skewness increases. The problem is thus greater for sit-uations in which one would more readily abandon the t-test (considerably skewed data) than for situations where the amount of skewness may be considered manageable (slightly skewed data). An example of the increasing rejec-tion rates of the WMW test for increasing standard devia-tion ratios and increasing amount of skewness can be seen in Table 3.
Detailed results for each of the 448 situations considered in the simulation study are given in Additional file 1. Tables 4 and 5 present summaries of the results. In Table 4, the average per cent rejection rates of the t- and WMW tests are given stratified by study size. Each value in the table is the mean of the rejection rates for each of the 32 combinations of amount of skewness and standard deviation ratios.
0 100 250 500 750 1000 0
10 20 30 40 50 60 70 80 90 100
Rejection rate (%)
Number of subjects in each group Gamma distributions
WMW−test t−test
0 100 250 500 750 1000 0
10 20 30 40 50 60 70 80 90 100
Rejection rate (%)
Number of subjects in each group Lognormal distributions
WMW−test t−test
Figure 3Rejection rates (p<0.05) of the WMW and t-tests based on samples from the distributions in Figure 1.
Table 3 Rejection rates (%) of the t- and WMW tests for data drawn from gamma distributions using 1000 subjects in each group
WMW test t-test
Skewness Skewness
Std.ratio 1.0 2.0 3.0 4.0 1.0 2.0 3.0 4.0
1.05 5.8 14.4 78.6 100 4.8 4.4 4.9 4.8
1.10 8.6 39.1 98.8 100 4.8 5.0 5.1 4.9
1.15 13.6 65.7 100 100 5.5 4.8 5.1 5.2
1.20 19.6 83.7 100 100 5.0 4.7 5.2 5.2
1.25 26.1 93.8 100 100 5.7 4.7 5.0 5.1
1.30 33.9 97.7 100 100 4.9 5.0 4.4 5.1
1.40 48.9 99.8 100 100 4.9 5.0 5.0 4.8
Table 4 Mean rejection rates (%) of the t- and WMW tests, averaged over 32 combinations of amount of skewness and standard deviation ratios
Number of subjects in each group
10 25 50 100 250 500 1000
Gamma distributions
t-test 4.01 4.71 4.91 4.98 4.95 4.99 4.97
WMW test 9.47 18.0 28.9 41.6 56.9 66.3 74.7
Lognormal distributions
t-test 4.20 4.69 4.83 4.89 4.95 4.92 4.98
WMW test 5.21 6.99 9.63 14.4 26.5 39.7 54.3
Table 5 Estimated probabilities (%) that thep-value of the WMW test is smaller than that of the t-test, averaged over 32 combinations of amount of skewness and standard deviation ratios
Number of subjects in each group
10 25 50 100 250 500 1000
Gamma distributions 54.1 63.3 69.8 75.8 82.6 86.8 90.3
Lognormal distributions 45.6 52.1 56.9 62.3 70.1 76.3 82.5
Table 5 presents the estimated probability that the p -value of the WMW test is smaller than that of the t-test. For large studies with data distributed as in this simula-tion study, the WMW test almost always produces smaller
p-values than the t-test.
Discussion
The concurrent increases—since the Seventies—in sam-ple size and use of non-parametric tests over t-tests have a paradoxical quality. The usefulness of non-parametric tests as alternatives to t-tests for non-normally distributed data is most pronounced for small studies. When the sample size increases, so does the robustness of the t-tests to deviations from normality. The non-parametric WMW test, on the other hand, increases its sensitiv-ity to distribution differences other than between means and medians, and it may detect (i.e. produce a small p -value) slight differences in spread. When the difference in spread increases, the probability that a random sam-ple from one of the distributions is less than a random sample from the other distribution also increases. With a large sample size, the WMW test has great power to detect that that probability is not 50%. If the purpose of the study is to detect any distributional difference, using a non-parametric test is probably useful. Most studies, how-ever, are carried out to investigate differences in means or medians, and as such, the ratio of non-parametric tests to t-tests ought to decrease when studies grow in size.
Why then has the use of non-parametric tests increased? We may propose several explanations. Per-haps, non-parametric tests were underused earlier, and
We strongly advise against that practice. In large studies, tests for normality are very sensitive to deviations from normality and thereby unsuitable as tools to choose the most appropriate test. Second, regardless of the size of their studies, authors may rely on recommendations and advice intended solely for the analysis of smaller studies. There might be a lack of critical thinking about recom-mendations and a poor understanding of the practical implications of the central limit theorem. Third, authors may simply prefer smallp-values, and might go shopping for the statistical method that gives them the smallestp. In the simulation study in this paper, the WMW test pro-duced smallerp-values that the t-test more than 70% of the times when the number of subjects in each group was 250. For 1000 subjects in each group, that propor-tion increased to more than 80%. Last, we have publi-cation bias. A study with a significant p-value from the WMW test may be more readily accepted for publica-tion than a study with a non-significantp-value from the t-test.
Is the WMW test a bad test? No, but it is not always an appropriate alternative to the t-test. The WMW test is most useful for the analysis of ordinal data and may also be used in smaller studies, under certain conditions, to com-pare means or medians [5,11]. Furthermore, if the results from the WMW test are interpreted strictly according to the test’s null hypothesis, Prob(X<Y)=0.5, the WMW test is an efficient and useful test. For large studies, how-ever, where the purpose is to compare the means of continuous variables, the choice of test is easy: the t-test is robust even to severely skewed data and should be used almost exclusively.
One further benefit of using the t-test is that it facili-tates interval estimation. The t-test and its corresponding confidence interval are based on the same standard error estimate; when the t-test is robust, so is the confidence interval. Combined with linear regression analysis, the t-test and its confidence interval form a simple and unified approach for analyzing and presenting continuous out-come data, which, for large studies, is sufficient for most practical purposes.
This study has only considered smooth, skewed distri-butions. Medical variables do not always have a smooth distribution and may include outliers. The problem with outliers is not that the t-test fails as a test of equality of means in their presence, but that the mean itself may be a poor representation of the typical value of the distribu-tion. One solution is to use another measure of location, for instance, the trimmed mean, which may be compared in two groups with the Yuen-Welch test [5]. The prob-lem that the mean does not reflect the central tendency of a distribution is most pronounced in small studies, where the impact of outliers is usually greater than in large studies.
Conclusions
The use of non-parametric tests in high-impact medical journals has increased at the expense of t-tests, while the sample size of research studies has increased manyfold. Recent examples of large studies that use non-parametric tests as alternatives to t-tests are abundant.
Non-parametric tests are most useful for small studies. Research authors that use non-parametric tests in large studies may provide answers to the wrong question, thus confusing readers. For large studies, t-tests and their cor-responding confidence intervals can and should be used even for heavily skewed data.
Additional file
Additional file 1:Supplementary materials. Detailed results from the simulation study.
Competing interests
The author declares no competing interests.
Acknowledgements
The author thanks the editor and the reviewers for their thoughtful and constructive comments and suggestions.
Received: 11 January 2012 Accepted: 14 June 2012 Published: 14 June 2012
References
1. Horton NJ, Switzer SS:Statistical methods in the journal.New Engl J Med2005,353(18):1977–1979.
2. Emerson JD, Colditz GA:Use of statistical analysis in the New England Journal of Medicine.New Engl J Med1983,309(12):709–713.
3. Bland MJ:The tyranny of power: is there a better way to calculate sample size?BMJ2009,339:b3985 10.1136/bmj.b3985.
4. Skovlund E, Fenstad GU:Should we always choose a nonparametric test when comparing two apparently nonnormal distributions?J Clin Epidemiol2001,54:86–92.
5. Fagerland MW, Sandvik L:Performance of five two-sample location tests for skewed distributions with unequal variances.Contemp Clin Trials2009,30:490–496.
6. Altman DG:Practical Statistics For Medical Research. Boca Raton, FL: Chapman & Hall/CRC; 1991.
7. Altman DG, Machin D, Bryant TN, Gardner MJ (eds):Statistics with Confidence (2nd edn). London: BMJ Books; 2000.
8. Bland M:An Introduction to Medical Statistics (3rd edn). Oxford: Oxford University Press; 2000.
9. Kirkwood BR, Sterne JAC:Essential Medical Statistics (2nd edn). Malden, MA: Blackwell Science, Inc.; 2003.
10. Hart A:Mann-Whitney test is not just a test of medians: differences in spread can be important.BMJ2001,323:391–393.
11. Fagerland MW, Sandvik L:The Wilcoxon-Mann-Whitney test under scrutiny.Stat Med2009,28:1487–1497.
12. Kastrati A, Neumann FJ, Schulz S, Massberg S, Byrne RA, Ferenc M, et al.: Abciximab and heparin versus bivalirudin for non-ST-elevation myocardial infarction.New Engl J Med2011,365:1980–1989. 13. Karim SSA, Naidoo K, Grobler A, Padayatchi N, Baxter C, Gray AL, et al.:
Integration of antiretroviral therapy with tuberculosis treatment.
New Engl J Med2011,365:1492–1501.
14. Rao SV, Kaltenbach LA, Weintraub WS, Row MT, Brindis RG, Rumsfield JS, et al.:Prevalence and outcomes of same-day discharge after elective percutaneous coronary intervention among older patients.JAMA
2011,306(13):1461–1467.
colorectal cancer in individuals undergoing screening colonoscopy.
JAMA2011,306(12):1352–1358.
16. Parodi G, Marucci R, Valenti R, Gori AM, Migliorini A, Giusti B, et al.:High residual platelet reactivity after clopidogrel loading and long-term cardiovascular events among patients with acute coronary syndromes undergoing PCI.JAMA2011,306(11):1215–1223. 17. Christoffersen M, Frikke-Schmidt R, Schnohr P, Jensen GB, Nordestgaard
BG, Tybjærg-Hansen A:Xanthelasmata, arcus corneae, and ischaemic vascular disease and death in general population: prospective cohort study.BMJ2011,343:d5497.
18. K ¨uhnast C, Neuh¨auser M:A note on the use of the non-parametric Wilcoxon-Mann-Whitney test in the analysis of medical studies.GMS Ger Med Sci2008,6:Doc02.
doi:10.1186/1471-2288-12-78
Cite this article as: Fagerland:t-tests, non-parametric tests, and large studies—a paradox of statistical practice?BMC Medical Research Methodol-ogy201212:78.
Submit your next manuscript to BioMed Central and take full advantage of:
• Convenient online submission
• Thorough peer review
• No space constraints or color figure charges
• Immediate publication on acceptance
• Inclusion in PubMed, CAS, Scopus and Google Scholar
• Research which is freely available for redistribution