DEMOGRAPHIC RESEARCH
VOLUME 31, ARTICLE 23, PAGES 687
734
PUBLISHED 18 SEPTEMBER 2014
http://www.demographic-research.org/Volumes/Vol31/23/ DOI: 10.4054/DemRes.2014.31.23
Research Article
Certainty of meeting fertility intentions declines in
Europe during the ‘Great Recession’
Maria Rita Testa
Stuart Basten
© 2014 Maria Rita Testa & Stuart Basten.
This open-access work is published under the terms of the Creative Commons Attribution NonCommercial License 2.0 Germany, which permits use, reproduction & distribution in any medium for non-commercial purposes, provided the original author(s) and source are given credit.
1 Introduction 688
2 Background 689
2.1 Period fertility rates and the ‘Great Recession’ 689 2.2 Relationship between fertility and economic shocks 690 2.3 Beyond a relationship between fertility, GDP and individual
unemployment?
691 2.4 The ‘Great Recession’, fertility, and perceptions of uncertainty 695
3 Research hypotheses 696
4 Data and methods 697
4.1 Selected sample 697
4.2 Response variables 698
4.3 Explanatory variables 700
4.4 The models 701
5 Results 703
5.1 Descriptive findings: fertility intentions and reproductive uncertainty in 2006–2011
703 5.2 Individual’s, household’s, and country’s economic situation in
2006–2011
706 5.3 Multilevel analysis of fertility intentions 709 5.4 Multilevel analysis of reproductive uncertainty 712
6 Discussion 715
7 Acknowledgments 718
References 719
Certainty of meeting fertility intentions declines in Europe during
the ‘Great Recession’
Maria Rita Testa1
Stuart Basten2
Abstract
BACKGROUND
Relatively little research has been conducted on how economic recessions impact fertility intentions. In particular, uncertainty in reproductive intentions has not been examined in relation to economic shocks.
OBJECTIVE
The purpose of this paper is to estimate the impact of individuals‟ perception of negative changes in both their own and their country‟s economic performance on reproductive intentions in Europe during the time of the “Great Recession” (2006-2011). Crucially, we examine both intentions and stated certainty of meeting these intentions.
METHODS
Using the 2011 Eurobarometer survey for 27 European countries, fertility intentions and reproductive uncertainty are regressed on individuals‟ perceptions of past trends in country‟s economic situation, household‟s financial situation, and personal job situation. Multilevel ordinal regressions models are run separately for people at parities zero and one as well as controlling for a set of socio-demographic variables. RESULTS
A worsening in the households‟ financial situation, as perceived in the years of the economic crisis, does not affect people‟s fertility intentions but rather the certainty
of meeting these intentions. This relationship holds true at the individual-level for childless people. The more negative the individual‟s assessment of the household‟s financial situation, the higher the reproductive uncertainty. While this works exclusively at the country-level for people at parity one, the higher the share of
1 Wittgenstein Centre for Demography and Global Human Capital (IIASA, VID/OEAW, WU), Vienna
Institute of Demography of the Austrian Academy of Sciences, and Vienna University of Economics and Business, Austria. E-mail: [email protected].
people‟s pessimism on households‟ financial situation in the country the more insecure individuals of such a country are about having additional children.
CONCLUSIONS
The empirical evidence suggests that individuals‟ uncertainty about realising their fertility intentions has risen in Europe and is positively linked to people‟s perceived household financial difficulties. If European economies continue to fare poorly, fertility intentions could eventually start to decline in response to such difficulties.
1. Introduction
When asked to estimate their future complete family size, individuals tend to over-estimate the number of children they will have in their whole reproductive career; nevertheless, their lifetime fertility intentions are a strong predictor of their actual fertility (Bongaarts 2001; Quesnel-Vallée and Morgan 2003; Schoen et al. 1999). One of the most important values of reproductive intentions lies in the fact that they are informative about directional trends: actual and intended fertility show similar trends despite the fact that they are at different levels (Goldstein, Lutz, and Testa 2003; Hin et al. 2011).
In this context, it is surprising that while the recent economic crisis in Europe – coined the „Great Recession‟ – has been studied in relation to actual fertility (see, among others, Sobotka, Skirbekk, and Philipov 2011), no analysis of the relationship between the crisis and fertility intentions has yet been carried out. If the recent economic crisis has played a role in re-shaping attitudes towards childbearing, either through views of individual life courses to come or through a general attitudinal shift in the place of family within society, this could affect the anticipated recovery in the period Total Fertility Rate [pTFR] after the end of the recession in some countries. This could suggest the possibility of an impact upon cohort/quantum fertility.
Using multilevel models on data from the 2011 Eurobarometer [EB] survey, we examine the relationship between lifetime fertility intentions and the “Great Recession” in 27 EU countries.3
Individuals‟ subjective evaluations of their country‟s economic situation, their household‟s financial situation, and their personal job situation over the past five years, i.e., 2006‒2011, are used to measure people‟s perceptions of their own changes and their country‟s economic performance during the time of the “Great Recession” and the impact these have on
3 Croatia, not being a member of EU in 2011, is excluded from the analysis. The analysis of Germany is
reproductive intentions. Crucially, we examine both intentions and stated certainty of meeting these intentions.
2. Background
2.1 Period fertility rates and the ‘Great Recession’
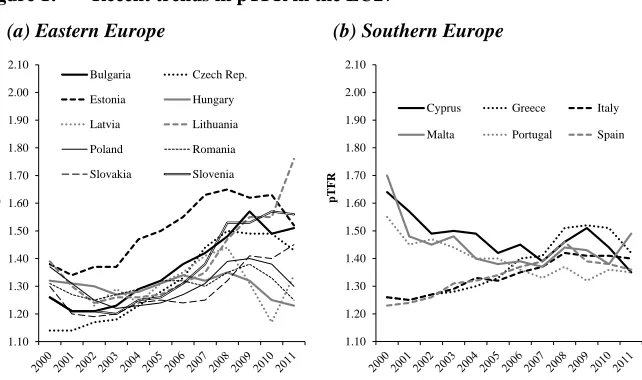
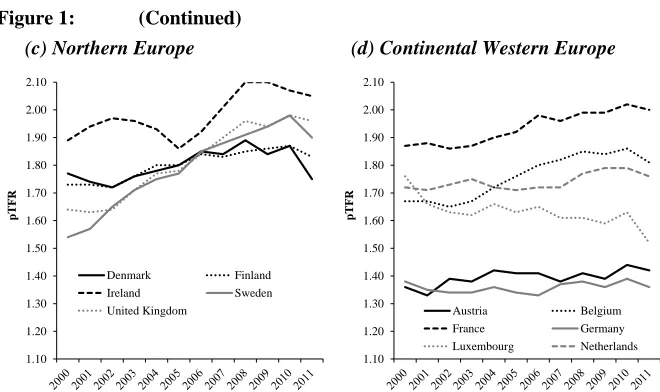
During the 1990s, pTFRs across much of Europe fell to very low levels (Kohler, Billari, and Ortega 2002). As Figure 1 demonstrates, most countries generally saw an upturn in pTFR in the 2000s, largely as a result of the tempo effect of postponement of births to later ages (Sobotka 2004). In 2008, for example, pTFR was rising in every country in Europe, apart from a marginal decline in Luxembourg (Eurostat 2013). However, in all but six EU countries, pTFR either declined in 2010 or stagnated. Latvia saw the most pronounced decline as the country grappled with extremely high unemployment and a massive contraction of the economy. In Hungary, Malta, and Romania a transition from stagnation to decline occurred, while in Bulgaria, Cyprus and, to an extent, Slovakia recent increases sharply turned to declines. For most countries, meanwhile, recent increases in fertility turned to stagnation in 2010 (with the exceptions of Denmark and Spain). Luxembourg, Sweden, Germany, Slovenia, Portugal, and Austria each saw modest increases in fertility during 2010. Clearly, the relationship between the „Great Recession‟ and pTFR in Europe is neither straightforward nor unidirectional.
Figure 1: Recent trends in pTFR in the EU27
(a) Eastern Europe (b) Southern Europe
1.10 1.20 1.30 1.40 1.50 1.60 1.70 1.80 1.90 2.00 2.10
p
T
F
R
Bulgaria Czech Rep.
Estonia Hungary
Latvia Lithuania
Poland Romania
Slovakia Slovenia
1.10 1.20 1.30 1.40 1.50 1.60 1.70 1.80 1.90 2.00 2.10
p
T
F
R
Cyprus Greece Italy
Figure 1: (Continued)
(c) Northern Europe (d) Continental Western Europe
Source: (Eurostat 2013)
2.2 Relationship between fertility and economic shocks
The economic argument concerning fertility and recession is, fundamentally, whether or not the relationship is pro- or counter-cyclical. The argument for a counter-cyclical relationship is based upon the assumption that temporary periods of unemployment constitute a good time for childbearing as the opportunity costs are lower. This, in turn, stems from Becker‟s microeconomic model of fertility (Becker, 1960; Becker, 1991). Here, childbearing is recognised as profoundly time consuming, and the associated opportunity costs are closely linked to the potential wages of the parents. Rising male wages produce an income effect that raises
demand for children. For women, rising female wages results in a combined income and substitution effect. The income effect raises the demand for children, while the substitution effect results in an increased cost of children relative to other goods. In this context, women (especially those with high potential wages) may restrict fertility and „trade-off‟ children for less time-demanding alternatives. On the other hand, when the substitution effect is diminished for women, perhaps through higher rates of unemployment, fertility should – theoretically – increase.
The most widely quoted empirical evidence for a counter-cyclical relationship between fertility and recession concerns the increased birth rates of the United States in the 1960s and 1970s. Butz and Ward (1979a; 1979b), in particular, found evidence of this for the early 1970s. However, later research has suggested that
1.10 1.20 1.30 1.40 1.50 1.60 1.70 1.80 1.90 2.00 2.10
p
T
F
R
Denmark Finland
Ireland Sweden
United Kingdom
1.10 1.20 1.30 1.40 1.50 1.60 1.70 1.80 1.90 2.00 2.10
p
T
F
R
Austria Belgium
France Germany
fertility in this period did, in fact, remain largely pro-cyclical (Macunovich 1995). Indeed, a pro-cyclical relationship between recession and fertility is one which appears to prevail in the literature. Empirically, this has been found to be the case in both long time series (Sobotka, Skirbekk, and Philipov 2011; Rindfuss, Morgan, and Swicegood 1988) and individual country data (e.g., Adsera 2011; Kravdal 2002; Macunovich 1996).
2.3 Beyond a relationship between fertility, GDP and individual unemployment?
While GDP growth is the measurement by which recession is technically defined, Sobotka, Skirbekk, and Philipov (2011) point out that in terms of household responses to economic conditions, such fluctuations in GDP are not necessarily the best variables to employ. Various studies for both the USA (Becker 1960) and the Netherlands (e.g., Fokkema et al. 2008) have examined the relationship between consumer confidence and fertility, with each broadly finding that declines in birth rates were positively associated with trends in both purchases and indices of consumer confidence (with appropriate lags).
Unemployment is generally identified in the literature as a far more tangible measurement of the impact of recession upon men and women of reproductive age than, for example, GDP growth rates. The ongoing low fertility rates found in Southern Europe have been partly attributed to persistently high levels of unemployment and job instability (Adsera 2004; Adsera 2005a; Billari and Kohler 2004). A negative relationship between unemployment and fertility has been found in a wide array of studies across Europe, North America, and East Asia (see Sobotka, Skirbekk, and Philipov 2011 for a complete review), with many of these studies disaggregating by gender effects (Örsal and Goldstein 2010) and by individual and aggregate unemployment (Kravdal 2002). Other studies have identified the importance of unemployment in determining timing of fertility – especially the transition to first birth (Meron and Widmer 2002).
who entered the labour market at the height of recession declined – or, likely, was postponed.
Considering unemployment in the „Great Recession‟ in Europe we can see significant fluctuations across both time and space. Indeed, there is clear evidence of two distinct „peaks‟ of worsening unemployment in late 2008 and from mid-2011 (Eurostat 2013). Unemployment has struck parts of Europe with different rates of intensity. Of the countries hit hardest by the sovereign debt crisis4[hereafter „SDC countries‟], Greece, Spain, and Ireland have seen pronounced, constant increases in unemployment, with a sharp rise in Italy since 2011 (Eurostat 2013). The Baltic States (Latvia, Lithuania, and Estonia) saw a sharp turnaround in 2008 as a result of a profound change in economic growth – but each of these appears to have brought unemployment back under control. Other new accession countries such as Bulgaria, Hungary, Cyprus and Slovenia have seen steady increases in unemployment up to around 10%, while the economic „miracles‟ in Poland and Slovakia have been halted. However, other large, Western and Northern economies have posted relatively modest increases in unemployment. Germany, indeed, returned a constant
decline in unemployment over the period of the crisis. Turning to youth unemployment, the picture appears even starker. Among young people (aged below 25) in 2011, unemployment rates in Greece and Spain hover around 45% with a further six countries – Italy, Ireland, Portugal, Latvia, Lithuania, and Slovakia – around 30% (Eurostat 2013). This, of course, is difficult to judge in relation to impacts on fertility.
However, there is an argument to be made that the consideration of unemployment/employment as a binary variable in relation to childbearing choices and attitudes could be inadequate. As Emmenegger et al. (2012a) and others have observed, the changing nature of the European labour market over the past five decades has led to increased fragmentation and „dualisation‟ between „insiders‟ who are characterised by protected „jobs for life‟ and „outsiders‟ whose employment is precarious and vulnerable. This process has come about through the creeping deregularisation and liberalisation of employment contracts with a concomitant increase in „atypical employment contracts‟ such as fixed-term contracts and (sometimes involuntary) part-time employment. It is important to observe that women and young people are particularly affected by this transition towards „non-standard‟ employment (Emmenegger et al. 2012a). In other words, the nature of „being employed‟ has changed dramatically over the past 40 years – and is an entirely different experience in different parts of Europe. As we suggest later, this means that the perception of national economic performance and the likely role of
4 These countries, namely Greece, Ireland, Italy, Portugal, and Spain, were arguably among those hardest
the individual‟s trajectory within that could be just as critical in shaping views regarding major life decisions as present individual employment status.
Yet, this notion of the „dualisation‟ of the labour market is just one element of what Mills and Blossfeld (2005) observe to be the onset of increased uncertainty, especially for the young. For them, the process of globalisation has led to a heightened degree of uncertainty for those early in the life-course through the „endogenous intensification of innovation, increasing rate of economic and social change‟; acceleration of market transactions and the increasing volatility of the market. Before impacting micro-level „rational decision-making‟, however, they argue that this generalised uncertainty is „filtered‟ by institutions such as employment systems, education systems, welfare regimes, and family systems. With regard to employment and education, timing and ease of labour market entry, levels of unemployment and, crucially, stability and security of employment are defined by Mills and Blossfeld as key structural and institutional 'filters'. Meanwhile, the provision of „safety-net‟ welfare policies and/or active employment sustaining policies as well as contemporary attitudes towards the norms of family formation are also crucial. These, in turn, affect micro-level decisions regarding employment (type of job), partnerships (type and timing), and parenthood (timing).
Strongly related to this is Giddens‟ sociological conception of „Risk‟ and Ulrich Beck‟s (1992) notion of the „Risk Society‟ – that „one of the major consequences of modernisation has been a tremendous intensification of real and perceived or socially mediated risk‟ (Hall 2002: 175). In other words, for Beck and Giddens, „risk has become strategic organizing principle guiding both individual and institutional thinking and action in contemporary society‟ (Hall 2002: 175). Over time, the modernisation of the family has assured that risk has been generally transferred to the individual, and given that the typical individual routinely encounters „a world of open social possibilities, ambiguity and contested risk knowledge‟ (Lupton 1999: 65) the reflexive negotiation of this risk is a critical, ongoing activity of modern humans. Linking this back to demographic change, Hall (2002) hypothesises that any increases in (perceived) personal or societal „risk‟ will result in lowering fertility intentions, later entry into relationships and greater prevalence of co-habitation – each as a means of reducing (or postponing) assorted dimensions of interpersonal risk.
Within this broad pattern of increasing uncertainty (or „risk‟), clearly eras of
security – what Rindfuss and van den Heuvel (1990) call an „affordability clause‟ – is even less likely to be met in such straitened times. A development of this would be the „demand‟ theory of fertility which posits that childbearing, as a process of consumption of psychological, financial, and time resources which could be spent by parents elsewhere, can be foregone or delayed in straightened economic times (Brewster and Rindfuss 2000).
Finally, in a Durkheimian (1893[2002]) sense, economic crisis and uncertainty can lead to anomie, or a breakdown in social norms. This can influence fertility outcomes through both micro- and macro-level mediators. Increased levels of stress and anxiety (Dooley, Fielding, and Levi 1996; Fenwick and Tausig 1994) associated with anomie can result in depression and poor health (Schneiderman, Ironson, and Siegel 2005) while, again in the context of a „Risk Society‟, heightened levels of anomie may make people averse to additional risks such as those surrounding childbearing (Philipov 2002). Finally, the corollary of an effect of anomie within the „demand‟ theory context is that in societies where a desire for „quality‟ children has developed (Becker 1991), couples may forego or delay childbearing because of a sensed loss of control over the environment in which the child would grow up.
In sum, a broad theoretical generalisation assumes that in the context of increased „temporal uncertainty‟ coupled with the underlying shift towards greater
overall economic uncertainty, people – especially the young – are „less able to make long-term binding commitments which may translate into…foregoing partnership and parenthood until they feel they have obtained adequate certainty for their future life path‟ (Mills and Blossfeld 2005: 18). This is likely to translate into an empirically observed pro-cyclical relationship between periods of „enhanced uncertainty‟ – characterised as economic shocks or recession – and childbearing behaviour.5
As Sobotka, Skirbekk, and Philipov (2010) observe, „the impact of uncertainty in the developed countries has been addressed in relatively few empirical studies‟ meaning that „the wealth of theoretical arguments has not yet been properly tested‟ (p.18). Despite this, and returning to our theme of looking beyond a binary notion of employment, a number of important studies have suggested that labour market position, unstable or temporary work does, indeed, have a detrimental effect on both
5 On the other hand, it has been suggested by Friedman, Hechter, and Kanazawa (1994) that childbearing
fertility (e.g., Adsera 2005b) and fertility intentions (e.g., Pailhé 2009). Returning to our „dualisation‟ theme, for example, Adsera (2005b) finds a marked contrast between public sector jobs characterised by security and benefits being associated with faster transition to motherhood as opposed to short-term contracts being associated with delayed fertility. Stepping back to broader notions of uncertainty, Ranjan (1999) suggested that the declining fertility in Central and Eastern Europe in the 1990s was an „optimal reaction‟ to income uncertainty during the economic and political restricting of the era. For East Germany, studies by Bhaumik and Nugent (2006) found a U-shaped association between self-assessed employment uncertainty and fertility with women in the middle presenting the lowest likelihood of childbearing. Meanwhile, studies by Kreyenfeld (e.g., 2009) found that neither „subjective‟ nor „objective‟ measures of uncertainty significantly altered first birth rate, but that this did have strong educational differentiation with women with higher levels of education postponing parenthood when subject to employment uncertainties and women with lower levels of education often responding by becoming mothers. Perelli-Harris (2006) found that childbearing desires and outcomes in Russia were strongly, positively linked to subjective well-being among married women with at least one child. As we show in Section 3, our study attempts to add to the literature by explicitly linking perceptions of economic uncertainty mediated through perceptions of future individual and societal economic performance to changing patterns of reproductive uncertainty.
2.4 The ‘Great Recession’, fertility, and perceptions of uncertainty
Going beyond a causal link between unemployment and fertility and turning to the likely role of „enhanced temporal uncertainty‟ and the perception of worsening personal and/or societal conditions, it is crucial to understand the changing nature of the particular frameworks – or possibly, to coin Mills and Blossfeld‟s (2005) expression, the „institutional filters‟ – which mediate increased uncertainty and micro-level decision making during the „Great Recession.
potentially very important in the extent to which they impact a wide array of support mechanisms surrounding the family. These range from direct contributions through family policy initiatives and other welfare provisions to the impact upon a declining number of jobs and opportunities in the public sector. These changes in government expenditure have been negative – and are projected to be deeper – in many settings across Europe, but especially in those most affected by the sovereign debt crisis (The Economist 2012). In sum, there are many processes beyond objective individual-level variables (such as unemployment) and macro-level variables (such as GDP per capita) which could have an impact on the sense of uncertainty felt by individuals.
3. Research hypotheses
To better understand the impact of economic uncertainty on fertility, we look at the relationship between economic crisis and individuals‟ reproductive decision-making which plays an important role in shaping fertility outcomes (Morgan 2001). Individual and societal attitudes and norms surrounding families and partnerships are an important mediator in the relationship between economic context and fertility outcomes. As Schoen et al. (1999) observe, „fertility is purposive behavior that is based on intentions, integrated into the life course, and modified when unexpected developments occur‟ (p.799). As such we would expect economic shocks – as unexpected developments – to create some modification. A focus on fertility intentions rather than simply on fertility is very critical, because a decline in fertility rates during the economic crisis would not give us insights on whether fertility intentions have just not been realised, or the birth intentions have actually changed.
Moreover, there is currently relatively little research which explicitly links economic and social uncertainty and/or unemployment and economic shocks (as distinct from general income variation) to fertility intentions (e.g., Philipov, Spéder, and Billari 2006; Spéder and Vikat 2005). Linked to economic uncertainty,
showing the fertility responses to changes in consumer confidence (Fokkema et al. 2008). Moreover, whereas a persistently bad economic and employment condition does not necessarily produce low fertility intentions, because material aspirations and child quality requirements are correspondingly weakened, a low relative
economic situation is more likely to do so. Negative trends would lead to a substantially lower economic condition than the person has been used to. Thus, we expect that a perceived worsening in the personal job situation and household‟s financial situation has a negative effect on individual‟s fertility intentions (Hypothesis I a) and a positive effect on individual‟s reproductive uncertainty (Hypothesis I b).
Country aggregate perceptions of an individual‟s personal job and a household‟s financial situation may have significant effects on top of individuals‟ own perceptions, because, even if one‟s personal job and household‟s financial situation has not worsened, the fact that a person sees that the situation has worsened for many other people in the country makes him worry about his own future situation. In other words, a widespread negative social climate may strengthen people‟s doubts about whether having a(nother) child at all, with the consequence that lifetime fertility intentions are reduced. Thus, aggregate negative assessments of people‟s past job situation and the household‟s financial situation are hypothesised to be negatively correlated with an individual‟s fertility intentions (Hypothesis II a) and positively correlated with an individual‟s reproductive uncertainty (Hypothesis II b).
Finally, for the same reasoning we expect that people positively assessing the past country‟s economic situation are more prone to report a preference for larger family sizes and less likely to be uncertain about realising their reproductive plans (Hypothesis III).
The fact that the assessment of the change in a country‟s economic situation, the household‟s financial situation, and personal job situation were related to the years in which the economic recession started to be experienced in several European countries allows us to use them as a proxy measure of the effects of the crisis and to investigate this effects in relation to fertility intentions and reproductive uncertainty.
4 Data and methods
4.1 Selected sample
the countries (with the exception of Luxembourg, Malta, and Cyprus which had smaller sample sizes of 500 individuals). The sample size allows us to make equally precise estimates for small and large countries, as well as to make comparisons between sub-groups broken down by sex, age, education, marital status, and so on. The survey used a single uniform questionnaire design, with particular attention being paid to equivalent question wording across languages. The format was face-to-face interview.
Our analytical sample consists of 5,652 men and women aged 20 to 45 who answered the question on fertility intentions, including 3,556 childless respondents and 2,096 respondents with only one child (Tables A2 and A3 in the Appendix). In the analysis of reproductive uncertainty the samples sizes are smaller, i.e., 2,581 childless respondents and 1,029 respondents with one child, because certainty levels of intentions were asked only to individuals reporting positive fertility intentions (i.e., one or more children). Hence, the study of reproductive uncertainty at high parities (i.e., two and above) was precluded by the limited sample size of people reporting an intention to have a third or higher birth order child.
Although missing answers may be symptomatic of particular fertility plans (Morgan 1981, Morgan 1982), individuals who did not report any valid answer for their intended family size (non-response rate was around 12%) were excluded due to the lack of auxiliary information on this item and in order to avoid potential complications.
The multilevel models are formally based on two levels: individuals and countries referred to as “clusters”, as described in Tables A2-A4. Though the hierarchical structure is quite unbalanced, this is efficiently handled by using maximum-likelihood methods. Furthermore, the number of clusters and their sizes are sufficient to achieve high levels of power and accuracy of the asymptotic distributions of the estimators (Snijders and Bosker 1999) and thus allow for reliable inferences.
4.2 Response variables
to which the intentions are confined. A third distinction is made between childbearing intentions and the degree of certainty about those plans, which has been found to act as a strong predictor of future fertility behaviour (Schoen et al.1999; Westoff and Ryder 1977).
In this analysis the response variables are the number of additionally intended children and the certainty attached to the probability of realising the stated childbearing intentions. Economic recession may also affect child-timing intentions, but the EB data do not contain information on the time of other relevant life events (such as, for example: leaving parental home, entering a partnership, age at birth of the first child) to which child-timing intentions could be usefully related.6 The lack of knowledge on the life course stage in which individuals are observed prevents a correct interpretation of the timing of childbearing, both actual and intended as well as its comparison through time based on several EB rounds. For this reason we just focus on child-number intentions.
Lifetime fertility intentions are coded as a four-category variable: zero, one, two, and three or more children. Values greater than or equal to three were, in light of their low frequency, collapsed into a single category. The variable is surveyed through the following questionnaire item: “How many (more) children do you intend to have?” This prospective item comes immediately after the question about the
number of children already had (“How many children, if any, have you had?”) and is
clearly intended to provide information about the number of births respondents plan to have over (the rest of) their reproductive careers. Neither of the above-mentioned questions asked the interviewed people to make a distinction between biological and adopted children.
Certainty about fertility intentions is measured through the following question: “How certain are you that you will have the number of children that you have just mentioned?” Response options are: “very sure”, “fairly sure”, “not very sure”, and
“not at all sure”. The related variable takes four categories reflecting the above mentioned response options. Importantly, only respondents who provided a valid numerical answer other than “0 child” to the question on additionally intended number of children were asked about certainty level.
The choice to examine separately lifetime fertility intentions and certainty about those intentions has been motivated by the purpose to disentangle the effects of the „Great Recession‟ exerted only on the quantum of fertility intentions from those exerted only on the certainty attached to intentions. In reading the results one should keep in mind that certainty is confined to people reporting positive fertility plans.
6 The only information that can be used in a dynamic perspective is the age at completion of the study,
The questions on actual and additionally intended number of children, as well as the certainty of intentions, were asked also in a previous round of the EB survey conducted in 2006. They were formulated by using exactly the same question wording and they appeared in exactly the same order in the two surveys‟ questionnaires (in 2006 and 2011), allowing for a comparative analysis over time of lifetime fertility intentions and certainty.
4.3 Explanatory variables
Individual assessments of their country and their own economic situation over the past five years (i.e., 2006–2011) are used to estimate the effects of the economic crisis. Focusing on past rather than just current economic trends is in line with the relevance of relative expectations according to which a sudden deterioration in the economic situation is of higher importance than a bad economic situation because it frustrates earlier or well defined aspirations and expectations (Easterlin 1980).
These assessments are measured through the following question: “Compared with five years ago, would you say things have improved, worsened or stayed about the same when it comes to ...?” Response options are: „better‟ „worse‟ „same‟ „don‟t know‟. Out of 15 items listed in this survey question we selected the country economic situation, the household financial situation, and the personal job situation. Each of these was included in the models as a dummy variable indicating a worsening in the specific situation. Perceptions of household‟s financial situation and personal job situation were considered at the individual as well as at country-level.
The individual-level explanatory variables include age, sex, enrolment in education, level of education, marital status, employment status, and self-location on the social scale. All of the covariates, which were selected because they are considered relevant predictors of fertility intentions in the literature, refer to the time of the interview.
respondents were still enrolled in education is also considered. Education is measured in the EB survey through the following survey question: “How old were you when you stopped your full-time education?” The employment status has three
categories: employed, unemployed, and people not in the labour market. An interaction term between gender and not being active in the labour market was included in the models to take into account that most of the women not participating into the labour force are actually housewives, while among men not being active in the labour market is mainly related to an inability to work or retirement status. Unfortunately, if respondents were unemployed at the time of the survey, we were not able to make a distinction between long-term and short-term duration of unemployment spells. The self-positioning on the social scale is a variable measured on ten point values, one for the lowest level and ten for the highest level. A description of all the explanatory variables is reported in Table A1 of the Appendix (panels a and b).
4.4 The models
The multilevel analysis relies on the random intercept version of the proportional odds model for ordinal responses (e.g., Agresti, 2002). In the model presented below denotes the response variable of individual i of cluster (i.e., country) j ( and
x
ij is the corresponding vector of covariates, including both individual-level and cluster-level variables. Moreover,u
j denotes the cluster-level error term, also called random effect. Throughout the analysis we made the standard assumptions on random effects, namely: (i) the random effects are independent and identically distributed following a normal distribution with zero mean and an unknown, estimable variance ; (ii) the random effects are independent of the covariates.7When the response variable is ordinal, taking the values , one can define ( ( and adopt the random intercept proportional odds
model, which can be viewed as a set of linear models for the M-1 cumulative logits:
7 The assumption that the random effects are independent of the covariates is analogous to the
(
(
( )
( (
'
) (
where
is the intercept,β
is the vector of regression coefficients and
(m) are the cutpoint parameters. The cutpoints must be ordered, (1) (2) ( 1)... M
, and the
first cutpoint,
(1) , is fixed to zero for identifiability reasons. The minus sign preceding the linear predictor is necessary in order to interpret the effects of the covariates in the more natural way (i.e., a positive regression coefficient means that higher values of the covariate tend to yield higher values of the response variable).The assumption that the vector of regression coefficients
β
is constant for all the M-1 cumulative logits, sometimes called the parallel regression assumption, leads to the proportional odds property, i.e., the ratio of the odds of two individuals does not depend on the category. The parallel regression assumption is very convenient for parsimony and interpretation, and can be checked using, for instance, the test developed by Brant (1990).Since the individual-level variance implied by the logit link is 2 / 3
, the intraclass correlation coefficient is 2
2 2
/ / 3
u u
for the proportional odds model (Snijders and Bosker 1999).
We used ordinal regression model because both the intended number of children and the certainty of realising fertility intentions are measured on an ordinal scale. These models could be extended to handle partial proportional odds, but then the interpretation becomes somewhat tortuous. We tested the parallel regression assumption, and because only a few covariates in each model violated such an assumption – and only slightly – the proportional odds multilevel models were preferred. The significance of the variances of the random effects was assessed with the likelihood ratio test with corrected p-value, which has been found to be more reliable than the Wald test.
intention). If we are aware that this is a restriction in the scope of the analysis, we are also reassured by the fact that young people, who are presumably at the beginning of their reproductive careers, are also the group most severely exposed to the negative consequences of the economic downturn (Kravdal 1999; Neels 2010). The hierarchical structure of the data used in the multilevel analysis is described in Table A4.
5. Results
5.1 Descriptive findings: fertility intentions and reproductive uncertainty in 2006–2011
Intended family size of people of reproductive ages decreased in Europe between 2006 and 2011. The change is statistically significant for Greece as well as for the EU27 as a whole in the sub-sample of childless people. In the EU27, the mean values went from 1.7 in 2006 to 1.59 in 2011 among childless people and from 1.76 in 2006 to 1.71 in 2011 among people with one child (Table 1). Around half of the EU countries registered a decline in lifetime fertility intentions. At parity zero, the decrease was relatively high in Greece, the United Kingdom, Poland, Cyprus, and Sweden (each -0.20) but statistically significant only in Greece. At parity one, the decline is statistically significant in Bulgaria (-0.46), and Latvia (-0.30). Austria, which shows the lowest lifetime fertility intentions in both the survey rounds (1.55 and 1.68, in 2006 and 2011, respectively), recorded an increase of about 0.4 children for people at parity zero. In Estonia and Latvia the trend was also on the rise, +0.33 and +0.26, respectively, among childless people. At parity one, no marginal positive temporal changes in fertility intentions concerned Spain and Estonia (+0.2) (Table 1).
Table 1: Mean ultimately intended family size of people aged 20 to 45, EU27. Years 2006 and 2011.
Parity zero Parity one
2006 2011 Diff. b-a 2006 2011 Diff. d-c
a b c d
Austria 0.83 1.25 0.42 * 1.52 1.45 -0.07 Belgium 1.72 1.58 -0.14 1.83 1.72 -0.11 * Bulgaria 1.85 1.87 0.02 1.96 1.50 -0.46 Cyprus 2.41 2.18 -0.23 2.25 1.67 -0.58 Czech Rep. 1.62 1.64 0.02 1.60 1.65 0.05 Denmark 1.96 1.82 -0.14 2.13 2.03 0.10 Estonia 1.75 2.08 0.33 1.84 2.06 0.22 Finland 1.93 1.79 -0.14 2.00 1.74 -0.26 France 2.07 1.90 -0.17 1.97 1.93 -0.04 Germany 1.37 1.38 0.01 1.43 1.55 0.12 Greece 2.03 1.74 -0.29 * 1.76 1.69 -0.07 Hungary 1.75 1.62 -0.13 1.82 1.64 -0.18 Ireland 1.92 1.94 0.02 2.23 2.27 0.04 Italy 1.58 1.46 -0.12 1.57 1.56 -0.01 Latvia 1.59 1.85 0.26 2.02 1.72 -0.30 Lithuania 1.85 1.94 0.09 1.66 1.83 0.17 Luxembourg 1.51 1.45 -0.06 1.40 1.62 0.22 Malta 1.50 1.55 0.05 1.71 2.01 0.30 * Netherlands 1.49 1.51 0.02 1.84 1.78 -0.06 Poland 1.94 1.73 -0.21 1.68 1.62 -0.06 Portugal 1.59 1.48 -0.11 1.53 1.44 -0.09 Romania 1.31 1.50 0.19 1.51 1.53 0.02 Slovakia 1.57 1.69 0.12 1.56 1.60 0.04 Slovenia 2.01 2.11 0.10 1.74 1.68 -0.06 Spain 1.54 1.65 0.11 1.56 1.76 0.20 Sweden 2.02 1.82 -0.20 1.87 1.95 0.08
UK 1.79 1.50 -0.29 1.78 1.94 0.16
EU27 1.70 1.59 -0.11 * 1.76 1.71 -0.05
Note: For people at parity zero, the mean ultimately intended family size is the mean additionally intended family size. For people at parity one, the mean ultimately intended family size is obtained by summing up the mean actual and the mean additionally intended family size. EU27 mean values are weighted by taking into account the country population size. A T-test of the differences in means between 2006 and 2011 was performed. Differences statistically significant (at 5%) are marked with an asterisk. Sample sizes are reported in Table A2 in the Appendix.
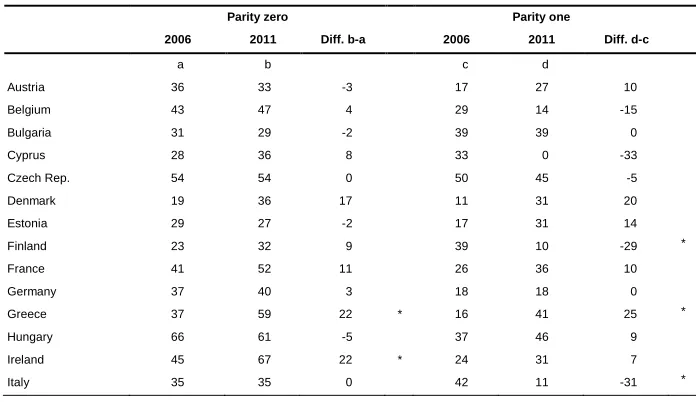
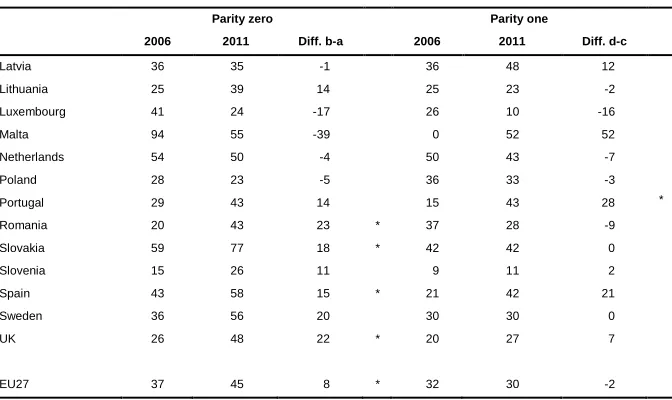
Uncertainty in meeting the reported intended family size increased in Europe between 2006 and 2011. Sixteen of the 27 EU countries registered an increase in the share of people reporting uncertainty at parity zero, fewer countries (i.e., twelve) recorded a similar trend at parity one. In the EU27 as a whole, the temporal change is statistically significant only among childless people, while no substantial differences were observed among people with one child. At parity zero, the increase is statistically significant in Ireland, Greece, Spain, the United Kingdom, Romania, and Slovakia. At parity one, the increase is statistically significant only in Greece and Portugal (Table 2).
Focusing on the „SDC‟ countries and the childless sub-group, the rise was +22 and +21 percentage points in Greece and Ireland, respectively, and +15 and +14 percentage points in Spain and Portugal, respectively. Positive changes of a bigger extent concerned people at parity one: +28 percentage points Portugal, +25 Greece, and +21 Spain, Ireland recorded an increase of just 7 percentage points. Surprisingly, in Italy the proportion of uncertain people was stable at parity zero, while it decreased from 42% in 2006 to 11% in 2011 at parity one. A statistically significant temporal decline in reproductive uncertainty was observed also in other EU countries: Malta, among people at parity zero, and Finland and Cyprus, among people at parity one (Table 2).
Table 2: Share of people aged 20 to 45 who are uncertain about realising
their reproductive plans, EU27. Years 2006 and 2011.
Parity zero Parity one
2006 2011 Diff. b-a 2006 2011 Diff. d-c
a b c d
Austria 36 33 -3 17 27 10
Belgium 43 47 4 29 14 -15
Bulgaria 31 29 -2 39 39 0
Cyprus 28 36 8 33 0 -33
Czech Rep. 54 54 0 50 45 -5
Denmark 19 36 17 11 31 20
Estonia 29 27 -2 17 31 14
Finland 23 32 9 39 10 -29 *
France 41 52 11 26 36 10
Germany 37 40 3 18 18 0
Greece 37 59 22 * 16 41 25 *
Hungary 66 61 -5 37 46 9
Ireland 45 67 22 * 24 31 7
Table 2: (Continued)
Parity zero Parity one
2006 2011 Diff. b-a 2006 2011 Diff. d-c
Latvia 36 35 -1 36 48 12
Lithuania 25 39 14 25 23 -2
Luxembourg 41 24 -17 26 10 -16
Malta 94 55 -39 0 52 52
Netherlands 54 50 -4 50 43 -7
Poland 28 23 -5 36 33 -3
Portugal 29 43 14 15 43 28 *
Romania 20 43 23 * 37 28 -9
Slovakia 59 77 18 * 42 42 0
Slovenia 15 26 11 9 11 2
Spain 43 58 15 * 21 42 21
Sweden 36 56 20 30 30 0
UK 26 48 22 * 20 27 7
EU27 37 45 8 * 32 30 -2
Note: Proportions of people who report to be unsure (either not very sure or not at all sure) to have as many children as they intend to have. EU27 proportions are weighted by taking into account the country population size. A T-test of the differences in means between 2006 and 2011 was performed. Differences statistically significant (at 5%) are marked with an asterisk. Sample sizes are reported in Table A3 in the Appendix.
Source: authors’ elaborations based on Eurobarometer 2006 and 2011
5.2 Individual’s, household’s, and country’s economic situation in 2006–2011
Views of the economic recession are consistent with Europeans‟ general pessimism about the past, current, and future economic situation of their country and their own households, which is conducive to higher uncertainty in general, and to higher reproductive uncertainty. The country past economic trend was perceived negatively by the large majority of the people: In 15 out of the 27 EU countries the share of pessimism was 80% or above. Only in four countries, Sweden, Germany, Austria, and Poland, were the percentages below 50%. On average, three of four Europeans were concerned about the economic situation of the country observed in the past five-year period. At the top of the rank is Greece, with almost all people expressing negative opinions, followed by Spain, Ireland, and Portugal with percentages of around 90% (Figure 2, Panel a).
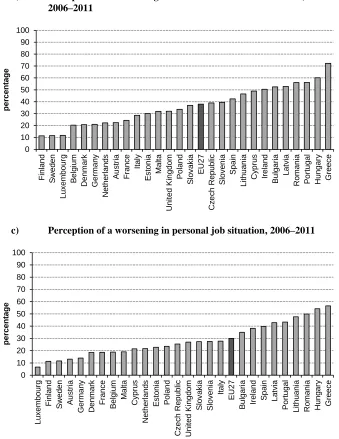
slightly above 50% in Ireland and Portugal, and 29% and 42%, respectively, in Italy and Spain. In Lithuania, Cyprus, Bulgaria, Romania, Hungary, and Latvia shares were close to 50%, while in the rest of Europe less than half of people of reproductive ages expressed a pessimistic view about household‟s financial conditions (Figure 2, panel b).
The past personal job situation was negatively assessed by 30% of Europeans of reproductive ages. Once again, Greece is placed at the top of the country ranking with values above 50%, followed by Hungary, Romania, Lithuania, and Latvia, with percentages close to 50%. Focusing on the „SDC countries‟, in Ireland, Spain, and Portugal people‟s pessimism about their job situations registered a share of about 40%, while in Italy a similar percentage is less than 30% (Figure 2, panel c).
Figure 2: Share of people of reproductive ages (20-45) perceiving a
worsening in country’s economic situation, household’s financial situation, and personal job situation over the past five years (2006-2011), EU27.
a) Perception of a worsening in country’s economic situation,
Figure 2: (Continued)
b) Perception of a worsening in household’s financial situation,
2006–2011
c) Perception of a worsening in personal job situation, 2006–2011
Source: authors’ elaborations based on Eurobarometer 2011
5.3 Multilevel analysis of fertility intentions
We have observed a decline in fertility intentions and an increase in reproductive uncertainty in Europe in the years 2006-2011. We have also shown that people‟s assessment of the country‟s economic situation, their household‟s financial situation, and their own job situation in the same five-year period has been quite pessimistic. In this section, the relationship between these two phenomena is examined using multilevel models. The multilevel analysis is focused on fertility intentions in 2011 rather than the changes occurred in 2006-2011, because the two EB cross-sections (2006 and 2011) do not allow us to trace changes in fertility intentions and related uncertainty at individual level.
Random intercept ordinal regression models were used to regress additionally intended number of children, and reproductive uncertainty, on country‟s, households‟, and individuals‟ past economic situation by controlling for a set of socio-demographic variables. Four different models were estimated separately for the childless sub-sample and the people with one child: empty models (Model I), models with only perception variables (Model II), models with all individual-level covariates (Model III), and full models with individual- and country-level covariates (Model IV). Country means of individuals‟ perception of household financial situation and personal job situation are included because individuals may well be influenced by the general negative social climate in the country even though they are not very pessimistic when assessing their own household‟s financial situation and job situation.
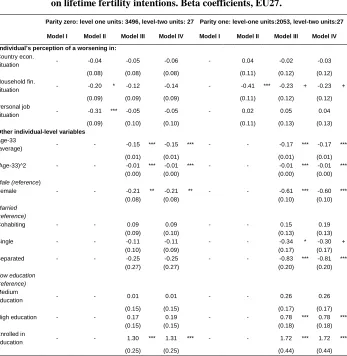
The left panel on Table 3 reports the estimates of the random intercept ordinal regression models run on the childless sub-sample. As can be seen, the household‟s financial situation is negatively correlated with people‟s fertility intentions. But the association is statistically significant only in Model II including just the three perception variables, while it becomes not statistically significant in full Models III and IV. As far as the other two perception variables are concerned, they are both negatively correlated with fertility intentions but the perceived country economic situation never has a statistically significant effect, while the perception of job personal situation is statistically significant only in Model II. Looking at Table A5 depicting the estimates of several models in which the socio-demographic backgrounds have been gradually included, it becomes evident that the effect of individuals‟ perception of the past household‟s financial situation is mediated by the individuals‟ employment status and self-positioning in the social scale. As soon as these two covariates are added in the models, the effect of the household financial situation loses its statistical significance.
negatively correlated with fertility intentions. This effect is highly statistically significant in Model II, but it becomes only weakly statistically significant (at 10% level) in full Models III and IV, and the magnitude of the related coefficient decreases from -0.41 in Model II to -0.23 in Models III and IV. The procedure of gradual inclusion of the socio-demographic variables in the model points out that the relationship between fertility intentions and people‟s worries about their household financial situation is mediated especially by people‟s self-positioning in the social scale (Table A5).
To sum up, people‟s perception of a worsening in their household‟s financial situation is the most relevant predictor of fertility intentions among the three perception variables, but its negative effect on fertility intentions is mediated by individuals‟ backgrounds, such as: employment status and – especially at parity one – self-positioning in the social scale. Interaction terms between a perceived worsening in their household‟s financial situation, on one side, and age, employment status, and education, on the other side, have been tried but not retained in the final models shown in Table 3 as they were not statistically significant. This result seems to suggest that the effect of this perception variable on intentions does not change by education, age, and employment status.
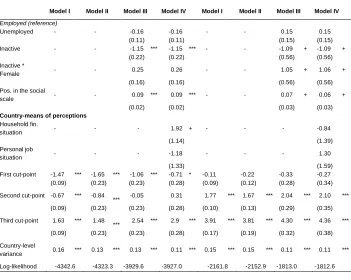
The socio-demographic background variables that have a statistically significant effect on lifetime fertility intentions are: age, education, marital status, and employment status, and social status. In particular, intentions are positively associated with educational level, being enrolled in education, and positioning in the social scale, while they are negatively associated with age, being female, single, separated, or inactive. These predictors influence the reproductive intentions of both childless people and people with one child; however, being single or separated, and having a high level of education are statistically significant only at parity one, while being inactive is statistically significant only at parity zero, and its effect is not gendered, as indicated by the lack of the statistical significance of the interaction term (Table 3).8 Similarly, we could not find support for the fact that the effect of unemployment on fertility intentions is gendered (Rindfuss et al. 1988). As such, the interaction term (unemployment*female) was not retained in the final model.
The country-level variance goes from 0.16 in the empty Model I to 0.11 in the full Models III and IV and it is statistically significant in all four models, for both parity zero and parity one, which supports the choice of using a random intercept version of the ordinal regression model. A random slope for the perceived household‟s financial situation has been considered in the analysis. The likelihood ratio test comparing the fitting of the two nested models (one with just a random intercept and one with a random intercept and a random slope) indicated that the
8 This interaction term was the only one retained in the final models although not statistically significant
random intercept model fits the data better than the model containing also a random slope. This finding reveals that the effect of a perceived worsening in the household‟s financial situation on fertility intentions does not vary from country to country within the EU.
Table 3: Estimates from the random intercept ordinal regression models
on lifetime fertility intentions. Beta coefficients, EU27.
Parity zero: level one units: 3496, level-two units: 27 Parity one: level-one units:2053, level-two units:27
Model I Model II Model III Model IV Model I Model II Model III Model IV Individual’s perception of a worsening in:
Country econ.
situation - -0.04 -0.05 -0.06 - 0.04 -0.02 -0.03 (0.08) (0.08) (0.08) (0.11) (0.12) (0.12) Household fin.
situation - -0.20 * -0.12 -0.14 - -0.41 *** -0.23 + -0.23 + (0.09) (0.09) (0.09) (0.11) (0.12) (0.12) Personal job
situation - -0.31 *** -0.05 -0.05 - 0.02 0.05 0.04 (0.09) (0.10) (0.10) (0.11) (0.13) (0.13) Other individual-level variables
Age-33
(average) - - -0.15 *** -0.15 *** - - -0.17 *** -0.17 *** (0.01) (0.01) (0.01) (0.01) (Age-33)^2 - - -0.01 *** -0.01 *** - - -0.01 *** -0.01 ***
(0.00) (0.00) (0.00) (0.00) Male (reference)
Female - - -0.21 ** -0.21 ** - - -0.61 *** -0.60 *** (0.08) (0.08) (0.10) (0.10) Married
(reference)
Cohabiting - - 0.09 0.09 - - 0.15 0.19 (0.09) (0.10) (0.13) (0.13) Single - - -0.11 -0.11 - - -0.34 * -0.30 +
(0.10) (0.09) (0.17) (0.17) Separated - - -0.25 -0.25 - - -0.83 *** -0.81 ***
(0.27) (0.27) (0.20) (0.20) Low education
(reference) Medium
education - - 0.01 0.01 - - 0.26 0.26 (0.15) (0.15) (0.17) (0.17) High education - - 0.17 0.19 - - 0.78 *** 0.78 ***
(0.15) (0.15) (0.18) (0.18) Enrolled in
Table 3: (Continued)
Parity zero: level one units: 3496, level-two units: 27 Parity one: level-one units:2053, level-two units:27
Model I Model II Model III Model IV Model I Model II Model III Model IV Employed (reference)
Unemployed - - -0.16 -0.16 - - 0.15 0.15 (0.11) (0.11) (0.15) (0.15) Inactive - - -1.15 *** -1.15 *** - - -1.09 + -1.09 +
(0.22) (0.22) (0.56) (0.56) Inactive *
Female - - 0.25 0.26 - - 1.05 + 1.06 + (0.16) (0.16) (0.56) (0.56) Pos. in the social
scale - - 0.09 *** 0.09 *** - - 0.07 + 0.06 + (0.02) (0.02) (0.03) (0.03) Country-means of perceptions
Household fin.
situation - - - 1.92 + - - - -0.84
(1.14) (1.39)
Personal job
situation - - - -1.18 - - - 1.30
(1.33) (1.59)
First cut-point -1.47 *** -1.65 *** -1.06 *** -0.71 * -0.11 -0.22 -0.33 -0.27 (0.09) (0.23) (0.23) (0.28) (0.09) (0.12) (0.28) (0.34) Second cut-point -0.67 *** -0.84
*** -0.05 0.31 1.77 *** 1.67 *** 2.04 *** 2.10 *** (0.09) (0.23) (0.23) (0.28) (0.10) (0.13) (0.29) (0.35) Third cut-point 1.63 *** 1.48
*** 2.54 *** 2.9 *** 3.91 *** 3.81 *** 4.30 *** 4.36 *** (0.09) (0.23) (0.23) (0.28) (0.17) (0.19) (0.32) (0.38) Country-level
variance 0.16 *** 0.13 *** 0.13 *** 0.11 *** 0.15 *** 0.15 *** 0.11 *** 0.11 *** Log-likelihood -4342.6 -4323.3 -3929.6 -3927.0 -2161.8 -2152.9 -1813.0 -1812.6
*p < . 05; ** p < .01; *** p < .001. Standard errors in parentheses. See Table A4 for details on the hierarchical structure of the data.
Source: authors’ calculations based on Eurobarometer 2011.
5.4 Multilevel analysis of reproductive uncertainty
is also positively correlated with reproductive uncertainty, but the statistical significance of the related beta coefficient is very weak (10% level) (see Model III and IV in Table 4). Interestingly, the effect of this covariate, as well as its statistical significance, increases slightly with the inclusion of the background variables in the model (Table A6).
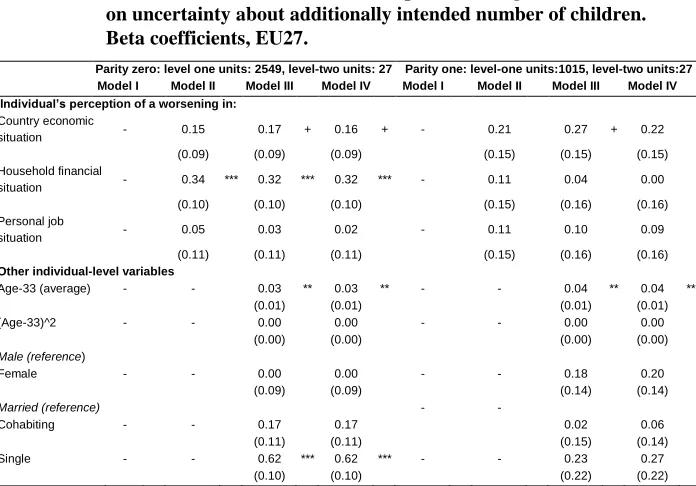
The right panel on Table 4 reports the estimates of the random intercept ordinal regression models on fertility uncertainty run on the sub-sample of people with one child. Similar to the childless sub-sample, the effect of a perceived worsening in the household‟s financial situation is positively correlated with reproductive uncertainty but the effect is very small and not statistically significant, regardless of which and how many socio-demographic background variables are included in the models (Table A6). However, a positive and statistically significant effect of a perceived deterioration in the household‟s financial situation on reproductive uncertainty is observed at the country-level: individuals are more uncertain about meeting their fertility intentions if they live in countries in which the share of people with a pessimistic view of their household‟s financial situation is higher. This finding indicates that the perception effect is exclusively a context effect, and thus most likely linked to the worsening economic conditions experienced in the years of the start of the recession. Finally, a perceived worsening in the country‟s economic situation is positively and statistically significantly associated with reproductive uncertainty but only at 10% (Models II-IV, Table 4). The magnitude of the related beta coefficient increases with the increasing number of variables included in the models (Table A6).
To sum up, the effect of people‟s perception of a worsening in their household‟s financial situation on reproductive uncertainty is exerted only at individual-level at parity zero and only at country-level at parity one: uncertainty increases if people make a negative assessment of their household‟s financial situation (parity zero), or if they live in country in which many people make a negative assessment of their household‟s financial situation (parity one).
Interaction terms between a perceived worsening in the household‟s financial situation, on the one side, and age, employment status, and education, on the other, have been tried but not retained in the final models shown in Table 4 as they were not statistically significant. This result points out that the effect of this perception variable on uncertainty does not change by education, age, and employment status.
statistically significant only at parity zero, while positioning on the social scale, being separated and number of additionally intended children are statistically significant only at parity one (Table 4).
The country-level variance goes from 0.30 in the empty model to 0.26 in the full models for parity zero, while it goes from 0.10 in the empty model to 0.03 in the full models for parity one. Moreover, the country-level variance is statistically significant in all four models at parity zero and in all but the Model IV at parity one. This evidence supports the choice of using a random intercept version of the ordinal regression models, and it also suggests that the country mean of negative perceptions of the household‟s financial situation does explain the cross-country variation in reproductive uncertainty among people who have just one child. A random slope for the perceived household‟s financial situation has been considered. The likelihood ratio test comparing the fitting of the two nested models (one with and one without a random slope on the household‟s financial situation) indicated that the model containing a random intercept and a random slope did not fit the data better than the model containing just a random intercept. This evidence suggests that the effect of a perceived worsening in the household‟s financial situation on reproductive uncertainty does not vary from country to country within the EU.
Table 4: Estimates from the random intercept ordinal regression models
on uncertainty about additionally intended number of children. Beta coefficients, EU27.
Parity zero: level one units: 2549, level-two units: 27 Parity one: level-one units:1015, level-two units:27 Model I Model II Model III Model IV Model I Model II Model III Model IV Individual’s perception of a worsening in:
Country economic
situation - 0.15 0.17 + 0.16 + - 0.21 0.27 + 0.22 (0.09) (0.09) (0.09) (0.15) (0.15) (0.15) Household financial
situation - 0.34 *** 0.32 *** 0.32 *** - 0.11 0.04 0.00 (0.10) (0.10) (0.10) (0.15) (0.16) (0.16) Personal job
situation - 0.05 0.03 0.02 - 0.11 0.10 0.09 (0.11) (0.11) (0.11) (0.15) (0.16) (0.16) Other individual-level variables
Age-33 (average) - - 0.03 ** 0.03 ** - - 0.04 ** 0.04 ** (0.01) (0.01) (0.01) (0.01) (Age-33)^2 - - 0.00 0.00 - - 0.00 0.00
(0.00) (0.00) (0.00) (0.00) Male (reference)
Female - - 0.00 0.00 - - 0.18 0.20
(0.09) (0.09) (0.14) (0.14) Married (reference) - -
Cohabiting - - 0.17 0.17 0.02 0.06
(0.11) (0.11) (0.15) (0.14) Single - - 0.62 *** 0.62 *** - - 0.23 0.27
Table 4: (Continued)
Parity zero: level one units: 3496, level-two units: 27 Parity one: level-one units:2053, level-two units:27 Model I Model II Model III Model IV Model I Model II Model III Model IV Separated - - 0.72 + 0.73 * - - 1.02 ** 1.03 **
(0.37) (0.37) (0.32) (0.32) Low education (reference)
Medium education - - -0.16 -0.16 - - -0.07 -0.05 (0.18) (0.18) (0.23) (0.23) High education - - -0.17 -0.17 - - -0.19 -0.14 (0.18) (0.18) (0.24) (0.24) Enrolled in
education - - -0.53 + -0.52 - - 0.54 0.62 (0.31) (0.31) (0.54) (0.54) Employed
(reference)
Unemployed - - -0.15 -0.15 - - -0.04 -0.04 (0.13) (0.13) (0.19) (0.19) Inactive - - 0.43 0.43 - - -1.11 -1.12
(0.28) (0.28) (0.76) (0.76) Inactive * Female - - -0.07 -0.07 - - 1.03 1.05 (0.17) (0.17) (0.76) (0.76) Pos. in the social
scale - - -0.11 -0.11 - - -0.11 * -0.10 * (0.03) (0.03) (0.04) (0.04) One child intended
(reference)
Two or more - - 0.07 0.07 - - 0.31 * 0.30 * (0.10) (0.10) (0.13) (0.13) Country-means of perceptions
Household fin. sit. - - - -1.10 - - - 3.43 *
(1.68) (1.32)
Personal job sit. - - - 1.94 - - - -2.96 +
(1.96) (1.51)
First cut-point -2.14 *** -1.94 *** -2.03 *** -1.88 *** -1.15 *** -0.93 *** -1.57 *** -1.11 ** (0.12) (0.14) (0.29) (0.37) (0.10) (0.14) (0.36) (0.40) Second cut-point 0.24 * 0.46 *** 0.41 0.56 0.75 *** 0.97 *** 0.39 0.84 *
(0.11) (0.13) (0.28) (0.37) (0.09) (0.14) (0.35) (0.40) Third cut-point 1.91 *** 2.14 *** 2.12 *** 2.27 *** 2.59 *** 2.82 *** 2.29 *** 2.74 ***
(0.12) (0.14) (0.29) (0.37) (0.14) (0.17) (0.37) (0.41) Country-level
variance 0.30 *** 0.28 *** 0.28 *** 0.26 *** 0.10 ** 0.07* 0.09 * 0.03 Log-likelihood -3112.1 -3100.1 -3068.6 -3067.9 -1261.5 -1258.8 -1239.1 -1235.6
*p < . 05; ** p < .01; *** p < .001. Standard errors in parentheses. See Table A4 for details on the hierarchical structure of the data.
Source: authors’ calculations based on Eurobarometer 2011.
6. Discussion
fertility intentions in Europe in the context of the recent „Great Recession‟. Crucially, we examined both intentions and the certainty of meeting these intentions. We expected that a perceived worsening in the country‟s economic situation, the household‟s financial situation and personal job situation could be a relevant factors in pushing lifetime fertility intentions down and reproductive uncertainty up.
Descriptive findings have revealed that in the years of the start of economic crisis (2006–2011) a decline in lifetime fertility intentions occurred in Greece especially and in the EU27 as a whole among childless people, while uncertainty linked to reproductive plans increased in almost all the „SDC countries‟ (with the exception of Italy) and was particularly pronounced in Greece, Ireland, and Portugal. Moreover, subjective evaluations of changes occurred in the country‟s economic situation, the household‟s financial situation, and one‟s personal job situation in the years 2006–2011 were quite negative for many people in most of the EU countries. Statistical empirical evidence suggests that these pessimistic views are inversely correlated with the stated fertility intentions in 2011 and directly correlated with reproductive uncertainty as reported in 2011. However, we could provide only limited support to our research hypotheses.
Results of random intercept ordinal regression models point out that a perceived worsening in the household‟s financial situation over the past five years (2006–2011) affects reproductive uncertainty but not fertility intentions among childless people, while it affects only additionally intended number of children but not reproductive uncertainty among people with one child. As expected in Hypothesis I (see Section 3), the more pessimistic individuals are about the household‟s past financial situation, the more uncertain they are about the possibility of realising their reproductive plans if they have to start a family; moreover, the more pessimistic people are about the household‟s past financial situation, the more likely they are to report a smaller additional number of children if they have already had one child. This latter effect is, however, only weakly statistically significant. Evidently, the choice to have a family with children (at least one child) is normative and, as such, is not influenced by financial factors. Hence, if financial conditions are perceived as deteriorating, people reduce their intended family size only if they already have one child. At the initial stage of the reproductive process, employment and social status significantly mediate the association between fertility intentions and perceived worsening in the household‟s financial situation.