Mathematical modeling of the effect of catalyst initial
shape and the crack pattern in olefin copolymerization
Marzieh Nouri
1, Mahmoud Parvazinia
1*, Hassan Arabi
1, Mohsen Najafi
21 Iran Polymer and Petrochemical Institute, P.O. Box 14975/112, Tehran, Iran
2Qom University of Technology, P. O. Box 1519-37195, Qom, Iran
Received: 14 March 2015, Accepted: 12 May 2015
ABSTRACT
A
two-dimensional (2D) single particle model for the copolymerization of propylene-ethylene with heterogeneousZiegler-Natta catalyst is developed. The model accounts for the effects of the initial shape of the catalyst and carck/ pore patterns on the copolymer composition, polymerization rate and average molecular weight properties. The spherical and oblate ellipsoidal shapes of catalyst particle and four different pattern distributions of cracks and pores in a growing particle are studied in this simulation. It is assumed that the diffusion coefficient of monomers in the cracks/pores is 10 times higher than that in the compact zone of the particle. In other word, the cracks are distinguished from the parts with higher monomer diffusion coefficient. The dynamic 2D monomer diffusion-reaction equation is solved together with a two-site catalyst kinetic mechanism using the finite element method. The simulation results indicate that the initial shape of catalyst changes the average copolymer composition only in the early stage of polymerization, but the crack/pore patterns in the growing particle have a strong impact on the copolymer composition in the polymer particles due to the change of mass transfer limitations. Polyolefins J (2015) 2: 121-133
Keywords: Single particle; Modelling; Finite Element Method; Polyolefin; Copolymerization
INTRODUCTION
One of the most important methods in the production of polyolefin resins (i.e. polyethylene, polypropylene and their copolymer with α-olefins) is olefin polymerization over a solid heterogeneous catalyst. The most popular catalysts in polyolefin industry are single site silica
supported metallocene catalysts and multiple site
Ziegler-Natta (Z-N) and chromium oxide catalysts. Polymerization reactions occur via a coordination
insertion mechanism on the active sites following the
diffusion of monomers either through open pores (if exists) or through the amorphous part of produced polymer. When monomer reaction occurs, one more
building block of a polymer chain forms and as the
polymerization proceeds the small catalyst particles with 20-100 µm in diameter grow to form a pseudo-homogeneous polymer particle with about 500-5000 µm in diameter.
The modeling of a growing catalyst-polymer particle
* Corresponding Author - E-mail: [email protected]
in heterogeneous catalyst polymerization has been studied extensively in the open literature [1-3]. The
two popular models most widely used in single particle
modeling, are the polymeric flow model (PFM) [4-6] and the multigrain model (MGM) [7-8]. The PFM, first proposed by Schmeal and Street [4], assumes
that the growing catalyst-polymer particle forms a
continuum. It also assumes that the mass transfer
in particle follows a Fickian diffusion mechanism through the pseudo-homogeneous polymer phase and
catalyst sites move outwards as the particle expands due to polymerization. This pseudo-homogeneous approximation makes PFM an appropriate choice for several modeling applications [1]. Nagel et al. [7] proposed an early version of the MGM, which the polymeric particle (called macroparticle as well) is
formed by an agglomerate of several much smaller
microparticles and active sites fix in the center of microparticles. Two levels of mass and heat transfer resistances were considered in MGM. Both the PFM and MGM models are considered to have reasonable approximations of the actual physical and chemical
phenomena taking place in a polymer particle and
can estimate the overall particle polymerization
rate, particle temperature and molecular properties
of the produced polymer. The MGM gives a more
detailed description of phenomena taking place
during polymerization with Z-N catalysts, but the
computational times required to obtain the polymer
properties like molecular weight distribution (PDI) are extremely high and limit the use of this model in simulation studies [1].
Galvan and Tirrell [9] extended the PFM model to the case of copolymerization and Hutchinson et al. [10] modified their earlier version of MGM to include the copolymerization modeling. Their assumptions simplified the MGM and transformed that model into a modified PFM and used this model to describe the quasi-steady state copolymerization of the single site heterogeneous catalyst. Debling and Ray [11] classified the copolymer morphology systems into two groups: homogeneous morphology systems
which describe the homopolymer, random copolymer and terpolymer products produced in single stage processes and heterophasic morphology systems which are considered when the polymer particle
consists of distinct polymeric phases coexisting in
the particle like the impact polypropylene produced
in multi stage processes. They declared that in impact
polypropylene particle, ethylene-propylene rubber
flows out of the microparticle and the particle changes from a multigrain to a polymeric flow morphology. Hoel et al. [12] used PFM to model ethylene- propylene copolymerization with a metallocene single site catalyst in slurry polymerization. They modeled only comonomer composition distribution (CCD) and did not consider the PDI. It was concluded that
the mass transfer limitations were responsible for
broad CCD. These results were limited to amorphous polymer particle by authors.
Several varieties of multigrain and polymeric flow models have also been considered. There are the extended versions of MGM, like polymeric multigrain model (PMGM) [13-14] which neglects the diffusion
resistance at the microparticle level and polymeric
multilayer model (PMLM) [15-16] which ignores the microparticle in order to improve the initial MGM model.
Najafi et al. [17] introduced a two-dimensional polymeric flow model to consider the fragment
pattern effects on the average molecular weight
properties, polymerization rate and particle overheating in heterogeneous Ziegler-Natta olefin homopolymerization. In this article, the two-dimensional polymeric flow model has been extended
to model the particle growth and spatial monomer
profiles in a copolymerization reaction. The model
accounts for the effects of the initial shape of the catalyst
and carck/pore patterns on the copolymer composition, polymerization rate and average molecular weight properties. A two-site copolymerization kinetic
scheme has been used to describe propylene-ethylene
random copolymerization over a heterogeneous Z-N catalyst.
Model Development
Kinetic Mechanism
A kinetic model based on two catalytic lumped sites
is used to predict the monomers consumption rates
and molecular weight averages (Mn and Mw) based
on the method of moments in a heterogeneous
multi-site Z-N catalyst. When the method of moments is
used, generally two site types are enough to obtain
a reasonable Mn and Mw [18]. Each lumped site is assumed to be activated instantaneously. Despite
the catalyst being used, the most generally accepted
based on the terminal group model [19]. In the terminal group model, the polymerization kinetic constants
depend on the type of monomer participating in the reaction and the type of monomer at the end of the
polymer chain. In this study, the terminal model kinetic
mechanism including chain initiation, propagation, site transformation and deactivation was considered
(Table 1). k, n i
P
and k, n iD
denote the concentrations of living and dead copolymer chains of total length n, with monomer i at the end of chain on the kth type ofactive site, respectively.
C
*k and k dC respectively are the concentration of active and deactive of the kth type
of catalyst sites. For the present simulation, propylene is monomer type A and ethylene is monomer type B.
The definition of typical variables in copolymerization reaction comes as follow:
(
n)
n
= ; =
1-k n,A
k k k
A k k B A
n,A n,B
F
F F F
F + F
∑
∑
(1)A
= ; = 1-A+ B
A B A
f f f (2)
= + ; = +
k k k k k k
n n,A n,B n n,A n,B
P P P D D D (3)
M=A+B (4)
Where k A
F and fA are the chains fraction formed at the kth type of active site terminated in monomer A
and monomer A fraction in the particle, respectively.
k n
P and k n
D are the concentrations of living and dead copolymer chains of the total length n on the kth type of active site, respectively, and M is the total
concentrations of monomers in the particle. It should
be noted that k A
F and k B
F do not depend on the chain
length [20].
For the multi-component polymerization, the use of pseudo-kinetic rate constants (Table 2) can largely simplify the kinetic rate expressions [21]. Based on the postulated kinetic mechanism, one can define
the nth living (l) and the dead (m) moments of the
corresponding number chain length distributions at the kth type of active site:
1
k k
n n
n Pn n
l ∞
=
=
∑
(5)2
k k
n
n n D
n n
m ∞
=
=
∑
(6)Accordingly, the net production/consumption rate for each monomer can be written as:
(
)
[ ]
2
0 1
k k k k k
pA pAA A pBA B
k
R K F K F l A
=
=
∑
+ (7)(
)
[ ]
2
0 1
k k k k k
pB pBB B pAB A
k
R K F K F l B
=
=
∑
+ (8)The net production/consumption rates of all other Table 1. Simple kinetic mechanism for catalytic copolymerization.
Description Reaction ConstantKinetic
Initiation k A , 1 k
* A P
C + → k
A i K k B , 1 k
* B P
C + → k
B i K Propagation k A , 1 n k A ,
n A P
P + → + KkpAA
k B , 1 n k A ,
n B P
P + → + KkpAB
k A , 1 n k B ,
n A P
P + → + KkpBA
k B , 1 n k B ,
n B P
P + → + KkpBB
Transfer k A , n k * k A ,
n C D
P → +
k A , n k * k A ,
n H C D
P + → +
k trA K † k B , n k * k B ,
n C D
P → +
k B , n k * k B ,
n H C D
P + → +
k trB K † Deactivation k A , n k d k A ,
n C D
P → +
k B , n k d k B ,
n C D
P → +
k d k * C C → k dac K
Table 2. Pseudo-kinetic constants for binary copolymerization. Pseudo-kinetic constant Definition k i K k p K k dac K k B k B i k A k A
i F K F
K + B k B k pBB A k B k pBA B k A k pAB A k A k
pAAFf K Ff K Ff K Ff
K + + +
k B k trB k A k
trAF K F
K + k B k dacB k A k
dacAF K F
K +
† Ktkr =Kktb+KktH[H2]
molecular species are reported in Table 3. The kinetic
constants used in the model simulation are given in
Table 4 (based on values previously used by Soares et al. [22]). To calculate the number and weight average
chain lengths of the polymer chains produced over the
two-site catalyst (Xnand Xw), the following equations
were used:
(
)
(
)
2 1 1 1 2 0 0 1 k k k n k k k X l m l m = = + = +∑
∑
;(
)
(
)
2 2 2 1 2 1 1 1 k k k w k k k X l m l m = = + = +∑
∑
(9)In Table 5 the values of the physical and transport properties are reported.
Two-dimensional Particle Growth Model
In the present study, the monomers concentration in a growing polymer particle was calculated based on
a two-dimensional (in r and θ spherical coordinates)
dynamic diffusion-reaction model introduced in
[17]. In this two-dimensional polymeric flow model, similar to PFM, a growing catalyst-polymer particle forms a continuum and is approximated by a pseudo-homogeneous medium. The particle is assumed isothermal in slurry and there is no external boundary transfer resistance. It is assumed that the mass
transport of both monomers happenes by the diffusion
only and is independent from time. The mass transfer resistance of all the other species (Table 3) is assumed to be negligible.
Based on the above assumptions, the governing 2D
diffusion-reaction equation for the each monomer
concentration, A or B, in a growing catalyst-polymer particle can be written as follows:
(10)
2
2 2
1 1 sin ( , )
sin
A A pA t
A D r A D A R r
t r r r r θ θ θ θ θ
∂ = ∂ ∂ + ∂ ∂ − ∈Ω
∂ ∂ ∂ ∂ ∂
Boundary conditions: Table 3. Net production-consumption rates of the various molecular species.
Active site
0th Moment of living chains
1st Moment of living chains
2ed Moment of living chains
0th Moment of dead chains
1st Moment of dead chains
2ed Moment of dead chains
] [ K ] C ])[ M [ K K ( R k 0 k r t k * k i k dac ] C
[ *k =− + + l
] [) K K ( ] M [] C [ K R k 0 k dac k r t k * k i ] [k
0 = − + l
l ] M [] [ K ] [) K K ( ] M [] C [ K R k 0 k p k 1 k dac k r t k * k i ] [k
1 = − + l + l
l ] M [) ] [ 2 ] [( K ] [) K K ( ] M [] C [ K R k 1 k 0 k p k 2 k dac k r t k * k i ] [k
2 = − + l + l + l
l ] [) K K ( R k 0 k dac k r t ] [ k
0 = + l
m ] [) K K ( R k 1 k dac k r t ] [ k
1 = + l
m ] [) K K ( R k 2 k dac k r t ] [ k
2 = + l
m
Table 5. Physical and transport properties. Table 4. The numerical values of the kinetic rate constants [22].
Reaction
constant Site 1 Site 2 Dimension
k iA K k B i K k pAA K k pAB K k pBB K k pBA K k trA K k trB K k dacA K k dacB K 0.6 2 0.2 2 2 0.2 1.65 1.65 2x10⁻⁴ 2x10⁻⁴ 0.6 2 0.4 4 4 0.4 1.65 1.65 2x10⁻⁴ 2x10⁻⁴
m3/mol.s
m3/mol.s
m3/mol.s
m3/mol.s
m3/mol.s
m3/mol.s
1/s
1/s
1/s
1/s
Description Value Constant Kinetic DA Effective monomer
diffusion coefficient
3.6x10⁻¹⁰
m2/s
DB 5.13x10⁻¹⁰
Ab Bulk monomer
concentration
1600
mol/m3
Bb 400
MmA Molecular weight of
monomer
4.2x10⁻⁴
Kg/mol
MmB 2.8x10⁻⁴
c0*k
Initial concentration of
active site (k=1 and 2) 2.5x10⁻² mol/Kgcat
ρc Catalyst density 2840 Kg/m3
ρp Copolymer density 900 Kg/m3
( , , ) b ( , ) t
A r tθ = A rθ ∈Γ (11)
0 0 &
A θ θ π
θ
∂ = = =
∂ (12)
0 0
A r
r
∂ = =
∂ (13)
Initial condition:
0
( , ,0) 0 ( , )
A rθ = r θ ∈Ω (14)
Where DA is the diffusion coefficient of monomer
A in a growing particle and RpA (mol/m3.s) is the
polymerization rate of monomer A.
Ω
t andΓ
t are the internal and boundary particle domains at timet, respectively.
Ω
0 is the particle domain at time 0and Ab is the monomer concentration at the external particle surface. Similar equations can be used for
monomer B.
Two-dimensional dynamic molar conservation equation of the species (X C: *k, k
n
l
and k nm
, n =0, 1 and 2 and k =1and 2) in the growing particle can be derived as follows:(
2)
(
)
2
1 1 sin
sin X
X r uX uX R
t r r r θ θ θ
∂ = ∂ + ∂ +
∂ ∂ ∂ (15)
Boundary condition:
∫
∫
Ω Γ Γ = Ω t t t t Xud d t d X d (16) Initial condition: 0 0( , ,0) ( , )
X rθ =X rθ ∈Ω (17)
Where Rx is the production-consumption rate of species X (see Table 3). At time zero, the concentrations
of
l
nk,0 andm
nk,0 will be equal to zero while the concentration of the catalyst active sites at time t = 0,* 0k
C , will be equal to a selected value (see Table 5). As the polymerization proceeds the small catalyst grows with time. Assuming that the polymer
phase behaves as an incompressible medium, the following pseudo-steady state two-dimensional mass conservation equation can be used to calculate the
copolymer particle volume:
(18) t P B m B p A m A p 2
2 0 (,r )
M R M R ) sin u ( sin r 1 ) u r ( r r
1 = θ ∈Ω
r + − θ θ ∂ ∂ θ + ∂ ∂ Boundary condition:
∫
∫
Ω Γ Γ = Ω r + t t t t P B m B p A m Ap M R M d ud
R
(19)
where u (m3/m2.s) denotes the flux volumetric flow
rate of the growing polymer phase.
The monomer(s) diffusion-reaction equation (Eq. (10)) is numerically solved using the Galerkin finite element scheme to evaluate the nodal value of monomer concentration. This equation after discretization establishes a system of linear algebraic
equations equal to the number of nodes in the
computational domain. The total mass conservation equation (Eq. (15)), is solved to calculate the flux volumetric flow rate of the growing polymer particle. This equation after discretization also establishes
linear algebraic equations but equal to the number
of elements in the computational domain. The molar species conservation equations (Eq. (18)) are solved
to calculate the lumped values of the molar species
concentration of the growing polymer particle. The
solution of these equations in discrete form is the main challenge because it represents a huge system of
simultaneous ordinary differential equations (ODEs). More details of the numerical method to solve moving
boundary and the algorithm which is used to solve the
equations are presented by Najafi et al. [23] and also the validation of the modeling results are explained before [17, 24].
RESUlTS AND DISCUSSION
The proposed two-dimensional dynamic mathematical
model is used to assess the effects of the initial particle shape and the different patterns of cracks and pores
distribution in a particle on the polymerization rate,
average molecular weight and copolymer composition
in heterogeneous Z-N propylene-ethylene random copolymerization. In this work, an in-house developed MATLAB code is used. To make it possible to simulate
method developed by Najafi et al. [17] is used in all simulations.
Effect of Initial Shape of Catalyst
Three different shapes of catalyst particle were studied in the simulation are shown in Figure 1.
Case I is spherical catalyst and cases II and III are
ellipsoidal with different geometric characteristics (rx, ry and rz) that specify semi-major axis lengths. Case
II is an oblate ellipsoid with rx/ry/rz=2/2.82/2.82 and case III is an extreme case with rx/ry/rz=1/1/8. It should
be pointed out that the volume of initial catalyst for all three cases was the same and the total amount of
active sites was the same as a result.
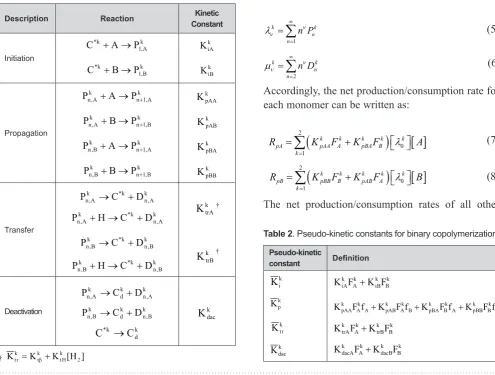
In Figure 2, the propylene and ethylene concentrations
in the particle are depicted with respect to the
polymerization time for a spherical catalyst. Although
the concentrations of both monomers decrease toward the center of the particle due to the mass transport limitations, the ethylene monomer concentration in
the large zone of the particle is low. It seems that high
reaction rate of ethylene monomer despite of its higher diffusion rate leads to a lot of ethylene monomer
consumption before reaching to the center zone of the particle. Therefore, the polymer chains grow in the
center of the particle containing a higher percentage
of the propylene monomer. This can be clearly seen in Figure 3. In the early stages of polymerization (for example 15 seconds of polymerization that depicted in Figure 3), ethylene monomer access to the center of
particle is easy and propylene content in a smaller zone of particle is near to maximum. When polymerization reaction progresses and the particle size increases the
amount of ethylene monomer in the center of particles
reduces. Generally it can be said that the distribution
of propylene monomer in the polymer chains becomes
broader with increasing the polymerization time. In Figure 3 the rate of polymerization is shown as well. At the beginning of polymerization, the rate of polymerization at the center of the particle is much
lower than that in the surface because of less monomers
concentration. By the progress of the reaction, the
reaction rate difference between the surface and the Figure 1. Different shapes of catalyst particle (cases I, II
and III).
center of the particle decreases. As the concentration
of active sites is greater, the reaction rate is slightly
higher in the center.
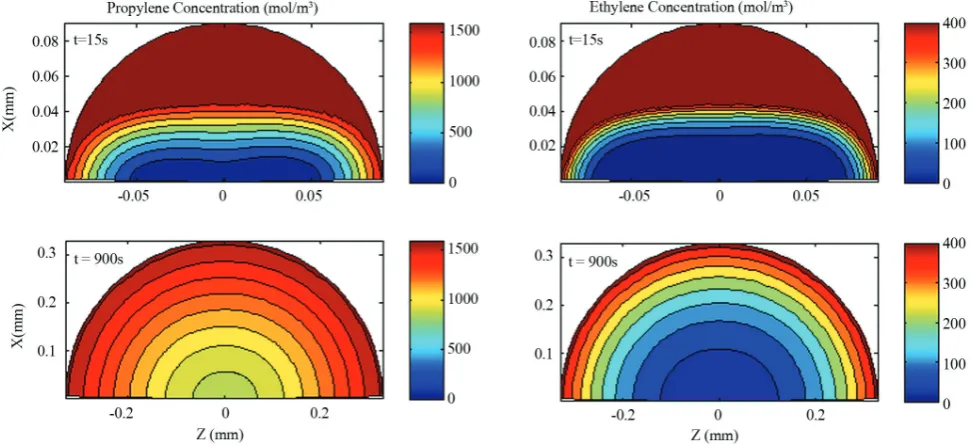
When the shape of initial catalyst is ellipsoidal,
ethylene concentration is higher in more parts of the particle because the ratio of surface area to volume
increases. Figure 4 shows the distribution of ethylene and propylene monomer in an oblate ellipsoid (case III) in two different times. In this case, the volume of the particle zones with higher propylene concentration
will be smaller. As the particle grows, the volume
of particle increases and the effect of surface area
decreases as well. As can be seen in Figure 5, in the
oblate ellipsoid the propylene composition weight
percent in the center of the particle from 65% in 15 second has been reached to 73% in 900 second. The rate of polymerization is also affected by the
large surface area to the volume ratio in ellipsoid
(compare with sphere). In the first moments, the rate of polymerization in the surface is about four times Figure 3. Contour plots of the rate of polymerization (mol/m3.s) and propylene copolymer composition (wt%) in the particle in
two different times (case I).
higher than that in the center. But after a while, when
the volume of the particle increased, a trend similar to
sphere could be observed.
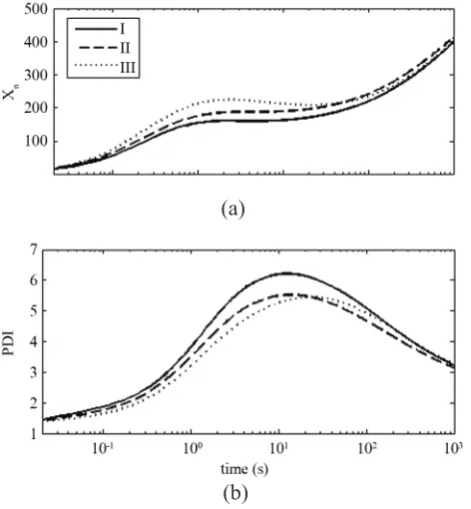
The effect of initial shape of catalyst on the number average degree of polymerization (Xn) and PDI are
shown in Figure 6. Although some differences can be
observed in the first few seconds, after about 100 s,
n
X and PDI are almost independent of the catalyst
initial shape. In Figure 7, the time evolution of the overall particle polymerization rate (a) and propylene composition (wt%) (b) for different shapes of initial catalyst are illustrated. As can be seen, the propylene Figure 5. Contour plots of the rate of polymerization (mol/m3.s) and propylene copolymer composition (wt%) in the particle in
two different times (case III).
Figure 6. Dynamic evolution of the number average degree of polymerization (a) and PDI (b) for different shapes of initial catalyst (cases I, II and III).
(a)
(b)
Figure 7. Dynamic evolution of the rate of polymerization (a)
and propylene composition in copolymer (wt%) (b) for differ -ent shapes of initial catalyst (cases I, II and III).
(a)
percent in whole particle is about 53.
If the copolymer composition is merely statistical neither affected by mass transport limitations nor the multiplicity of active site types, the molar fraction of
propylene monomer in copolymer (FPA) should follow from Eq. (20) [20].
(
)
(
)
2
2
1
2A 2(1A A )
PA
A B A B A B
r f f
F
r r f r f r
− +
=
+ − + − + (20)
;
pAA pBB
A B
pAB pBA
K K
r r
K K
= = (21)
Where FPA corresponds to the average propylene composition of all chains produced, rA and rB are the reactivity ratios and fA is the propylene molar fraction
in polymerization media. In Figure 8, FPA is plotted versus fA. As can be seen, for the values used in this
simulation, the FPA is about 0.28. While due to the mass transport limitation it is increased to about 0.43 (mole fraction), which is obtained when fA is 0.884 (instead of 0.8). It should be noted that according to
the kinetic constant used, the amount of reactivity ratios are the same for both sites, therefore this
deviation is only caused by mass transport limitation.
In conclusion, the mass transport limitations affected by the initial shape of the catalyst, caused the broad propylene composition distribution in copolymer
chains. The experimental results of metallocene ethylene propylene copolymerization provided by
Hoel et al. also showed a broad CCD and the mass
transport limitations in polymer particles were stated
as a reason [12].
Effect of crack pattern
The presented two-dimensional model makes it
possible to evaluate the effect of the crack pattern on
the average molecular properties. Najafi et al. [23] have
studied the impact of radial and shell cracks on the
reaction rate and PDI in olefin homopolymerization.
Figure 8. The molar fraction of propylene in the copolymer (FPA) vs propylene molar fraction in the particle (fA).
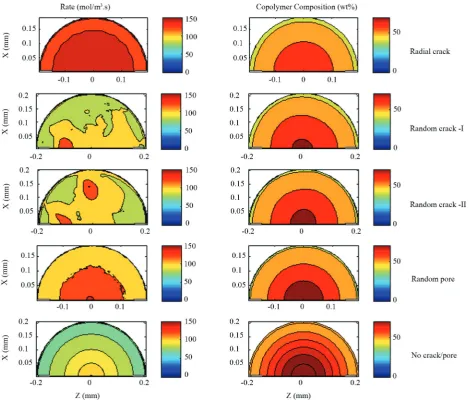
In this article, the effect of the random cracks consists of some randomly interconnected pores, which are
closer to the SEM and TEM photographs of polymer particles cross section [25], radial crack and random pore are studied in copolymerization. Four different
patterns of the distribution of cracks and pores in a
particle are studied in this simulation (see Figure 9). In the case of “radial crack”, the similar cracks are
uniformly positioned and particle surface is attached to
the center. In the “random crack I” and “random crack II” cases, the cracks made up of interconnected pores
are randomly positioned and some cracks reaches to
the center. “Random pore” case is an extreme case in
which the completely random distributed pores are quite apart each other and no pore interconnections
exist. In all cases, the volume of cracks or pores is equal to 10 percent of the whole particle volume. The
diffusion coefficient of the monomers in the cracks/ pores is 10 times higher than that in the compact zone of the particle.
In Figure 10, the contour plots of the rate of polymerization and propylene composition for all different crack patterns are illustrated. In the radial
crack pattern, monomers access to all growing particle
zones are equally increased. Hence, after a short period of time, the rate of polymerization is simply a function of radial position. On the other hand, in the
two other cases where the cracks are randomly located,
the effect of cracks on the polymerization rate can be clearly seen. The reaction rate in the case of random
pore dependens only on the radial position which is
similar to the case of no crack/pore. It is because of the difficulty of monomers to access from the surroundings media to the center. Propylene composition in growing
Figure 10. Contour plots of the rate of polymerization (mol/m3.s) and propylene composition in copolymer (wt%) for different
polymer chains is also affected by the crack pattern
and followed the trend of the reaction rate. In the first
case, the monomer access to the particle center is easier which leads to the less propylene composition
percent. In the two random crack cases, the propylene
composition is almost identical and similar to the
case of random pore. The polymer chains produced
near the surface of the particle contain less propylene
composition.
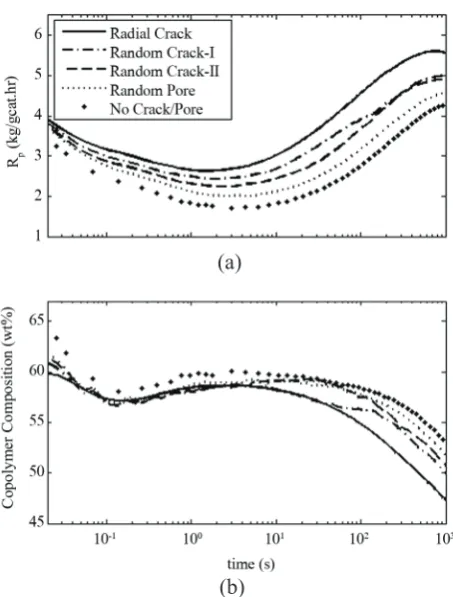
In Figure 11, the effect of crack pattern on the number average degree of polymerization (Xn) and
PDI are depicted. As shown in the figure, the effect
of the crack pattern is decreased by increasing the
polymerization time. Subsequently, the time evolution of the polymerization rate and the average propylene
composition of different patterns are illustrated in
Figure 12. As can be seen, the case of radial crack has the highest polymerization rate and the lowest average
propylene composition because of the best monomers
access to the center of the particle. To evaluate the effect of crack/pore patterns on the mass transfer
limitations, the molar fraction of propylene monomer
in copolymer after 1000 s is checked. As can be seen in Figure 8, for the values used in this simulation, the
FPA is about 0.28. While due to crack pattern it varies from 0.37 in the case of radial crack to about 0.418 in the case of random pore (mole fraction), when fA is
0.855 or 0.878, respectively, instead of 0.8.
CONClUSION
In the present study, a two-dimensional polymeric
flow model is developed to predict the effects of the initial shape of the catalyst and crack/pore patterns on the copolymer composition, polymerization rate
and average molecular weight properties for the
random copolymerization of propylene-ethylene with heterogeneous Ziegler-Natta catalyst.
Three different initial shapes of catalyst from
spherical to oblate ellipsoidal are considered, it is shown that the initial shape of the catalyst can change
the properties in the early stage of polymerization, but after about 100 s the results are almost independent of the catalyst initial shape.
Different patterns of crack/pore inside a particle
are applied to study the effect of cracks on the Figure 11. Dynamic evolution of the number average degree
of polymerization (a) and PDI (b) for different crack patterns. (a)
(b)
Figure 12. Dynamic evolution of the rate of polymerization
(a) and propylene composition (wt%) (b) for different crack
patterns.
(a)
molecular properties of the copolymer particle. The simulation results indicate that the crack/pore patterns
in the growing particle have a strong impact on the copolymer composition in the polymer particles due
to the change of mass transfer limitations.
REFERENCES
1. McKenna TF, Soares JBP (2001) Single particle modelling for olefin polymerization on supported catalysts: A review and proposals for future developments. Chem Eng Sci 56: 3931-3949
2. Dube MA, Soares JBP, Penlidis A, Hamielec, JBP (1997) Mathematical modelling of multipcomponent chain-growth polymerizations in batch, semi-batch, and continuous reactors: A review. Ind Eng Chem Res 36: 966-1015
3. Mattos Neto AG, Pinto JC (2001) Steady
state modeling of slurry and bulk propylene
polymerization. Chem Eng Sci 56: 4043-4057
4. Schmeal WR, Street JR (1971) Polymerization in Expanding Catalyst Particles. AIChE J 17:1188-1197
5. Singh D, Merrill RP (1971) Molecular weight distribution of polyethylene produced by Ziegler-Natta catalysts. Macromolecules 4: 599-604
6. Kanellopoulos V, Dompazis G, Gustafsson B, Kiparissides C (2004) Comprehensive analysis of single-particle growth in heterogeneous olefin polymerization: The random-pore polymeric flow model. Ind Eng Chem Res 43: 5166-5180
7. Nagel EJ, Klrillov VA, Ray WH (1980) Prediction
of molecular weight distributions for high-density
polyolefins. Ind Eng Chem Prod Res Dev 79: 372-379
8. Floyd S, Choi KY, Taylor TW, Ray WH (1986) Polymerization of olefins through heterogeneous catalysis. III. Polymer particle modelling with an
analysis of intraparticle heat and mass transfer
effects. J Appl Polym Sci 32: 2935-2960
9. Galvan R, Tirrell M (1986) Molecular weight
distribution predictions for heterogeneous
Ziegler-Natta polymerization using a two-site model. Chem Eng Sci 41: 2385-2393
10. Hutchinson RA, Chen CM, Ray WH (1992) Polymerization of olefins through heterogeneous catalysts X: Modelling of particle growth and morphology. J Appl Polym Sci 44: 389-1414
11. Debling JA, Ray WH (1995) Heat and mass transfer effects in multistage polymerization processes: impact polypropylene. Ind Eng Chem Res 34: 3466-3480
12. Hoel EL, Cosewith C, Byrne GD (1994) Effect
of diffusion on heterogeneous ethylene propylene
copolymerization. AIChE J 40: 1669-1684
13. Sarkar P, Gupta SK (1991) Modelling of propylene polymerization in an isothermal slurry reactor. Polymer 32: 2842-2852
14. Chen Y, Liu X (2005) Modeling mass transport of propylene polymerization on Ziegler-Natta catalyst. Polymer 46: 9434-9442
15. Soares JBP, Hamielec AE (1995) General dynamic mathematical modeling of heterogeneous Ziegler-Natta and metallocene catalyzed copolymerization
with multiple site types and mass and heat transfer
resistances. Polym React Eng 3: 61-324
16. Wang W, Zheng ZW, Luo ZH (2011) Coupled single-particle and Monte Carlo model for propylene polymerization. J Appl Polym Sci 119: 352-362
17. Najafi M, Parvazinia M, Ghoreishy MH, Kiparissides C (2014) Development of a two dimensional finite element isothermal particle
model to analyse the effect of initial particle
shape and breakage in Ziegler-Natta olefin polymerization. Macromol React Eng 8: 29-45
18. Soares JBP (2001) Mathematical modeling of the microstructure of polyolefins made by coordination polymerization: A review. Chem Eng Sci 56: 4131-4153
19. Ahmadi M, Nekoomanesh M, Arabi H (2010) A simplified comprehensive kinetic scheme for modeling of ethylene/1-butene copolymerization using Ziegler-Natta catalysts. Macromol React Eng 4: 135-144
20. Soares JBP, McKenna T, Cheng CP (2007) In: Polymer reaction engineering, Asua JM (ed) 1st
ed, Blackwell, Ch. 2, 29-117
21. Dompazis G, Kanellopoulos V, Touloupides V, Kiparissides C (2008) Development of a multi-scale, multi-phase, multi-zone dynamic model for
the prediction of particle segregation in catalytic
olefin polymerization FBRs. Chem Eng Sci 63: 4735-4753
and metalocene catalysts. I. General dynamic mathematical model, Polym Reac Eng 4: 153-191
23. Najafi M, Parvazinia M, Ghoreishy MH (2014) Modelling the effects of fragment patterns on
molecular properties and particle overheating in
olefin polymerization. Polyolefins J 1: 77-91
24. Najafi M, Parvazinia M (2015) Computational Modeling of Particle Fragmentation in the Heterogeneous Olefin Polymerization. Macromol Theory Simul 24: 28-40