in the population sciences published by the Max Planck Institute for Demographic Research Konrad-Zuse Str. 1, D-18057 Rostock · GERMANY www.demographic-research.org
DEMOGRAPHIC RESEARCH
VOLUME 11, ARTICLE 14, PAGES 395-420
PUBLISHED 17 DECEMBER 2004
www.demographic-research.org/Volumes/Vol11/14/
DOI: 10.4054/DemRes.2004.11.14
Research Article
Marital Dissolution in Japan:
Recent Trends and Patterns
James M. Raymo
Miho Iwasawa
Larry Bumpass
1 Introduction 396
2 Background 398
3 Data and methods 399
3.1 Data 399
3.2 Adjustment for year of registration 400
3.3 The cumulative risk of divorce 401
3.4 Differences by education 402
4 Results 403
4.1 Trends and levels 403
4.2 Educational differentials 405
5 Discussion 407
6 Acknowledgements 408
Notes 409
Research Article
Marital Dissolution in Japan:
Recent Trends and Patterns
James M. Raymo 1 Miho Iwasawa 2 Larry Bumpass 1
Abstract
Very little is known about recent trends in divorce in Japan. In this paper, we use Japanese vital statistics and census data to describe trends in the experience of marital dissolution across the life course, and to examine change over time in educational differentials in divorce. Cumulative probabilities of marital dissolution have increased rapidly across successive marriage cohorts over the past twenty years, and synthetic period estimates suggest that roughly one-third of Japanese marriages are now likely to end in divorce. Estimates of educational differentials also indicate a rapid increase in the extent to which divorce is concentrated at lower levels of education. While educational differentials were negligible in 1980, by 2000, women who had not gone beyond high school were far more likely to be divorced than those with more education.
________________________________
1. University of Wisconsin-Madison, Department of Sociology
1. Introduction
Over the past 30-40 years, substantial changes in family behavior and organization of the life course have occurred in all industrialized countries. Often characterized as the “second demographic transition,” these changes include: (a) delayed marriage and fertility, (b) increasing cohabitation, divorce, and non-marital childbearing, and (c) increasing maternal employment (Lesthaeghe 1995; McLanahan 2004). Theoretical explanations for these changes have focused on increasing economic opportunities for women, increasing consumption aspirations, declining economic prospects for men, as well as increasing secularization and growing emphasis on individual fulfillment (Lesthaeghe 1998). Key empirical features of these family changes include substantial socioeconomic and regional variation. For example, in her recent presidential address to the Population Association of America, Sara McLanahan (2004) argued that patterns of family change are following two different paths depending on social status. Changes with favorable implications for children (e.g., later marriage, delayed childbearing, maternal employment) are increasingly concentrated among women with greater socioeconomic resources whereas changes associated with unfavorable outcomes for children (e.g., divorce, non-marital childbearing) are increasingly concentrated among women with fewer socioeconomic resources. Family change associated with the second demographic transition thus has potentially important implications for social stratification in general and for growing socioeconomic differentials in the well-being of children in particular.
Although McLanahan (2004) emphasized the similarity of socioeconomic differentials in family behavior across a wide range of western industrialized countries, it is also clear that there is considerable variation across countries in the pace and the nature of family changes (Lesthaeghe 1995; Lesthaeghe and Moors 2000). In comparative studies, Japan stands out as one setting in which some family changes associated with the second demographic transition have been particularly rapid while others have been slow to emerge. A very early transition to below replacement fertility and a very late age at marriage place Japan at the forefront of the second demographic transition. At the same time, some family patterns associated with the second demographic transition, such as increases in maternal labor force participation and divorce have remained less prevalent than in most other low-fertility societies (Tsuya and Bumpass 2004). Despite rapid socioeconomic and normative change, other behaviors such as cohabitation and non-marital childbearing have been virtually absent (e.g., Thomson 2003) (Note 1).
societies (e.g., Mason, Tsuya, and Choe 1998). Previous studies of demographic change in Japan have linked declining rates of marriage and fertility to relatively universal social and economic forces of change including increasing educational attainment, increasing economic opportunities for women, increasing consumption aspirations, and more tolerant attitudes toward family behaviors such as late marriage and maternal employment (Raymo 2003; Retherford, Ogawa, and Matsukura 2001; Tsuya and Mason 1995). Theoretical discussions of the second demographic transition often place considerable emphasis on the role of increasing individualistic attitudes. A plausible explanation for the Japanese exception with respect to the most “deviant” behaviors is that the growth of individualism is at odds with the collectivist orientation of Japanese society (Atoh 2001). There is, however, some evidence that pressures may be building for a transition in cohabitation and perhaps even unmarried childbearing (Rindfuss et al., 2005).
2. Background
Following steady increases throughout the 1990s, Japan’s crude divorce rate reached 2.3 in 2002 (Figure 1). It is extremely important to recognize that, as illustrated at the right side of this figure, this is a level similar to most industrialized countries other than the U.S. The Japanese rate is also much higher than in Italy and Spain, two European countries with which Japan shares many other demographic similarities (Lesthaeghe and Moors 2000). As in the U.S., rapid increases in divorce suggest a major restructuring of the family life course in Japan. It will be important in future research to compare the consequences of divorce for women and children in Japan to those in other industrialized countries. The prevalence of extended family residence (Rindfuss et al. 2004) and the importance of family provided care (Ogawa and Retherford 1997) could moderate these consequences, while the highly asymmetric gender division of labor among spouses (Tsuya and Mason 1995) and married women’s relatively tenuous attachment to the labor force (Brinton 2001; Iwasawa 1999) could make the consequences of divorce even more profound for women and families in Japan than in other high-divorce societies. The social, economic, and family environments in which divorce occurs in Japan provide a valuable contrast to the U.S. and other western countries for studying the correlates and consequences of divorce.
Indeed, there is very little academic research on divorce at all. Existing work is limited to descriptions of trends in crude rates by age and sex (e.g., Koyama and Yamamoto 2001), analyses of regional variation in crude rates (Fukurai and Alston 1990; Uchida, Araki, and Murata 1993), and synthetic cohort analyses based on age-specific divorce rates--which ignore differences in marriage duration by age (Beppu 2002, Ikenoue and Takahashi 1994). The scarcity of research on divorce in Japan presumably reflects the limitations of available data. Complete marriage histories like those commonly analyzed for the U.S. and Western Europe are not available in Japan (Note 3). This does not mean, however, that we cannot learn more from the existing data.
We have three objectives in this paper. The first is to track the experiences over time of real marriage cohorts up until the duration when they can last be observed. The second is to use the most recently available period data to make synthetic cohort estimates of the cumulative proportion of marriages expected to end in divorce by various durations since marriage. These two results are presented and discussed together. Finally, we take the observed proportions divorced by ages 35-39 as reported in the census and make adjustments for differential age at marriage by education (affecting differences in duration since marriage at the observed ages) in order to approximate educational differences in the risk of divorce.
3. Data and methods
3.1 Data
3.2 Adjustment for year of registration
The divorce tabulations classify all divorces registered in a given year (between 1979 and 2002) by the year in which the marriage began and the year in which the marriage ended. Because roughly 10% of marriages and 30% of divorces are not registered in the year in which they occur (Ishikawa 1995), it is essential to measure marital duration using the years in which the union began and ended rather than the years in which marriage and divorce were registered. The vital statistics tabulations we use allow us to calculate the number of marital dissolutions by marriage cohort and marital duration by summing registered divorces in each year occurring to each marriage cohort—as measured by the years in which coresidence began and ended.
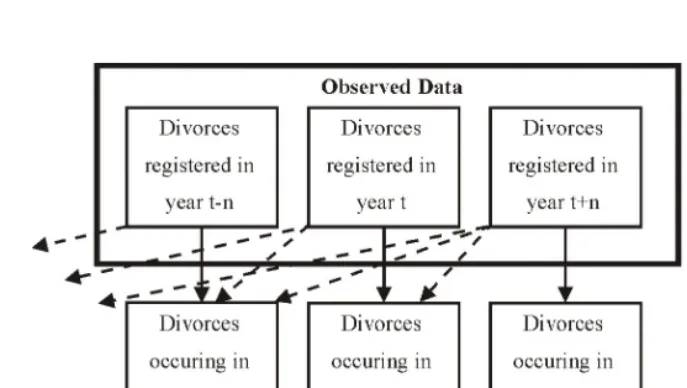
Because the earliest marriage cohort in the data is 1979 and the most recent year of data is 2002, we can observe divorces registered up to twenty-three years after they occurred (Note 4). Our counts become progressively less complete for the more recent years because for each succeeding year a higher proportion of the events will not yet have been registered. To construct yearly counts of divorce classified by year of marriage, we use the procedure described in Figure 2. We first subtract from each year's registered divorces those that occurred in earlier years and add them to the number events for the year in which they occurred (which have, in turn, had late registrations subtracted from them and reassigned to earlier years). The count of the number events for year t is simply the number of events registered in year t, minus those that occurred n years earlier, and plus those that were registered n years after year t (where n ranges from 1 to 23). These additions and subtractions of divorces registered with delay are represented by the bold dashed arrows in Figure 2. This creates a good count of annual events until the more recent years for which we no longer observe the large majority of late registrations. However, we can take advantage of the fact that patterns of delayed registration have been remarkably stable over time to estimate the number of divorces that have occurred by 2002 but will be registered in 2003 and beyond.
a given delay in the past. In all cases, these estimates were very close to the observed values.
We use similar techniques to construct yearly marriage cohorts. Vital statistics tabulations classify all marriages registered in a given year by the year in which the marriage actually occurred. As with the divorce data, we are thus able to reconstruct annual marriage cohorts by allocating late-registered marriages from the year in which they were registered back to the year in which they occurred (Note 6). We adjust the size of marriage cohorts upward by estimating marriages that have already occurred but have not yet been registered using the procedure described in the previous paragraph. With yearly counts of marriages and duration-specific numbers of marital dissolutions for each marriage cohort, it is straightforward to calculate the cumulative duration-specific proportions of each marriage cohort to experience marital dissolution. Rearranging cohort and specific dissolution probabilities as year and duration-specific dissolution probabilities allows us to calculate the synthetic cohort cumulative probability of marital dissolution for recent years. Because the earliest marriage cohort in our data is 1979, we can use observed dissolution probabilities in 2002 to calculate a synthetic cohort divorce trajectory through 23 years of marriage. For the sake of simplicity, we ignore mortality in these life-table calculations. This simplification is unlikely to affect results given the very low levels of young adult and mid-life mortality in Japan.
3.3 The cumulative risk of divorce
We begin by creating synthetic life-table estimates of cumulative divorce by duration of marriage. There are several important issues relating to these estimates. The first is that we use divorce data from 2002. It is important to use the most recently available data given that the crude divorce rate increased so dramatically during the 1990s—a decade characterized by very low levels of economic growth, corporate restructuring, and increasing unemployment (Yamagami 2002).
rates specific to durations since marriage. This difference between age-based and duration-based estimates is especially important in settings such as contemporary Japan where marriage timing has changed rapidly (Raymo 2003).
Finally, we present data for both real and synthetic cohorts. We are not aware of any previous analyses of marital dissolution in Japan describing the trajectories of real marriage cohorts.
3.4 Differences by education
Registration forms for vital statistics do not collect information on educational attainment, and large sample surveys such as the Current Population Survey or the National Survey of Families and Households which collect respondents’ socioeconomic characteristics and marital histories are not currently available in Japan (see Note 3).
Rather than waiting for such data to become available, we believe that it is important to take advantage of existing data to learn what we can. Consequently, we use data from the 1980, 1990, and 2000 census publications to describe educational differences in current marital status and to examine how these differentials have changed over time. It is important to recognize, however, that examining differentials in current marital status to shed light on educational differentials in divorce poses two significant problems. The first is that current marital status understates the actual amount of divorce because those who have divorced and remarried are simply classified as married (Note 7). We are thus forced to assume that there are no educational differentials in the likelihood of remarriage. Growing educational differentials in the transition to first marriage in Japan (Raymo 2003) suggest that this assumption may be violated. However, the fact that studies of remarriage in the U.S. and other industrialized societies have typically not found significant educational differentials in remarriage (de Graaf and Kalmijn 2003), suggests that the same may be true in Japan. Data from the Japanese National Fertility Surveys (JNFS), the only large survey containing information on both educational attainment and experience of divorce, suggest that educational differentials in remarriage are not large in Japan. However, because the number of ever-divorced respondents is small for some educational groups, we cannot confidently conclude from these data that educational differentials in remarriage are negligible. This caveat should be kept in mind when evaluating our results.
at younger ages, on average, than those in higher educational groups (Raymo 2003), the length of exposure to divorce is inversely related to educational attainment. We take a simple approach to addressing this problem. We first calculate age-specific mean ages at marriage by education, and we then weight the education-specific ever married populations by the number of years between mean age at first marriage and the census date. Dividing the divorced populations by these measures adjusts the prevalence of divorce to reflect educational differences in age of initial exposure to the risk of divorce. For each educational group at each census, we are thus able to calculate the number of currently divorced individuals for each year between initial exposure to the risk of divorce and the census date.
In order to calculate the education-specific values of mean age at marriage used to weight the ever married populations in the census tabulations, we use data from the Japanese National Fertility Surveys. Conducted every five years by the National Institute of Population and Social Security Research, these surveys provide information on educational attainment and age at marriage for large nationally representative samples of married women between the ages of 18 and 49. Measures of mean age at marriage for 1980 are calculated from the 1982 JNFS, values for 1990 are calculated from pooled data from the 1987 and 1992 JNFS, and values for 2000 come from the 1997 JNFS. Because tabulations of marital status by educational attainment in the census are presented by five-year age group, we calculate mean age at marriage for similar age groups in each of the JNF surveys. In the analyses presented below, we focus on ages 35-39 because women at these ages will have been married long enough for many divorces to occur, and yet their experience represents marriages over a relatively recent period.
We present these analyses and their results in two sections. In the first, we examine trends and levels in marital dissolution and in the second, we examine educational differentials in the prevalence of divorce.
4. Results
4.1 Trends and levels
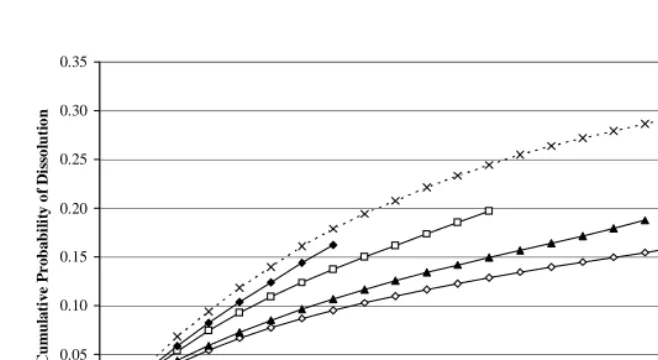
Figure 3 presents five cumulative divorce trajectories. The four solid lines represent the experience of the 1980, 1985, 1990, and 1995 marriage cohorts. The broken line represents the synthetic cohort dissolution trajectory calculated from duration-specific dissolution probabilities observed in 2002. The rapid increase in marital dissolution is very clear, particularly between the 1985 and 1990 marriage cohorts. The proportion of marriages ending within five years is 50% higher for the 1995 marriage cohort (12%) than for the 1980 marriage cohort (8%). The proportion of marriages dissolved within 10 years was 12% for marriages begun in 1980 and 17% for marriages begun in 1990. Despite the somewhat greater gap between marriages begun in 1985 and 1990, each successive cohort has experienced a higher proportion divorced at each duration since marriage. The synthetic cohort line continues this pattern with an increase over the 1995 cohort and then follows a smooth trajectory in which the proportion divorced by 12 years is about as much higher than the 1990 cohort as the 1990 cohort was relative to the 1985 cohort. This rough equivalence of a 10 year increase (between 2000 and 1990) to the prior 5 year change (between 1990 and 1985) suggests some attenuation in the rate of increase, but implies continuing increases in divorce nonetheless. We estimate the cumulative probability of marital dissolution within 20 years of marriage to be 30%, a figure that is substantially higher than the lifetime probability of divorce from earlier age-based estimates (Beppu 2002; Ikenoue and Takahashi 1994).
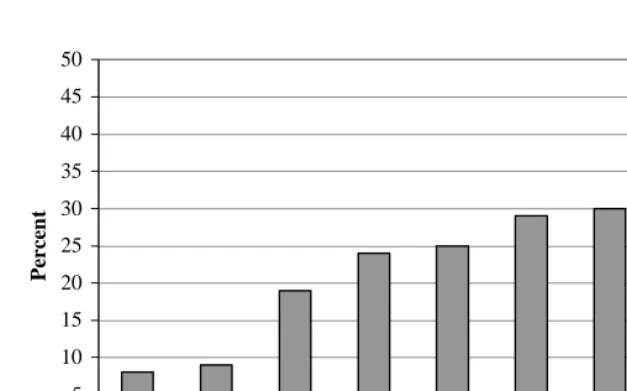
As we argued in the introduction, Japan’s markedly different family traditions make comparisons with the Western experience of the second demographic transition extremely valuable. Figure 4 compares the proportion of marriages expected to end in divorce by 20 years after marriage in Japan to those estimated for various European countries by Andersson and Philipov (2001). Our results here are startling. While the increase in rates of divorce in Japan is well recognized, it has gone unnoticed that Japan has fully experienced this component of the “second demographic transition.” The risk of divorce for new marriages in Japan now matches the highest levels in Europe, even though it is still considerably below that in the U.S. Rates are similar to those of Germany and Austria, slightly higher than those in Sweden and Finland, and substantially higher than those of France (30 vs. 19 percent) (Note 8).
suggests that a third of all marriages in Japan will end in divorce by 30 years after marriage. This has very substantial implications for family patterns in Japan, especially in light of evidence presented in the next section showing that the prevalence of divorce is relatively high among the less advantaged.
4.2 Educational differentials
It is extremely important to understand the extent to which this rapid increase in marital dissolution has occurred across the socioeconomic spectrum or is increasingly concentrated among certain groups. As noted above, cross-national studies of family change associated with the second demographic transition indicate that divorce is increasingly concentrated among the less educated (McLanahan 2004). We would expect to observe a similar pattern of change in Japan to the extent that economic hardship is associated with marital instability and to the extent that Japanese couples with more limited socioeconomic resources have been most adversely affected by the economic downturn of the 1990s.
We begin with tabulations of age and marital status by educational attainment for women in the 1980, 1990, and 2000 census publications. The census contains six categories of educational attainment: junior high school graduates, high school graduates, junior college/vocational school graduates, university graduates, in school, and never attended school. We do not consider the last two categories given the very small numbers in each and the largely irrelevant nature of the “in school” category beyond usual ages for schooling. In Figure 5, we present the unadjusted ratios of the divorced population to the ever married population by educational attainment for 35-39 year old women in 1980, 1990, and 2000. It is immediately clear that the prevalence of divorce has increased for all educational groups, especially between 1990 and 2000 (Note 9). In 1980, less than 5% of ever married 35-39 year-old women were currently divorced. By 2000, 15% of ever married women who did not finish high school and 7% of high school graduates were divorced. Increases in the prevalence of divorce for women with at least a two-year college degree have been relatively small. While it is important to keep in mind that these figures substantially understate experience of divorce given that roughly half of those who divorce eventually remarry, it seems clear that there has been a sharp increase in educational differentials in divorce over the past two decades.
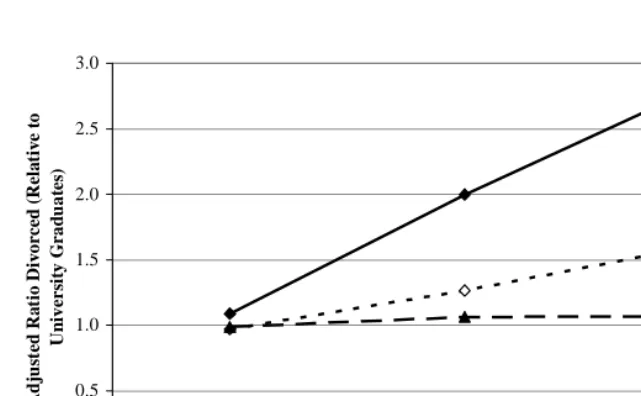
educational groups has little impact on the patterns described by the unadjusted data. Educational differences in the prevalence of divorce were negligible in 1980 but increased substantially over the following two decades. In 1990, there was a slight divergence between women with higher education and those who completed high school and a very large relative increase in the prevalence of divorce among women who did not finish high school. This divergence between women with and without higher education accelerated rapidly between 1990 and 2000. In the 2000 census, the adjusted prevalence of divorced female high school graduates is 1.6 times larger than for university graduates. Among women who did not complete high school, the prevalence of divorce is 2.8 times higher than among college graduates. Trends for women in the lowest educational category may be discounted given the increasingly small and select nature of this group – in the 2000 census, only 5% of 35-39 year-old women were classified as junior high school graduates. However, with high school graduates comprising 51% of 35-39 year-old women in 2000, it is clear that there are growing educational differentials in the experience of divorce in Japan.
There are two issues that could possibly result in the size of these differentials being overstated. First, because age at first marriage has increased substantially between 1980 and 2000, age at divorce has also increased, thus inflating the prevalence of divorce (i.e., women have had less time to remarry). If this pattern of change has differed by education, our results may overstate the increase in educational differentials in divorce. This seems most unlikely, however, since age at first marriage has been delayed most among the most highly educated women (Raymo 2003). Second, it is possible that educational differentials in the likelihood of remarriage following divorce have increased. If highly educated women are increasingly likely to remarry soon after divorce (relative to their less educated counterparts), the patterns depicted in Figure 6 would overstate the increase in educational differentials in divorce. We are not aware, however, of any empirical or anecdotal evidence to suggest that this is the case.
5. Discussion
Very little has been known about recent trends in marital dissolution in Japan. It is clear that crude divorce rates increased sharply during the 1990s, but the absence of more informative measures of the likelihood of divorce has hidden the scale of current levels. Furthermore, nothing was known about socioeconomic differentials in divorce. Our interest in understanding patterns of divorce in Japan is heightened by the contrast between the very homogeneous nature of the family life course in Japan and evidence of increasing socioeconomic differentials in family behavior in other industrialized societies. Is divorce increasingly common across socioeconomic strata, as suggested by the limited socioeconomic differentials in fertility trends and changes in marriage timing? Is divorce increasingly concentrated among those with fewer socioeconomic resources, as in other industrialized countries? In this paper, we have utilized available data to describe trends in the experience of marital dissolution across the life course and to examine trends in educational differentials in the prevalence of divorce.
Cumulative probabilities of divorce have increased markedly across marriage cohorts in Japan. Indeed, our synthetic cohort estimates indicate that roughly one-third of Japanese marriages are expected to end in divorce. This figure is similar to that observed in some western European countries and higher than the level in most. Japan is no longer a society characterized by low levels of marital dissolution. Rough estimates of educational differentials in the prevalence of divorce indicate that there has been a rapid increase over the past two decades in the extent to which divorce is concentrated among those with lower levels of education. While educational differentials in the prevalence of divorce were negligible in the 1980 census, women with a high school degree or less are far more likely than their more highly educated counterparts to be divorced in the 2000 census.
negative consequences for children of growing up with a single parent (e.g., McLanahan and Sandefur 1994)? In considering these questions, attention will need to be paid to the potential for even further divergence in family experience. If coresidence ameliorates the consequences of divorce for some women and children in Japan, these consequences may be very severe indeed for the majority who do not live with parents. In the absence of joint custody laws, what role do divorced fathers play in the lives of their children? What are the implications of divorce for father’s well-being? Subsequent research should address these questions not only to further understand the family implications of divorce in Japan but also to further understand the ways in which the consequences of divorce may be moderated by the family, legal, and economic contexts in which it occurs.
6. Acknowledgements
Notes
1. Japan’s total fertility rate has been below 2.1 since 1974. In 2002, the mean age at marriage was 27.4 for women and 29.1 for men, 1.9% of children were born to unmarried mothers, and 3% of unmarried 25-29 year old men and women were in cohabiting unions (National Institute of Population and Social Security Research 2004a, 2004b).
2. It is worth noting that low levels of divorce are not a “traditional” feature of the Japanese family. Historical studies (Fuess 2004; Hayami 1973) have documented very high levels of divorce among Japanese couples in the 19th century.
3. Marital history data are available from the National Family Research of Japan survey conducted by the Japan Society for Family Sociology and from the Japanese General Social Survey, but both surveys seriously underrepresent divorced respondents.
4. Vital statistics data obviously provide no information on marriages that were dissolved but never officially ended by registration of divorce. If “de facto” divorces are common in Japan, as in the U.S. (Bumpass, Castro Martin, and Sweet 1991), the vital statistics data will understate the incidence of divorce. Furthermore, if there are socioeconomic differentials in the likelihood of either registering divorce or self-report of divorce in the census, our analyses may understate or overstate educational differentials in the experience of divorce.
5. This adjustment procedure very closely resembles that described in Ishikawa (1995).
6. We use data on all divorces and marriages. We do not distinguish between first marriages and remarriages. Among women, first marriages comprised 91% of all marriages in 1979 and 85% of all marriages in 2002 (National Institute of Population and Social Security Research 2004a).
7. Tabulations of current marital status by experience of divorce among respondents to the Japanese National Fertility Surveys suggest that roughly 40% of divorced women and 60% of divorced men remarry.
8. The figures from Andersson and Philipov (2001) are based on data from the late 1980s and early 1990s.
References
Andersson, Gunnar and Dimiter Philipov. (2001). "Life-Table Representations of Family Dynamics in 16 FFS Countries." MPIDR Working Paper Series WP 2001-024, Rostock, Germany: Max-Planck Institute for Demographic Research.
Atoh, Makoto. (2001). "Very Low Fertility in Japan and Value Change Hypotheses."
Review of Population and Social Security Policy 10:1-21.
Beppu, Motomi. (2002). "An Analysis of the Marriage Life Cycle in Japan Using Multistate Life Tables: 1930, 1955, 1975, and 1995." Journal of Population
Studies 30:23-40. (in Japanese)
Brinton, Mary C. (1992). "Christmas Cakes and Wedding Cakes: The Social Organization of Japanese Women's Life Course." In Takie S. Lebra, editor.
Japanese Social Organization. Honolulu, HI: University of Hawaii Press:
79-107.
Brinton, Mary C. (2001). “Married Women's Labor in East Asian Economies.” In Mary C.Brinton, editor. Women's Working Lives in East Asia. Stanford, CA: Stanford University Press: 1-37.
Bumpass, Larry L., Martin Teresa Castro, and James A. Sweet. (1991). "The Impact of Family Background and Eary Marital Factors on Marital Disruption." Journal of
Family Issues 12:22-42.
de Graaf, Paul M. and Matthijs Kalmijn. (2003). "Alternative Routes in the Remarriage Market: Competing-Risk Analyses of Union Formation After Divorce." Social
Forces 81:1459-1498.
Fuess, Harald. (2004). Divorce in Japan: Family, Gender, and the State 1600-2000. Stanford, CA: Stanford University Press.
Fukurai, Hiroshi and Jon Alston. (1990). "Divorce in Contemporary Japan." Journal of
Biosocial Science 22:453-464.
Hayami, Akira. (1973). Historical Demographic Analysis of Rural Japan in Modern
Times. Tokyo: Tōyō Keizai Shimpōsha. (in Japanese)
Hodge, Robert W. and Naohiro Ogawa. (1991). Fertility Change in Contemporary
Japan. Chicago: University of Chicago Press.
Ikenoue, Masako and Shigesato Takahashi. (1994). “Multistate Marriage Life Tables.”
Ishikawa, Akira. (1995). “Statistical Comparison between Legal and Common-Law Marriage in Japan.” Journal of Population Problems 50(4):45-56. (in Japanese)
Iwasawa, Miho. (1999). “The Sate of Women’s Life Course in Contemporary Japan: Focusing on Never-Married Women’s Prospects.” Journal of Population
Problems 55(4):16-37. (in Japanese)
Koyama, Yasuyo and Chizuko Yamamoto. (2001). “Trends in Japanese Marriage and Divorce: 1996-1998.” Journal of Population Problems 57(3):53-76. (in Japanese)
Lesthaeghe, Ron. (1998). "On Theory Development and Applications to the Study of Family Formation." Population and Development Review 24:1-14.
Lesthaeghe, Ron. (1995). "The Second Demographic Transition—An Interpretation." In Karen O. Mason and Jensen An-Magrit, editors. Gender and Family Change in
Industrial Countries. Oxford, U.K.: Clarendon Press: 17-62.
Lesthaeghe, Ron and Guy Moors. (2000). "Recent Trends in Fertility and Household Formation in the Industrialized World." Review of Population and Social Policy 9:121-170.
Mason, Karen O., Noriko O. Tsuya, and Minja K. Choe. (1998). "Introduction." In Karen O. Mason and Minja K. Choe, editors. The Changing Family in
Comparative Perspective: Asia and the United States. Honolulu, HI: University
of Hawaii Press: 1-16.
McLanahan, Sara. (2004). " Diverging Destinies: How Children Are Faring Under the Second Demographic Transition." Demography 41:607-627.
McLanahan, Sara and Gary Sandefur. (1994). Growing up with a Single Parent: What
Hurts, What Helps. Cambridge, MA: Harvard University Press.
National Institute of Population and Social Security Research. (2004a). Latest
Demographic Statistics. Tokyo: National Institute of Population and Social
Security Research. (in Japanese)
National Institute of Population and Social Security Research. (2004b). Attitudes
toward Marriage and the Family among the Unmarried Japanese Youth - The Twelfth National Fertility Survey. Tokyo: National Institute of Population and
Social Security Research. (in Japanese)
Raymo, James M. and Miho Iwasawa. (2004). “Premarital Pregnancy and Spouse Pairing Patterns in Japan: Assessing How Novel Family Behaviors “Fit in” to the Family Formation Process.” Annual Meeting of the Population Association of America, Boston, MA (April 1-3).
Retherford, Robert D., Naohiro Ogawa, and Rikiya Matsukura. (2001). "Late Marriage and Less Marriage in Japan." Population and Development Review 27:65-102.
Rindfuss, Ronald R.; Minja Kim Choe, Larry L. Bumpass, and Yong-Chan Byun. (2004). “Intergenerational Relations.” In Noriko O. Tsuya and Larry L. Bumpass, editors. Marrriage, Work, and Family Life in Comparative
Perspective: Japan, South Korea, and the United States. Honolulu, HI:
East-West Center: 54-75.
Rindfuss, Ronald R., Minja Kim Choe, Larry Bumpass, and Noriko Tsuya. (2005). “Social Networks and Family Change in Japan.” American Sociological Review (Forthcoming).
Satō, Toshiki. (2000). Unequal Japan. Tokyo: Chūō Kōron Shinsha. (in Japanese)
Tachibanaki, Toshiaki. (2001). Economic Inequality in Japan. Tokyo: Iwanami Shoten. (in Japanese)
Thomson, Elizabeth. (2003). “Partnerships & Parenthood: A Comparative View of Cohabitation, Marriage and Childbearing.” Presented at the eleventh annual National Symposium on Family Issues, The Pennsylvania State University, College Park, PA (October).
Tsuya, Noriko O. and Larry L. Bumpass. (2004). “Introduction.” In Noriko O. Tsuya and Larry L. Bumpass, editors. Marrriage, Work, and Family Life in
Comparative Perspective: Japan, South Korea, and the United States. Honolulu,
HI: East-West Center: 1-18.
Tsuya, Noriko O. and Karen O. Mason. (1995). "Changing Gender Roles and Below Replacement Fertility in Japan." In Karen O. Mason and An-Magrit Jensen, editors. Gender and Family Change in Industrialized Countries. Oxford, U.K.: Clarendon Press: Pp. 139-167.
Uchida, Eiichi, Shunichi Araki, and Katsuyuki Murata. (1993). "Socioeconomic Factors Affecting Marriage, Divorce, and Birth Rates in a Japanese Population." Journal
of Biosocial Science 25:499-507.
Sweden Italy Canada Korea Australia Germany France Spain 0.0 0.5 1.0 1.5 2.0 2.5 3.0 3.5 4.0 4.5 19 65 19 67 19 69 19 71 19 73 19 75 19 77 19 79 19 81 19 83 19 85 19 87 19 89 19 91 19 93 19 95 19 97 19 99 20 01 CD R= D iv o r ce s/ 1 ,0 0 0 P o p u la ti o n USA
Figure 1: Trends in Japan’s Crude Divorce Rate and Recent Figures from Other Countries.
Figure 2: Adjustment Procedure Used to Construct Yearly Divorce Counts.
0.00 0.05 0.10 0.15 0.20 0.25 0.30 0.35
0 1 2 3 4 5 6 7 8 9 10 11 12 13 14 15 16 17 18 19 20 21 22 23
Union Duration (years)
Cu
mu
lat
ive
Pr
ob
ab
il
it
y
o
f Di
sso
lu
ti
o
n
1980 1985 1990 1995 2002*
*Refers to hypothetical cohort
0 5 10 15 20 25 30 35 40 45 50
Sp
ain
Italy
Fran
ce
Sweden Fin
land
Au
stria
German
y
Jap
a
n
USA
Percen
t
Figure 4: Proportion of Marriages Expected to Disrupt Within 20 Years: Life Table Estimates.
0.00 0.02 0.04 0.06 0.08 0.10 0.12 0.14 0.16 0.18
1980 1990 2000
# Di
vor
ce
d
/#
E
ve
r M
a
rr
ie
d
Junior High School High School Jr. College / Voc. School University
Figure 5: Ratio of Divorced to Ever Married 35-39 Year Old Women, by Educational Attainment: 1980, 1990, 2000.
0.0 0.5 1.0 1.5 2.0 2.5 3.0
1980 1990 2000
A
d
ju
st
ed
R
a
ti
o
D
iv
o
rced
(
R
el
a
ti
v
e t
o
Un
ive
rs
it
y G
rad
u
a
te
s)
Junior High School High School Jr. College / Voc. School