TEXTILE TECHNOLOGY
The Influence of Surface Electrolyte and Moisture Content
on the
Frictional Behavior of Cotton Fiber
Gary R. Gamble
G.R. Gamble, USDA-ARS, Cotton Quality Research Station, P.O. Box 792, Clemson, SC 29633; [email protected]
ABSTRACT
Cotton processing efficiency is dependent on the degree of friction between fibers and their processing environment as the fibers are subjected to the various pieces of equipment involved in converting fiber to yarn. This frictional behavior is a function of both fiber morphology and fiber surface characteristics. In this study, fiber surface electrolyte content and the moisture associated with the fiber were investigated to determine their potential role in the conversion of fiber to yarn. A single cultivar of cotton grown in Georgia dur-ing the 2003 crop year was treated with different electrolyte solutions at various concentrations, and then the frictional behavior of the cottons was examined using the Rotorring measurement. Results indicated that a coating of electrolyte on the surface of the cotton fiber may lead to either an increase or a decrease in fiber friction. The more hygroscopic electrolytes in general were responsible for increases in fiber-to-metal friction. Fiber-to-fiber friction was increased by all surface electrolyte treatments, which lead to the conclu-sion that the electrolyte content in conjunction with surface moisture confers anti-electrostatic properties that increases the coherence between individual fibers. Knowledge of this property will aid in predicting the processing performance of cotton fiber and the possibility of adjusting that performance through the application of electro-lyte solutions to the fiber.
I
t is widely recognized that the processing behavior of cotton fiber is governed to a considerable extent by the degree of coherence between the fibers in a bulk sample. Without this natural coherence, it would not be possible to form a useful yarn from a group of individual fibers. Previous work has demonstrated that different cottons do not necessarily possess thesame degree of fiber cohesion, and that differences in cohesion are correlated with differences in processing efficiency (Graham and Bragg, 1972; McAlister et al., 2003). Traditional textile processing includes a series of drafting processes which are dominated by the interaction between groups of fibers. It has been shown that traditionally measured fiber properties, including length, strength, and fineness, do not fully account for the observed differences in processing performance or resulting yarn quality (El Mogahzy and Robert, 1992). Other fiber features, including fiber convolution, fiber reversals, surface finish, and electrostatic potential, have been suggested as possible contributors to inter-fiber friction (El Mogahzy et al., 1995). Several methods, including the sliding of one fiber fringe over another under an applied load (Lord, 1955), a draft zone simulation measurement on roving prepared for ring spinning (Graham and Bragg, 1972), and the cohesion test (ASTM, 1997), have been developed to measure inter-fiber friction. In addition to inter-inter-fiber friction, there are also interactions between fibers and processing equipment at each stage of yarn production. This is especially true in rotor spinning and air-jet spinning, where the fibers experience a higher degree of surface contact with processing equipment and move at faster rates. Several instrumental techniques, including the Auburn Beard test (El Mogahzy and Broughton, 1993) and the Rotorring (Ghosh et al., 1992), have been utilized to simulate the frictional forces between cotton fibers and their processing environment.
a technique to measure the frictional forces of cotton fibers came later (El Mogahzy et al., 1997), and it has been demonstrated that this technique provides a useful method to realistically simulate the forces encountered by cotton fibers during processing.
The Five Year Leading varieties Study being conducted at USDA-ARS Cotton Quality Research Station includes the measurement of fiber friction using the Rotorring, as well as quantification of chemical factors on fibers, including wax, pectin, soluble electrolytes, moisture, and sugars. Results have indicated that the force necessary to open a single fiber from a 3-g sliver is correlated with bulk moisture content, pectin content, sugar content, and electrolyte content (Gamble, 2004). Wax content, however, was shown to exert little or no influence on fiber frictional measurements when present at naturally occurring levels, although it has been demonstrated that complete removal of the surface wax layer from cotton has a dramatic effect on friction (Cui et al., 2002). Those chemical factors correlated with fiber friction were further shown to be collinear, implying that any combination of these chemical factors is potentially related to the observed frictional behavior.
The objective of this study was to independently examine the effects of surface moisture and electro-lyte content on cotton fiber friction as measured by the Rotorring. This was achieved through the use of fiber sample from a single cotton cultivar grown in one location during the 2003 crop year. The sample was thoroughly washed in order to remove all soluble components, primarily sugars and salts, and subsequently treated with different concentra-tions of various salt soluconcentra-tions. The purpose of this method of preparation was to make the wax and pectin components constant factors and to remove surface sugar content as a variable.
MATERIALS AND METHODS
Cotton samples. The cotton cv. FiberMax 832
(Bayer CropScience; Research Triangle Park, nC) used in this study was grown in Georgia during the 2003 crop year. Prior to treatment, the cotton was washed with deionized water at 21 °C in sequential steps until the resulting solution exhibited no conduc-tivity due to naturally occurring surface electrolytes and no sugar content as measured by a previously described method (Gamble, 2001). The washed cot-ton samples were treated with the various electrolyte
solutions and oven dried at 105 °C. Subsequently, the samples were reconditioned at 65% relative humidity and 21 °C prior to performing subsequent measurements. The micronaire of the cotton (ASTM, 1997) was 3.56 and remained constant following all treatments.
Modification of surface electrolyte content.
Previous research established that the soluble cation content present on cotton fiber is comprised primarily of potassium (Brushwood and Perkins, 1994). hPAEC research performed in this laboratory has established that the predominant anions are malate, chloride, and sulfate (unpublished data, 2005). Using this informa-tion as a starting point, the pre-washed cotton samples were immersed in solutions of potassium malate (K2Malate; J.T. Baker Chemical Co.; Phillipsburg,
nJ), potassium chloride (KCl; Sigma Chemical Co.; St Louis, MO), potassium sulfate (K2SO4; J.T. Baker
Chemical Co.), sodium chloride (naCl, Sigma Chemi-cal Co.), sodium acetate (naOAc, Sigma ChemiChemi-cal Co.), lithium chloride (LiCl, J.T. Baker Chemical Co.), and tetraethylammonium acetate (TEAA , Sigma-Aldrich Chemical Co. St. Louis MO). Instead of using a wetting agent to effect solution wetting, the samples were repeatedly agitated manually to remove air and to allow wetting of the cotton surface by the immersion solution. After thorough wetting, each sample was squeezed manually to remove most of the retained solution. Typically, the cotton took up two times its own weight of the solution. next, the cotton was opened by hand and placed in a forced draft oven at 105 °C for 2 hr to completely dry the sample, after which all samples were allowed to recondition at 65% relative humidity and 21 °C for at least 16 hr prior to testing.
Moisture determination. Moisture
determina-tions on each of the treated cotton samples were performed three times according to standard test methods (ASTM, 2001).
Conductivity measurement. Cotton samples
were extracted using 20 ml of deionized water per gram of cotton, with three replicates performed for each of the treated cotton samples. Each sample was agitated with a glass rod in order to promote wetting of the cotton surface. The resultant wetted sample was allowed to sit for 15 min before being wrung out. The resulting extract was then subjected to conduc-tivity measurements. Conducconduc-tivity measurements, reported in microsiemens per centimeter (µΩ-1 cm-1),
Friction measurement. Four replicates for each treated cotton sample were evaluated for fiber friction using the Rotorring 580 (Spinlab; Knoxville, Tn). Slivers were approximately 208 g/m. Results of this measurement, reported in Joules (J), were converted to energy required to open a single fiber from the assembly using a previously described calculation (Gamble, 2004).
Statistics. All regression analyses were per-formed using SigmaPlot 8.0 (SPSS Science; Chi-cago, IL). One-way AnOvA were performed using SigmaStat 3.0 (SPSS Science). Means were separated using Duncan’s Multiple Range Test (P≤ 0.05).
RESULTS AND DISCUSSION
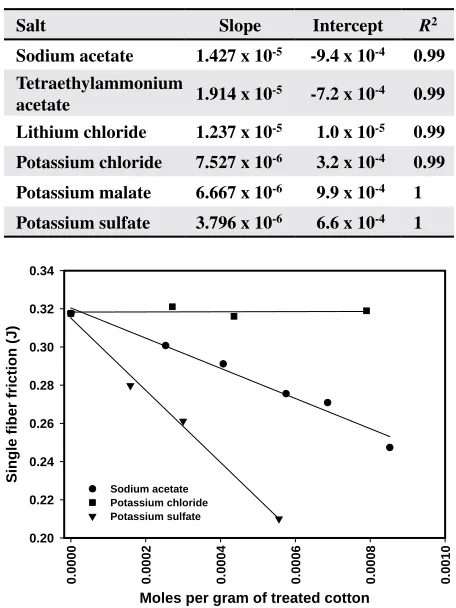
A series of solutions of known concentration were prepared for each electrolyte in deionized water. The relationships between electrolyte concentration in water solution and the solution conductivity are shown in Figure 1. Within the concentration ranges evaluated, the correlations between conductivity and molar concentration were linear (R2 = 0.99). This
al-lows the conductivity measurement to be converted to molarity for each of the salts used in this study using the linear relation y = mx + b (Table 1). The molarities were subsequently converted to moles per gram of treated cotton fiber based on this calculation. Conductivity values and the moles per gram of fiber are shown in Table 2.
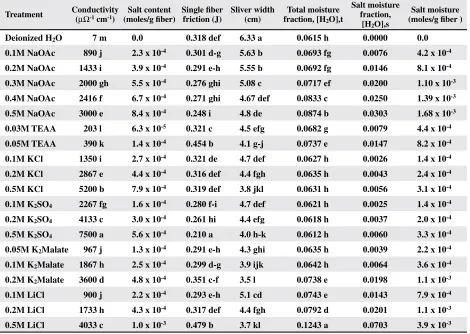
The relationship between surface electrolyte content, presented as moles per gram of treated cotton (mol/g), and single fiber friction as measured by the Rotorring for the samples treated with sodium acetate, potassium sulfate, and potassium chloride are shown in Figure 2. The data for sodium acetate and potas-sium sulfate indicate a linear relationship (R2 = 0.98
and 0.99, respectively) between single fiber friction and the amount of electrolyte present on the surface of the fiber. The relationship between fiber friction and surface concentration of potassium chloride over the range of concentrations tested did not change. The decrease in fiber friction associated with increasing sodium acetate and potassium sulfate concentrations is tentatively presumed to be the result of anti-elec-trostatic properties, i.e. the ability of the specific cation-anion combination to dissipate electrostatic charge created in the processing environment. The reasons for the lack of anti-electrostatic action with potassium chloride are unknown, but may be related to the fact that potassium and chloride exhibit similar
ionic radii that results in a relatively weak polariza-tion of the charge with this capolariza-tion-anion combinapolariza-tion. For potassium malate and lithium chloride, an initial decrease in fiber friction at lower surface concentra-tions, due presumably to an anti-electrostatic effect, changed to a rather dramatic increase in friction at
Table 1. Parameters used to fit the data presented in Figure 1 to the linear equation (y = mx + b, where y = concentration and x = conductivity)
Salt Slope Intercept R2
Sodium acetate 1.427 x 10⁻⁵ -9.4 x 10⁻⁴ 0.99
Tetraethylammonium
acetate 1.914 x 10⁻⁵ -7.2 x 10⁻⁴ 0.99
Lithium chloride 1.237 x 10⁻⁵ 1.0 x 10⁻⁵ 0.99
Potassium chloride 7.527 x 10⁻⁶ 3.2 x 10⁻⁴ 0.99
Potassium malate 6.667 x 10⁻⁶ 9.9 x 10⁻⁴ 1
Potassium sulfate 3.796 x 10⁻⁶ 6.6 x 10⁻⁴ 1
Conductivity (M7-1cm-1)
0 2 0 0 0 4 0 0 0 6 0 0 0 8 0 0 0 1 0 0 0 0 C o n c e n tr a ti o n (m o le s L -1) 0.00 0.01 0.02 0.03 0.04 0.05 0.06 Sodium acetate Tetraethylammonium acetate Lithium chloride Potassium chloride Potassium malate Potassium sulfate
Figure 1. Solution conductivity as a function of electrolyte concentration for the six salts used to treat cotton fiber.
Moles per gram of treated cotton
0. 00 00 0. 00 02 0. 00 04 0. 00 06 0. 00 08 0. 00 10 Si ng le fib er fr ic tio n (J ) 0.20 0.22 0.24 0.26 0.28 0.30 0.32 0.34 Sodium acetate Potassium chloride Potassium sulfate
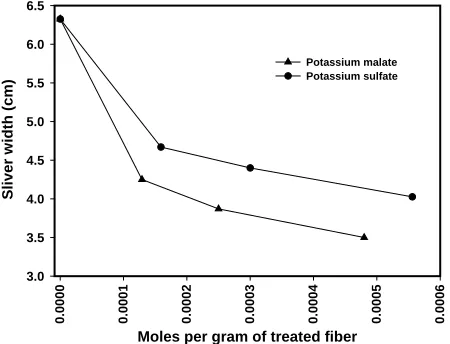
higher concentrations (Fig. 3). For tetraethylammo-nium acetate, a substantial increase in fiber friction was evident even at a low surface concentration (Fig. 3). Since the measured friction value is a combination of fiber-to-fiber and fiber-to-metal interactions, an ad-ditional measurement was required in order to explain the observed variation in fiber friction as a function of surface electrolyte. The width of the formed sliver is a function solely of fiber-to-fiber cohesion, and each of the electrolyte treatments decreased sliver width (Table 2). Sliver width as a function of increasing elec-trolyte surface concentration for potassium sulfate and potassium malate is shown in Figure 4. All of the salts used in this study exhibited similar behavior. Sodium acetate had the smallest effect on sliver width and tet-raethylammonium acetate had the greatest. The effect of surface salts on sliver width may be in part due to a decrease in inter-fiber electrostatic repulsive forces that arise because of the action of fibers being drawn across one another during the opening of the sliver. This effect may be alternatively viewed as an increase
in fiber-to-fiber friction. If this were the only friction variable involved with the Rotorring measurement, it might be expected that all of the salts used in this
Table 2. Physical and chemical fiber properties of the cotton subjected to different concentrations of the six salt treatments
Treatment Conductivity (µΩ-1 cm-1) (moles/g fiber)Salt content Single fiber friction (J) Sliver width (cm) fraction, [HTotal moisture 2O],t
Salt moisture fraction,
[H2O],s
Salt moisture (moles/g fiber )
Deionized H2O 7 m 0.0 0.318 def 6.33 a 0.0615 h 0.0000 0.0
0.1M NaOAc 890 j 2.3 x 10⁻⁴ 0.301 d-g 5.63 b 0.0693 fg 0.0076 4.2 x 10⁻⁴
0.2M NaOAc 1433 i 3.9 x 10⁻⁴ 0.291 e-h 5.55 b 0.0692 fg 0.0146 8.1 x 10⁻⁴
0.3M NaOAc 2000 gh 5.5 x 10⁻⁴ 0.276 ghi 5.08 c 0.0717 ef 0.0200 1.10 x 10⁻³
0.4M NaOAc 2416 f 6.7 x 10⁻⁴ 0.271 ghi 4.67 def 0.0833 c 0.0250 1.39 x 10⁻³
0.5M NaOAc 3000 e 8.4 x 10⁻⁴ 0.248 i 4.8 de 0.0874 b 0.0303 1.68 x 10⁻³
0.03M TEAA 203 l 6.3 x 10⁻⁵ 0.321 c 4.5 efg 0.0682 g 0.0079 4.4 x 10⁻⁴
0.05M TEAA 390 k 1.4 x 10⁻⁴ 0.454 b 4.1 g-j 0.0737 e 0.0147 8.2 x 10⁻⁴
0.1M KCl 1350 i 2.7 x 10⁻⁴ 0.321 de 4.7 def 0.0627 h 0.0026 1.4 x 10⁻⁴
0.2M KCl 2867 e 4.4 x 10⁻⁴ 0.316 def 4.4 fgh 0.0635 h 0.0043 2.4 x 10⁻⁴
0.5M KCl 5200 b 7.9 x 10⁻⁴ 0.319 def 3.8 jkl 0.0631 h 0.0056 3.1 x 10⁻⁴
0.1M K2SO4 2267 fg 1.6 x 10⁻⁴ 0.280 f-i 4.7 def 0.0621 h 0.0025 1.4 x 10⁻⁴
0.2M K2SO4 4133 c 3.0 x 10⁻⁴ 0.261 hi 4.4 efg 0.0618 h 0.0037 2.0 x 10⁻⁴
0.5M K2SO4 7500 a 5.6 x 10⁻⁴ 0.210 a 4.0 h-k 0.0612 h 0.0060 3.3 x 10⁻⁴
0.05M K2Malate 967 j 1.3 x 10⁻⁴ 0.291 e-h 4.3 ghi 0.0635 h 0.0039 2.2 x 10⁻⁴
0.1M K2Malate 1867 h 2.5 x 10⁻⁴ 0.299 d-g 3.9 ijk 0.0642 h 0.0064 3.6 x 10⁻⁴
0.2M K2Malate 3600 d 4.8 x 10⁻⁴ 0.351 c-f 3.5 l 0.0738 e 0.0198 1.1 x 10⁻³
0.1M LiCl 900 j 2.2 x 10⁻⁴ 0.293 e-h 5.1 cd 0.0743 e 0.0143 7.9 x 10⁻⁴
0.2M LiCl 1733 h 4.3 x 10⁻⁴ 0.317 def 4.4 fgh 0.0792 d 0.0201 1.1 x 10⁻³
0.5M LiCl 4033 c 1.0 x 10⁻³ 0.479 b 3.7 kl 0.1243 a 0.0703 3.9 x 10⁻³
Z Means within a column followed by the same letter are not significantly different according to Duncan’s Multiple Range
test (P≤ 0.05).
Moles per gram of treated cotton
0.
00
00
0.
00
02
0.
00
04
0.
00
06
0.
00
08
0.
00
10
0.
00
12
Si
ng
le
fib
er
fr
ic
tio
n
(J
)
0.25 0.30 0.35 0.40 0.45 0.50
Potassium malate Lithium chloride Tetraethylammonium acetate
Moles per gram of treated fiber
0.
00
00
0.
00
01
0.
00
02
0.
00
03
0.
00
04
0.
00
05
0.
00
06
Sl
iv
er
w
id
th
(c
m
)
3.0 3.5 4.0 4.5 5.0 5.5 6.0 6.5
Potassium malate Potassium sulfate
Figure 4. Rotorring sliver width as a function of surface concentration for cotton treated with potassium sulfate and potassium malate.
study would cause increases in single fiber friction. Comparison of the behaviors provided in Figures 2 and 3, however, demonstrates that this is not the case. The fact that potassium sulfate and potassium malate exhibited similar behaviors regarding decreasing sliver width but very different behaviors in overall fiber friction indicates that fiber-to-metal friction is much more sensitive to the nature of the surface salt than fiber-to-fiber friction.
where [h2O]t is the total moisture content as a
fraction of the total weight of the fiber, [h2O]f is
the contribution from the fiber, and [h2O]s is the
contribution from the surface salts.
In order to determine how much water is as-sociated with the surface salts, a series of equations must be used. [h2O]t is determined from the moisture
analysis of the entire sample, whereas [h2O]f and
[h2O]s must be determined via calculation.
Begin-ning with the relation
1 = [fiber] + [h2O]f + [salt] + [h2O]s [Eq. 2]
and substituting with Eq. 1,
1 = [h2O]t + [fiber] + [salt] . [Eq. 3]
[Salt] is determined by multiplying the measured value of moles/g cotton by the formula weight of the salt, so that [fiber] may be determined from
[fiber] = 1 - [h2O]t – [salt] . [Eq. 4]
From Table 2 the measured moisture content of washed, untreated fiber is 0.0615, so using the relation
0.0615 = [h2O]f / { [fiber] + [h2O]f} [Eq. 5]
and substituting in Eq. 4, [h2O]f is determined by
[h2O]f = {1 - [h2O]t – [salt]} / {16.2602 –1}. [Eq. 6]
When Eq. 6 is substituted into Eq. 1, the value of [h2O]s , the moisture fraction associated with
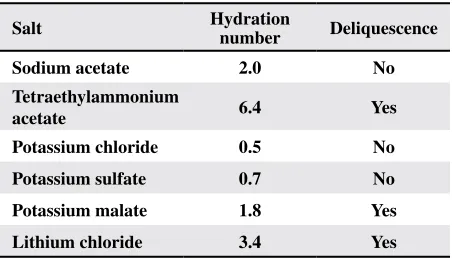
surface salts, may be calculated (Table 2). Division of this number by the formula weight of water then gives the number of moles of water per one gram of treated fiber (Table 2). When this value is divided by [moles salt/g fiber] (column 3, Table 2), a resulting hydration number is provided for each of the salts (Table 3). Sodium acetate and potassium malate have very similar hydration numbers (Fig. 2 and 3). Sodium acetate, however, causes a linear decrease in single fiber friction as a function of increasing con-centration, while potassium malate causes an initial decrease in fiber friction at lower concentrations that increases at higher concentrations. The explanation for this difference in behavior is related to the fact that potassium malate is deliquescent at the standard conditions used in this study, while sodium acetate remains solid. The liquid phase of water associated with potassium malate, as well as tetraethylam-monium acetate and lithium chloride, appears to be responsible for the observed frictional behaviors One of the most obvious differences between
the salts shown in Figure 2 and the salts shown in Figure 3 is the difference in their interactions with atmospheric moisture. The salts shown in Figure 3 (lithium chloride, potassium malate, and tetraeth-ylammonium acetate) are deliquescent at condi-tions of 65% relative humidity and 21 oC. Previous
work suggested that there is a relationship between moisture content and fiber friction, although this correlation is not necessarily independent of sur-face electrolyte content (Gamble, 2005). In order to further elucidate the relationship between surface electrolyte content and moisture content, a method which is capable of distinguishing between the moisture associated with the surface salts and the moisture associated with the cellulosic and pectic portions of the cotton fiber itself must be used. The observed weight fraction of the treated fiber due to moisture is a sum of the contributions of the surface salts and the moisture of the cotton fiber exclusive of the surface salts
exhibited in Figure 3. This liquid phase present on the surface of the fibers apparently interacts with the metal surfaces of the Rotorring via a hydrogen bonding mechanism, and a high surface tension ef-fectively provides an adhesive effect, resulting in high fiber-to-metal friction.
on the physical and electrostatic cohesive properties of the cotton fiber during processing are currently unknown. In order to answer these questions, the precise distributions of all of the naturally occurring salts on the cotton fiber must be further elucidated, which is the subject of a continuing investigation.
CONCLUSIONS
A single cultivar of cotton was subjected to treatment in different electrolyte solutions at differ-ent concdiffer-entrations, in which the frictional behavior of the cottons was measured using the Rotorring. Results indicated that various electrolytes on the surface of the cotton fiber may lead to either an in-crease or a dein-crease in fiber friction, with the more hygroscopic electrolytes in general being responsible for increases in fiber-to-metal friction due to surface tension. Fiber-to-fiber friction was increased by all surface electrolyte treatments, implying that elec-trolyte content in conjunction with surface moisture confers anti-electrostatic properties, increasing the coherence between individual fibers. The results of the present study hold a number of implications for cotton processing performance. The amounts and types of surface salts present on cotton fiber ap-peared to play a major role in both fiber-to-fiber and fiber-to-metal friction. A decrease in these surface salts due to environmental conditions resulted in decreased fiber coherence as a result of electrostatic repulsive forces between fibers, possibly leading to decreased yarn strength and increased imperfections. Increased fiber-to-metal friction resulting from the loss of non-hygroscopic salts from the outer fiber surface may lead to increased short fiber content as a result of the higher force required to open the fibers. The environmental conditions responsible for these changes in surface salt content cannot be controlled, so that a crop experiencing high amounts of rainfall may naturally exhibit difficulties in processing. Other difficulties of processing are due to a change in the surface chemical characteristics of the fiber. Aware-ness of these difficulties may allow fiber processors to compensate with adjustments to the processing equipment itself or by the application of oversprays, which would bring the surface characteristics of the fiber back to pre-weathering condition. The utility of both of these strategies are currently under investiga-tion in this laboratory.
Table 3. Calculated hydration numbers and observed deliquescence properties for salts on treated cotton fiber conditioned at 65% relative humidity and 21 °C
Salt Hydration number Deliquescence
Sodium acetate 2.0 No
Tetraethylammonium
acetate 6.4 Yes
Potassium chloride 0.5 No
Potassium sulfate 0.7 No
Potassium malate 1.8 Yes
Lithium chloride 3.4 Yes
REFERENCES
American Society for Testing and Materials (ASTM). 1997. Standard test method for fiber cohesion in roving, sliver, and top in dynamic tests (D 4120). In Annual Book of ASTM standards, vol. 07.02. ASTM, West Conshohock-en, PA.
American Society for Testing and Materials (ASTM). 1997. Standard test method for micronaire reading of cotton fibers (D1448-97). In Annual Book of ASTM Standards. vol. 07.01. ASTM, West Conshohocken, PA.
American Society for Testing and Materials (ASTM). 2001. Standard test method for moisture in cotton by oven dry-ing (D2495-01). In Annual Book of ASTM Standards. vol. 07.01. ASTM, West Conshohocken, PA.
Brushwood, D.E and h.h Perkins. 1994. Determining the metal content of cotton. Textile Chemist and Colorist 26(3):32-35.
Cui, X.L., J.B. Price, T.A. Calamari and J.M. hemstreet. 2002. Cotton wax and its relationship with fiber and yarn properties. Part I: wax content and fiber properties. Textile Res. J 72(5): 399-404.
Dhindsa, R.S, C.A. Beasley and I.P. Ting. 1975. Osmoregu-lation in cotton fiber. AccumuOsmoregu-lation of potassium and malate during growth. Plant Physiol. 56:394-398. El Mogahzy, Y.E. and R.M. Broughton. 1993. A new approach
for evaluating the frictional behavior of cotton fibers. Part I: fundamental aspects and measuring techniques. Textile Res. J. 63(8): 465-475.
El Mogahzy, Y.E. and K.Q. Robert. 1992. Descriptive evalua-tion of fiber/machine interacevalua-tion in spinning. p. 1277-1281. In Proc. Beltwide Cotton Conf., new Orleans, LA. 10-14 Jan 1992. natl. Cotton Counc. Am., Memphis, Tn. El Mogahzy, Y., R. Broughton and h. Guo. 1997. Cotton fiber friction: The unknown quality of cotton. p. 545-552. In Proc. Beltwide Cotton Conf., new Orleans, LA. 7-10 Jan. 1997. natl. Cotton Counc. Am., Memphis, Tn. El Mogahzy, Y.E., R. Broughton and Q. Wang. 1995. The
frictional profile of cotton fibers and its importance in determining fiber performance in the nonwoven process. Part I: fundamental aspects of fiber friction and lubrica-tion. Int. nonwovens J. 7(1): 26-33.
Gamble, G.R. 2001. Evaluation of an enzyme-based method for the detection of stickiness potential on cotton lint [Online]. J. Cotton Sci. 5:169-173. Available at http:// www.cotton.org/journal/2001-05/3/169.cfm
Gamble, G.R. 2004. Implications of surface chemistry on cot-ton fiber processing [Online]. J. Cotcot-ton Sci. 8:198-204. Available at http://www.cotton.org/journal/200408/3/198. cfm
Gamble, G.R. 2005. Cotton fiber chemical differences and their effect on friction behavior: a comparison of two crop years in the ATMI/ARS leading cultivars study [Online]. J. Cotton Sci. 9:56-64. Available at http://www. cotton.org/journal/2005-09/1/56.cfm.
Ghosh, S., J.E. Rodgers and A.E. Ortega. 1992. Rotor ring measurement of fiber cohesion and bulk properties of staple fibers. Textile Res. J. 62(10):608-613.
Graham, J.S. and C.K. Bragg. 1972. Draft force measure-ment as an aid to cotton spinning. Textile Res. J. 42(3): 175-181.
Lord, E. 1955. Frictional forces between fringes of fibers. J. Textile Inst. 46:41-58.