DEMOGRAPHIC RESEARCH
VOLUME 31, ARTICLE 2 PAGES 27−70
PUBLISHED 2 JULY 2014
http://www.demographic-research.org/Volumes/Vol31/2/ DOI: 10.4054/DemRes.2014.31.2
Research Article
Factors responsible for mortality variation in the
United States: A latent variable analysis
Christopher Tencza
Andrew Stokes
Samuel Preston
©2014 Christopher Tencza, Andrew Stokes & Samuel Preston.
This open-access work is published under the terms of the Creative Commons Attribution NonCommercial License 2.0 Germany, which permits use, reproduction & distribution in any medium for non-commercial purposes, provided the original author(s) and source are given credit.
2 Background and approach 29
3 Data and methods 31
4 Results 33
4.1 Relation of factors to all-cause mortality 42
4.2 Validation 44
5 Discussion 46
6 Acknowledgements 48
References 49
Factors responsible for mortality variation in the United States:
A latent variable analysis
Christopher Tencza1
Andrew Stokes2
Samuel Preston3
Abstract
BACKGROUND
Factors including smoking, drinking, substance abuse, obesity, and health care have all been shown to affect health and longevity. The relative importance of each of these factors is disputed in the literature, and has been assessed through a number of methods.
OBJECTIVE
This paper uses a novel approach to identify factors responsible for interstate mortality variation. It identifies factors through their imprint on mortality patterns and can therefore identify factors that are difficult or impossible to measure directly, such as sensitive health behaviors.
METHODS
The analysis calculates age-standardized death rates by cause of death from 2000-2009 for white men and women separately. Only premature deaths between ages 20-64 are included. Latent variables responsible for mortality variation are then identified through a factor analysis conducted on a death-rate-by-state matrix. These unobserved latent variables are inferred from observed mortality data and interpreted based on their correlations with individual causes of death.
RESULTS
Smoking and obesity, substance abuse, and rural/urban residence are the three factors that make the largest contributions to state-level mortality variation among males. The same factors are at work for women but are less vividly revealed. The identification of factors is supported by a review of epidemiologic studies and strengthened by
correlations with observable behavioral variables. Results are not sensitive to the choice of factor-analytic method used.
CONCLUSIONS
The majority of interstate variation in mortality among white working-age adults in the United States is associated with a combination of smoking and obesity, substance abuse and rural/urban residence.
1. Introduction
Understanding the underlying causes of variation in mortality is useful for health policy and intervention design. However, risk factors can be difficult to measure directly, as observed measures are often products of traits or circumstances that are unobserved, partially observed, or complex and multidimensional. An alternative is to infer the effects of risk factors indirectly using a latent variable approach. Because factors that influence mortality typically manifest themselves in several causes of death, associations among causes of death over time or space may provide important information about underlying causal factors. Without explicitly introducing a latent variable model, such reasoning has been used to infer the role of cigarette smoking (Peto et al. 1992; Preston et al. 2011) and the quality of the health care system in explaining variation in US mortality (Nolte and Mckee 2004).
In this paper we take advantage of variation in mortality by cause of death across US states to identify the underlying factors that are creating such variation. The emphasis is on behavioral factors that affect the risk of death. Previous studies have suggested that behavioral factors play a leading role in explaining US mortality (Mokdad et al. 2004; Mokdad et al. 2005; Murray et al. 2006; Danaei et al. 2009; 2010; Mehta and Preston 2012; Murray et al. 2013).
and especially the duration and past intensity of the habit. These elements are not readily captured in a single variable. Data on other behaviors, such as use of illicit drugs and unsafe sex, are often unreliable because of their sensitive nature. Finally, the source of data for most regional analyses of health patterns in the US, the Behavioral Risk Factor Surveillance Survey (BRFSS), is subject to several important limitations related to validity and comparability of data, including reliance on self-reported data, exclusion of households without telephones, and high rates of non-response. The national response rates for BRFSS in 2011 were 53.0% for landlines and 27.9% for cell phones (Centers for Disease Control and Prevention 2013a).
The present study takes an entirely different approach. It treats behavioral factors as latent variables that are identifiable through covariation of causes of death across populations. The operation of a particular risk factor is expected to appear in the form of high correlations across states within the cluster of causes of death for which its relative risks are greatest. Unlike prior studies, the present study is not limited to the subset of risk factors that can be reliably measured; thus it has the potential to uncover previously overlooked patterns of risk in populations. Also, because this approach is independent of the attributable-risk approach, it provides a valuable independent assessment of the contribution of behavioral risk factors to mortality variation.
2. Background and approach
Through straightforward decompositional methods, inter-population differences in death rates or life expectancy can be readily assigned to various causes of death (Preston et al. 2001). Beyond their contributions to such accounting exercises, death rates from a particular cause have also been used as indicators of broader determinants of mortality. One set of applications of this approach has used particular causes of death (variously termed “sentinel”, “tracer” or “amenable” causes) as indicators of the performance of a medical system (Polednak 2000; Nolte and McKee 2008).
Furthermore, there is no reason to expect that smoking is the only factor at work in fashioning population mortality patterns: the role of smoking should be inferred in a multivariate context.
Figure 1: Directed acyclic graphs portraying the (A) incorrect causal model; (B) correct causal model
A
Lung Cancer Other Causes of Death
B
Lung Cancer
Smoking
Other Causes of Death
Notes: In Preston et al. 2011, lung cancer was treated as a marker of smoking and used to predict the effects of smoking on other causes of death. The causal model inherent to this approach is portrayed in (A). This model is incorrect because lung cancer and other causes of death are not causally related. In the present analysis smoking is treated as a latent variable and its effects are inferred from the correlation structure among causes of death with which smoking is associated. The causal model inherent in this approach is portrayed in (B). This model correctly characterizes the relationship between the variables.
In the present analysis we assume that behavioral factors are latent variables whose effects manifest themselves in a variety of causes of death. We will employ a list of mutually exclusive causes of death, without prejudging which causes of death, or behavioral risk factors, are to be featured.
studies, and meta-analyses thereof, to identify the causes of death that demonstrate the highest relative risks for a particular risk factor.
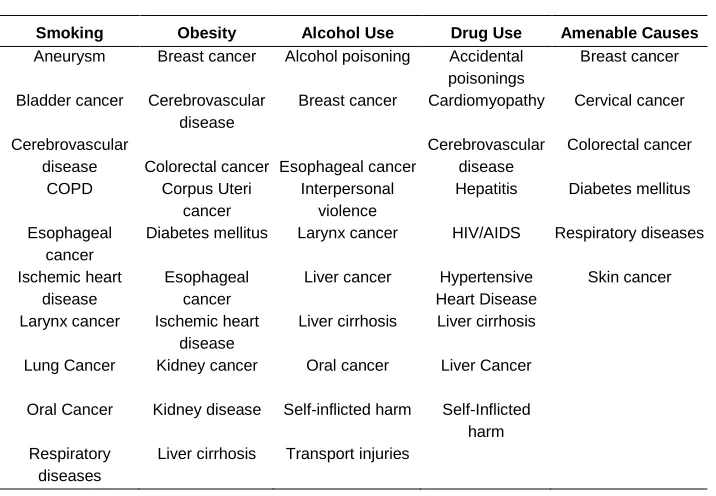
Table 1 presents, in alphabetical order, the set of causes of death that we expect to be most closely associated with the five risk factors that we consider. Amenable causes represent deaths that are considered avoidable through medical services. References to the studies that support such identifications are included.
Table 1: Risk factors and associated causes of death
Smoking Obesity Alcohol Use Drug Use Amenable Causes
Aneurysm Breast cancer Alcohol poisoning Accidental
poisonings
Breast cancer
Bladder cancer Cerebrovascular
disease
Breast cancer Cardiomyopathy Cervical cancer
Cerebrovascular
disease Colorectal cancer Esophageal cancer
Cerebrovascular disease
Colorectal cancer
COPD Corpus Uteri
cancer
Interpersonal violence
Hepatitis Diabetes mellitus
Esophageal cancer
Diabetes mellitus Larynx cancer HIV/AIDS Respiratory diseases
Ischemic heart disease
Esophageal cancer
Liver cancer Hypertensive
Heart Disease
Skin cancer
Larynx cancer Ischemic heart
disease
Liver cirrhosis Liver cirrhosis
Lung Cancer Kidney cancer Oral cancer Liver Cancer
Oral Cancer Kidney disease Self-inflicted harm Self-Inflicted
harm Respiratory
diseases
Liver cirrhosis Transport injuries
Abbreviations: COPD, Chronic Obstructive Pulmonary Disease.
Notes: Causes of death are compiled from the following sources. Smoking: Pirie et al. 2012, Ezzati et al. 2005a, Ezzati et al. 2005b, Oza et al. 2011; Obesity: Whitlock et al. 2009, Renehan et al. 2008. Alcohol Use: Lim et al. 2013, Corrao et al. 2004, Taylor et al. 2010. Drug Use: Single et al. 1999, Van Den Berg et al. 2007, Wijetunga et al. 2003. Amenable Causes: Nolte and McKee 2004, 2008, Polednak 2000.
3. Data and methods
correlated variables by means of a smaller number of latent, unobserved variables or ‘factors’. These factors are ordered by the amount of variance they explain. Each factor identified has a factor loading for each of the observed variables (i.e., mortality rates for a particular cause of death). The loading is the correlation between that factor and a particular cause of death, and the sum of their correlations across k factors is how much variation in that cause of death can be explained by k factors. Each factor also produces a factor score for each observation (i.e., state), indicating the relative intensity of the operation of that factor in the state.
In mathematical terms, cause-specific death rates (C1, C2…Cp) are treated as
functions of underlying factors (F1, F2…Fm). Each cause of death is linearly related to
the chosen number of factors as shown:
Cj= Bj1F1 + Bj2F2 +…+BjmFm+ ej (1)
where Cj represents the jth of p causes of death obtained from n independent subjects (states). Bjm represent the factor loadings relating cause of death j to the mth factor F, and ej represents the variance unique to cause of death Cj (Brown 2006).
We examine mortality by cause of death for white persons aged 20-64. Deaths within this age range are conventionally considered ‘premature’. Those dying are less likely to suffer from multiple pathologic processes that can make cause of death assignments more uncertain at older ages. As demonstrated in the electronic supplementary material, results are very similar when the age range is expanded. Attention is confined to the white population in order to minimize the role of sources of variation associated with race.
We obtained counts of deaths by age, state, and cause of death from the National Center of Health Statistics (NCHS) (2010). State identifiers for deaths in years 2007-2009, not available in the public-use mortality file, were obtained through a special request to the NCHS. State level mid-year population estimates are taken from the National Center for Health Statistics bridged-race population estimates (National Center for Health Statistics 2012b). Hawaii is dropped from the analysis because of its very small number of deaths. We calculate the death rates by age, state, and cause of death over the decade 2000‒2009. By pooling ten years of data we are able to calculate reliable rates for a larger set of causes of death. We then age-standardize the death rates using the age distribution of the US population in 2000 as the standard (Anderson and Rosenberg 1998). We perform separate analyses for men and women.
supplementary material. Most of these adjustments disaggregate individual causes of death with epidemiological significance from larger groups of causes (e.g., alcoholic liver cirrhosis is separated from the cirrhosis of the liver category). Causes of death with fewer than 5,000 deaths for either sex during the decade for the US as a whole are eliminated from the analysis.
Analysts using factor analysis face several methodological choices. For our basic analysis we use the procedures that are most conventional: factors are assumed to be uncorrelated with one another, factor scores for each state or state-year are estimated using the regression-based approach, scree plots are used to determine the number of factors selected, and varimax rotation is used after determining the number of factors to retain. As demonstrated in the electronic supplementary material, results are not sensitive to these choices.
This is not the first effort to use factor analysis or its close relative, principal components analysis, in a study of mortality variation (see United Nations (1982) and Gavrilova et al. (2002) for earlier examples). However, to the best of our knowledge it is the first effort to use spatial variation in mortality by cause of death to identify latent variables responsible for mortality variation.
4. Results
We chose to include three factors for each sex, because plots of the proportion of variance explained by the successive addition of factors to the analysis (scree plots) show a rapid fall-off after three for males. For females the drop off is not as abrupt, but we retained three factors to remain consistent across sexes. In the electronic supplementary material we show that factor loadings for the first three factors are not sensitive to the choice of the number of factors retained. The scree plots and eigenvalues of the factor analysis also appear in the electronic supplementary material. The first factor explains 34% of the total variance in causes of death for males and 33% of the total variance for females. The cumulative variance explained by three factors is 61% and 56% for males and females, respectively.
correlation of any cause of death with any factor for either sex. This result is a clear indication of the importance of smoking to explaining interstate variation in mortality.
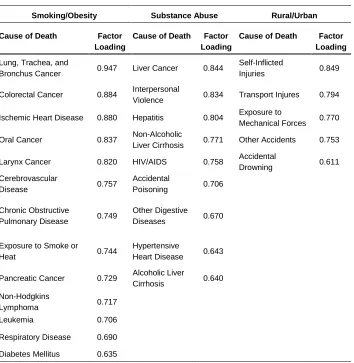
Table 2: Male factor loadings
Smoking/Obesity Substance Abuse Rural/Urban
Cause of Death Factor
Loading
Cause of Death Factor
Loading
Cause of Death Factor
Loading
Lung, Trachea, and
Bronchus Cancer 0.947 Liver Cancer 0.844
Self-Inflicted
Injuries 0.849
Colorectal Cancer 0.884 Interpersonal
Violence 0.834 Transport Injures 0.794
Ischemic Heart Disease 0.880 Hepatitis 0.804 Exposure to
Mechanical Forces 0.770
Oral Cancer 0.837 Non-Alcoholic
Liver Cirrhosis 0.771 Other Accidents 0.753
Larynx Cancer 0.820 HIV/AIDS 0.758 Accidental
Drowning 0.611
Cerebrovascular
Disease 0.757
Accidental
Poisoning 0.706
Chronic Obstructive
Pulmonary Disease 0.749
Other Digestive
Diseases 0.670
Exposure to Smoke or
Heat 0.744
Hypertensive
Heart Disease 0.643
Pancreatic Cancer 0.729 Alcoholic Liver
Cirrhosis 0.640
Non-Hodgkins
Lymphoma 0.717
Leukemia 0.706
Respiratory Disease 0.690
Diabetes Mellitus 0.635
Most of the other causes of death that are heavily loaded on Factor 1 are also closely associated with smoking: COPD, oral cancers, ischemic heart disease, and cerebrovascular disease. Such a pattern accords with our expectations about patterns of variation by cause of death that should be observed if smoking were an important contributor to interstate variation in mortality. In fact, 7 of the 10 causes of death identified in Table 1 to be most strongly associated with smoking have loadings on Factor 1 above 0.60. The 3 remaining causes of death identified for smoking in Table 1 have moderately high loadings: esophagus cancer (0.594), aneurysm (0.567), and bladder cancer (0.457). Also appearing on the list of heavily loaded causes of death is exposure to smoke and heat, often a consequence of careless smoking (United States Fire Administration 2013).
One cause of death with only mildly elevated risks for smokers also appears on the list of causes with high loadings on Factor 1: diabetes mellitus. That is one of the most important causes of death through which obesity operates. Colorectal cancers are also closely associated with obesity (Table 1) and appear in the list of heavily loaded causes on Factor 1. Cerebrovascular disease and ischemic heart disease appear on the lists of diseases closely associated with both smoking and obesity. In other words, Factor 1 includes representations of both smoking and obesity as causal factors in mortality variation, and their influences are not readily disentangled. This issue is addressed in more detail below.
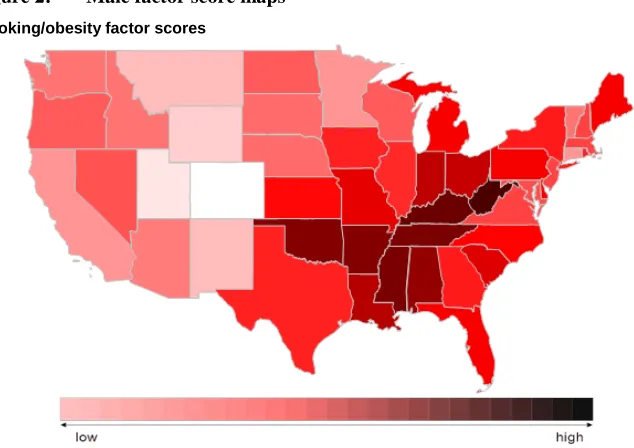
Figure 2 shows the map of factor scores for Factor 1 among males. Clearly, this factor is heavily concentrated in the Appalachian region down through the Deep South. The lowest factor scores are concentrated in the West, especially Utah and Colorado. This pattern is highly correlated with death rates from lung cancer, but it is also highly correlated with death rates from all causes combined (r = .72). This latter correlation is not a necessary result of using factor analysis because the correlations between causes of death do not reflect the relative magnitude of death rates from various causes, only their patterns of variation across multiple causes.
substance abuse as a major factor in explaining mortality variation is an important finding, as previous studies have found it difficult to measure substance abuse and to understand its contribution to mortality variation. This appears to be the first instance in which a geographic pattern of mortality from various causes of death associated with substance abuse has been identified.
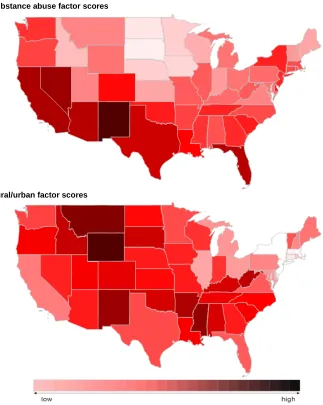
Figure 2 shows a map of factor scores for male Factor 2. The highest scores occur in states along the southern perimeter from Florida to California, with the highest scores in New Mexico and Nevada. Lowest values are observed in the upper Midwest, especially in North and South Dakota. Unlike other factors, we have a limited understanding of the expected geographic variation in substance abuse, and therefore are more speculative in our interpretation of the factor scores. One hypothesis is that the geographic pattern could reflect a greater relative ease of drug trafficking along the southern border.
Figure 2: Male factor score maps
Smoking/obesity factor scores
Figure 2: (Continued)
Substance abuse factor scores
Rural/urban factor scores
Factor 3 for males is a vivid pattern associated with injuries. The five causes of death that correlate the highest with this factor are all some form of injury, including self-inflicted injuries, transport injuries, exposure to mechanical forces, other accidents, and drowning (Table 2). The death rate from falls is the next most highly correlated with Factor 3 at 0.586. While deaths from drowning and falls are not numerous, their geographic distribution is quite similar to that of several more important sources of fatal injury.
Figure 2 presents the map of factor scores for male Factor 3. Montana and Wyoming lead the way in injury mortality, with other states in the Mountain time zone also exhibiting high scores. States with large urban populations like New York, Massachusetts, New Jersey, Illinois, and California have the lowest scores on this factor. Below, we demonstrate more formally the connection between rurality and Factor 3, a connection that supports our designation of this factor as a rural/urban factor. That mortality from injuries is higher in rural areas has been clearly demonstrated (Myers et al. 2013). A high rate of mass transit use may help keep mortality from transport injuries low in urban states, while lower population density in rural states may increase driving exposure. An individual’s greater proximity to trauma centers in urban areas may also contribute (Myers et al. 2013). Another factor may be increased exposure to occupational hazards in rural areas. That suicide is also heavily loaded on this factor is intriguing, since transport injuries, falls, and drownings represent additional ways of ending one’s life. Residents of rural areas have traditionally had higher suicide rates than urban residents (McCarthy et al. 2012; Singh and Siapush 2002). Furthermore, the map may reflect injury prevention laws, since mountain states tend to have the fewest injury prevention laws and northeastern states the most (Levi et al. 2012).
substance abuse as is Factor 2 for males. Nevertheless, female Factor 1 scores and male Factor 2 scores are correlated at a modest 0.60, indicating that they are tapping into somewhat the same sources.
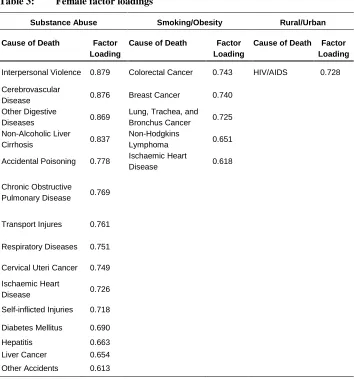
Table 3: Female factor loadings
Substance Abuse Smoking/Obesity Rural/Urban
Cause of Death Factor
Loading
Cause of Death Factor
Loading
Cause of Death Factor Loading
Interpersonal Violence 0.879 Colorectal Cancer 0.743 HIV/AIDS 0.728
Cerebrovascular
Disease 0.876 Breast Cancer 0.740
Other Digestive
Diseases 0.869
Lung, Trachea, and
Bronchus Cancer 0.725
Non-Alcoholic Liver
Cirrhosis 0.837
Non-Hodgkins
Lymphoma 0.651
Accidental Poisoning 0.778 Ischaemic Heart
Disease 0.618
Chronic Obstructive
Pulmonary Disease 0.769
Transport Injures 0.761
Respiratory Diseases 0.751
Cervical Uteri Cancer 0.749
Ischaemic Heart
Disease 0.726
Self-inflicted Injuries 0.718
Diabetes Mellitus 0.690
Hepatitis 0.663
Liver Cancer 0.654
Other Accidents 0.613
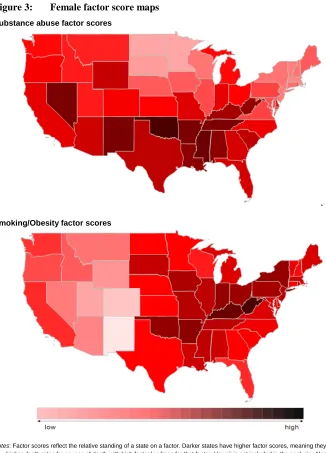
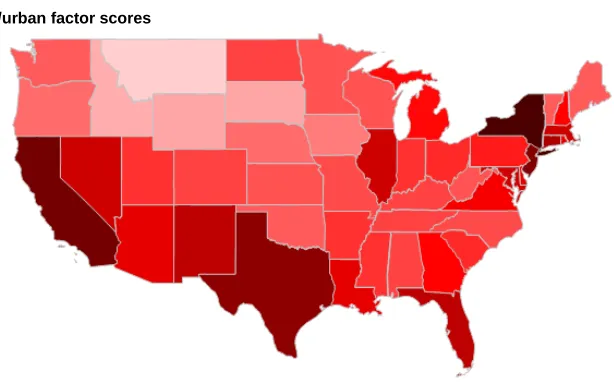
Figure 3: Female factor score maps
Substance abuse factor scores
Smoking/Obesity factor scores
Figure 3: (Continued)
Rural/urban factor scores
Notes: Factor scores reflect the relative standing of a state on a factor. Darker states have higher factor scores, meaning they have higher death rates for causes of death with high factor loadings for that factor. Hawaii is not included in the analysis. Alaska is not shown in the figure.
Figure 3 presents a map of factor scores for Factor 1 for women. As in the case of substance abuse for men (Figure 2), scores for women are lowest in the upper Midwest and high in the Southwest, especially in New Mexico and Nevada. However, high scores are also found in Appalachia for women, whereas male scores in Appalachia were closer to zero.
highest in a band that runs from West Virginia through Kentucky, Arkansas, and Oklahoma, with high scores in the Midwest as well. The lowest factor scores can be found in the West, especially the Four Corners. This map is quite similar to that of male Factor 1, as implied by the high correlation between the factors. Alcohol poisoning and alcoholic liver cirrhosis are two negatively loaded causes on this factor (see Appendix Table S3), implying a negative spatial association between alcohol abuse and smoking/obesity.
Factor 3 for females does not emerge as a coherent set of causes of death since only one cause, HIV/AIDS, has a factor loading above 0.60. This result is consistent with the fact that female Factor 3 explains less variance (8.4%) than male Factor 3 (13.4%). However, as shown below, Factor 3 for females has an important rural/urban dimension, as it does for males. The death rate from HIV/AIDS can be interpreted as a (negative) indicator of rurality. In fact, death rates from injury, which dominate Factor 3 for males, are negatively correlated with Factor 3 for females: falls (-0.416), transport injuries (-0.411), other accidents (-0.309) and self-inflicted wounds (-0.276). Male and female factor scores for Factor 3 have a fairly strong inverse relationship (r= -0.60). The highest scores on Factor 3 for females is found in states with the largest urban areas: New York, New Jersey, California, Texas, Illinois, and Florida. The lowest factor scores are concentrated in the Northwest.
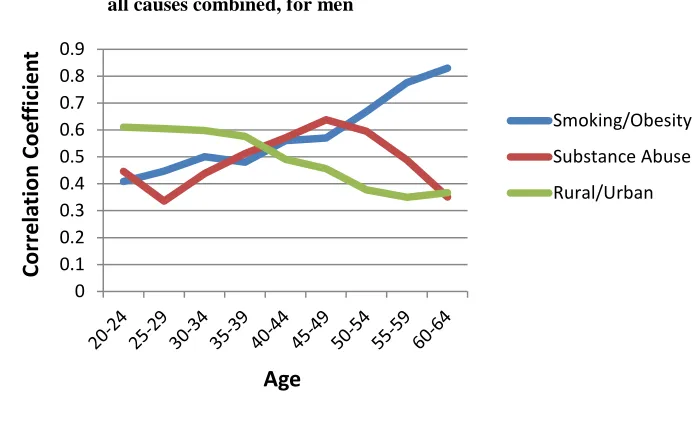
4.1 Relation of factors to all-cause mortality
Figure 4: Correlations between factor scores and age-specific death rates from all causes combined, for men
Figure 5: Correlations between factor scores and age-specific death rates from all causes combined, for women
0 0.1 0.2 0.3 0.4 0.5 0.6 0.7 0.8 0.9
Cor
re
la
tion
Co
effic
ie
nt
Age
Smoking/Obesity Substance Abuse Rural/Urban
0 0.1 0.2 0.3 0.4 0.5 0.6 0.7 0.8 0.9
Cor
re
la
tion
Co
effic
ie
nt
Age
So far we have used only age-standardized rates in the analysis. It would be reassuring if the factors identified had a plausible age pattern of correlation with all-cause mortality, one that reflected the age patterns of mortality by all-cause. Figure 4 for males and 5 for females show that this expectation is realized. The correlation between all-cause age-specific death rates and the smoking/obesity factor grows stronger with age, its correlation with the rural/urban factor grows weaker with age, and its correlation with the substance abuse factor is an inverted U-shape. These age patterns mimic the age patterns of mortality for the main causes of death associated with each of the factors (National Center for Health Statistics 2012a).
4.2 Validation
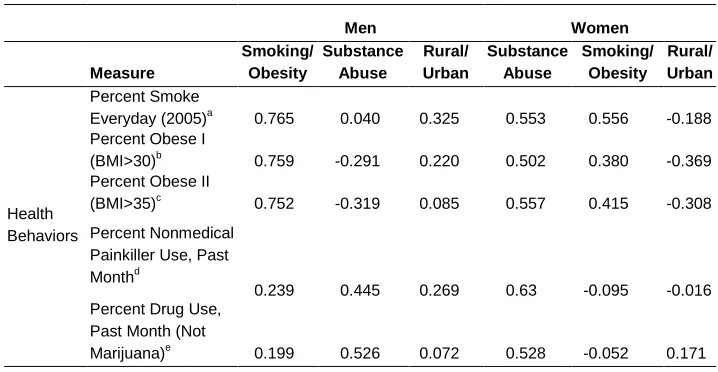
Table 4 presents correlations between factor scores and various measures related to the factors that we have identified. Most of these measures are drawn from the Behavioral Risk Factor Surveillance System (BRFSS), an annual survey conducted by the National Center for Health Statistics that provides data on risk factor distributions by state. Despite the flaws in BRFSS data as described in the introduction, it is the best source of information on how risky behaviors vary from state to state. For most measures we have been able to tabulate micro-level data in order to examine the distributions for the white population aged 20-64 by sex.
Table 4: Factor score correlations with variables of interest
Men Women
Measure
Smoking/ Obesity
Substance Abuse
Rural/ Urban
Substance Abuse
Smoking/ Obesity
Rural/ Urban
Health Behaviors
Percent Smoke
Everyday (2005)a 0.765 0.040 0.325 0.553 0.556 -0.188
Percent Obese I
(BMI>30)b 0.759 -0.291 0.220 0.502 0.380 -0.369
Percent Obese II
(BMI>35)c 0.752 -0.319 0.085 0.557 0.415 -0.308
Percent Nonmedical Painkiller Use, Past
Monthd
0.239 0.445 0.269 0.63 -0.095 -0.016
Percent Drug Use, Past Month (Not
Table 4: (Continued)
Men Women
Measure Smoking/ Obesity Substance Abuse Rural/ Urban Substance Abuse Smoking/ Obesity Rural/ Urban Health Behaviors Percent Binge
Drinker Last Monthf -0.333 -0.290 -0.355 -0.610 0.075 -0.007
Health Care Access
Percent Uninsuredg 0.148 0.430 0.495 0.765 -0.235 -0.117
Percent Cannot Afford Health Care
Last 6 Monthsh 0.378 0.349 0.547 0.841 -0.118 -0.079
Poverty Percent in Povertyi 0.419 0.470 0.419 0.254 0.280 0.024
Ecological Exposures
Yearly Miles Driven
Per Personj 0.077 -0.090 0.765 0.438 -0.181 -0.543
Percent Gun
Ownershipk 0.208 -0.347 0.873 0.345 -0.010 -0.787
Percent Lives
Outside MSAl 0.101 -0.464 0.630 0.084 0.082 -0.720
a-c, f-h,l
2005 Behavioral Risk Factor Surveillance System (BRFSS) for white men/women ages 20-65 (Centers for Disease Control and Prevention 2005). f
Binge drinking is defined as having 5 or more drinks on at least one occasion in the past 30 days. i
2011 American Community Survey for whites.
d,e
2006-2007 Substance Abuse and Mental Health Services Administration survey data (Hughes et al. 2009). These measures are for the entire United States population
j
Federal Highway Administration (2001) data for all Americans with drivers licenses. k2001 BRFSS measure for all Americans. (Centers for Disease Control and Prevention 2001)
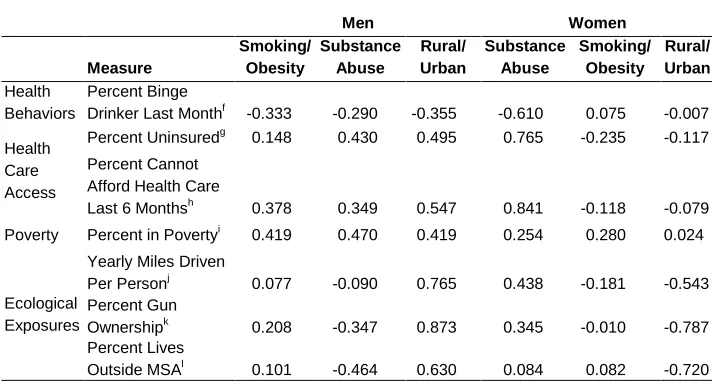
The correlations in Table 4 provide solid support for the interpretations that we have given to the factors. Male Factor 1 (Smoking/Obesity) scores are correlated across states at 0.75 or above with measures of the prevalence of smoking and of obesity. These are among the highest correlations in Table 4. The highest correlation involving Male Factor 2 (Substance Abuse) is with self-reported nonmedical prescription drug use (0.53). Male Factor 3 is most highly correlated with indicators of rural residence: miles driven (0.77), gun ownership (0.87), and living outside a Metropolitan Statistical Area (0.63). The correlation between gun ownership and the male injury factor is the highest of any of the 72 correlations in Table 4. Gun ownership is also highly correlated at -0.79 with female Factor 3.
loaded on Factor 1 for females. On the other hand, the ‘amenable causes’ that are thought to be most sensitive to the quality of medical services are not prominent in female Factor 1. Female Factor 2 (Smoking/Obesity) is most highly correlated with the prevalence of smoking (0.56), obesity I (0.38), and obesity II (0.42). The correlations of other measures with female Factor 2 are very low. Female Factor 3 correlations are consistent with a rural/urban interpretation, as all three indicators of rural residence are negatively correlated: miles driven (-0.54), gun ownership (-0.79), and living outside a Metropolitan Service Area (MSA) (-0.72).
5. Discussion
The application of factor analysis to state-specific mortality by cause of death has revealed a set of factors with a substantial degree of epidemiologic coherence. Smoking/obesity, substance abuse, and rural/urban residence emerge as the most prominent sources of mortality variation among men. Similar but weaker patterns are observed in females. Confidence in the identification of these factors is increased by high correlations between the factors and survey-based estimates of exposure to various risks.
Of note, we found that three factors were able to explain the majority of US mortality variation among working-age adults in both men and women. The finding of a large contribution of behavioral risk factors to mortality variation is consistent with previous studies (Danaei et al. 2010; Fenelon and Preston 2012). One prior study estimated that targeting just four of the leading modifiable risk factors could increase overall life expectancy in the US by more than four years and reduce differences in life expectancy across population sub-groups by as much as 20% (Danaei et al. 2010).
The two leading behavioral risk factors in the United States, smoking and obesity, did not emerge as separate factors in the analysis. The identification of smoking and obesity as separate factors may have been prevented by the fact that these two behaviors are highly correlated at the population level. The correlation of smoking and obesity prevalence across states as measured in the 2005 BRFSS (variables in Table 4) was .63 for men and .52 for women. The fact that both behaviors have significant pathways operating through ischaemic heart disease and cerebrovascular disease further impedes their distinction. With respect to male Factor 1, however, the preeminence of lung cancer and the list of highly loaded causes of death clearly suggest a stronger role for smoking than for obesity.
not easily amenable to measurement. However, our findings are consistent with recent literature, which shows rising death rates from prescription medication abuse, particularly among white women (Centers for Disease Control and Prevention 2013b).
Our analysis also revealed an important role for rural/urban status in US mortality patterns. This role was particularly prominent among males, for whom rurality was associated with higher injury death rates, including transport injuries and suicide. Our findings suggest that gun ownership and increased exposure to driving may be two factors underlying the rural penalty for males; however, future work should seek to identify a more complete set of risk factors associated with rurality.
The set of causes associated with a particular factor has greater coherence for men than for women, and the factors explain more variance for men. This gender difference is likely a result of the fact that risk factors like smoking and drug abuse, as well as the constellation of risk factors that give rise to injury, are more prominent among men. The clearer results for males may also be caused by the fact that there are many more male deaths for statistical analysis than female deaths (2,308,783 deaths for the male analysis compared to 1,215,719 deaths for the female analysis).
Causes of death that we expect to be most sensitive to the availability and quality of health services did not emerge in a latent variable for either sex. Uncertainty is added about the role of health services because the percent uninsured and the percent who cannot afford health care in a state are highly correlated with female Factor 1. It may be that health services manifest themselves in mortality over a wider variety of causes of death than implied by previous efforts to identify the set of sentinel or amenable causes of death.
Latent variable analysis of causes of death is complementary to the more standard attributable-risk approach in which a set of relative risks associated with a particular risk factor is applied to the risk factor distribution of the population. The latent variable approach does not require prevalence or relative risk estimates and is not sensitive to errors therein. Population exposure data and relative risks are typically available for only a small subset of risk factors and data errors may be especially prominent for data on sensitive health topics commonly elicited through self-report (e.g., body mass index, unsafe sex, and illicit drug-use). The present approach uses US vital statistics, a rich source of data with temporal depth and fine geographic detail.
identifying the contribution of modifiable risk factors to mortality patterns in other countries that have complete or near-complete vital registration and in which data to implement the standard attributable risk approach are lacking. More than 60 countries around the world met this criterion as of 2003 (Mathers et al. 2005).
6. Acknowledgements
References
Anderson, R.N. and Rosenberg, H.M. (1998). Age standardization of death rates: implementation of the year 2000 standard. National Vital Statistics Report 47(3): 1–16. http://www.cdc.gov/nchs/data/nvsr/nvsr47/nvs47_03.pdf.
Brown, T.A. (2006). Confirmatory factor analysis for applied research. Guilford Press. Centers for Disease Control and Prevention, (CDC) (2001). Behavioral Risk Factor
Surveillance System Survey Data. Atlanta, GA: Department of Health and Human Services, Centers for Disease Control and Prevention. http://www.cdc.gov/brfss/annual_data/annual_2001.htm.
Centers for Disease Control and Prevention, (CDC) (2005). Behavioral Risk Factor Surveillance System Survey Data. Atlanta, GA: Department of Health and Human Services, Centers for Disease Control and Prevention. http://www.cdc.gov/brfss/annual_data/annual_2005.htm.
Centers for Disease Control and Prevention, (CDC) (2013a). Behavioral Risk Factor Surveillance System: 2011 Summary Data Quality Report. Atlanta, GA: Department of Health and Human Services, Centers for Disease Control and Prevention.
Centers for Disease Control and Prevention, (CDC) (2013b). Prescription Painkiller Overdoses: a growing epidemic, especially among women. Atlanta, GA: Department of Health and Human Services, Centers for Disease Control and Prevention. http://www.cdc.gov/vitalsigns/PrescriptionPainkillerOverdoses/. Corrao, G., Bagnardi, V., Zambon, A., and La Vecchia, C. (2004). A meta-analysis of
alcohol consumption and the risk of 15 diseases. Preventive Medicine 38(5): 613–619. doi:10.1016/j.ypmed.2003.11.027.
Danaei, G., Ding, E.L., Mozaffarian, D., Taylor, B., Rehm, J., Murray, C.J.L., and Ezzati, M. (2009). The preventable causes of death in the United States: comparative risk assessment of dietary, lifestyle, and metabolic risk factors. PLoS Medicine6(4): e1000058. doi:10.1371/journal.pmed.1000058.
Danaei, G., Rimm, E.B., Oza, S., Kulkarni, S.C., Murray, C.J.L., and Ezzati, M. (2010). Correction: The promise of prevention: the effects of four preventable risk factors on national life expectancy and life expectancy disparities by race and county in the United States. PLoS Medicine 7(3): 1–12. doi:10.1371/journal.
Ezzati, M., Henley, S.J., Lopez, A.D., and Thun, M.J. (2005a). Role of smoking in global and regional cancer epidemiology: current patterns and data needs. International Journal of Cancer. Journal International du Cancer 116(6): 963–971. doi:10.1002/ijc.21100.
Ezzati, M., Henley, S.J., Thun, M.J., and Lopez, A.D. (2005b). Role of smoking in global and regional cardiovascular mortality. Circulation 112(4): 489–497.
doi:10.1161/CIRCULATIONAHA.104.521708.
Federal Highway, Adminstration (2001). Highway Statistics. U.S. Department of Transportation, Federal Highway Administration. http://www.fhwa.dot.gov/ ohim/ohimstat.htm.
Fenelon, A. and Preston, S.H. (2012). Estimating smoking-attributable mortality in the United States. Demography 49(3): 797–818. doi:10.1007/s13524-012-0108-x. Gavrilova, N.S., Semyonova, V.G., and Evdokushkina, G.N. (2002). Mortality Crisis in
Russia : New Health Threats. Center on Aging, University of Chicago. http://health-studies.org/PAA-2002-Russia.pdf.
Howden, L.M. and Meyer, J.A. (2010). Age and sex composition: 2010. 2010 Census Briefs, US Department of Commerce, Economics and Statistics Administration. US CENSUS BUREAU.
Hughes, A., Sathe, N., and Spagnola, K. (2009). State estimates of substance use from the 2006-2007 National Surveys on Drug Use and Health. Rockville, MD: Office of Applied Studies, Substance Abuse and Mental Health Services Administration,NSDUH Series H-35, HHS Publication No. SMA 09-4362. http://www.samhsa.gov/data/2k7state/2k7state.pdf.
Kaku, D.A. and Lowenstein, D.H. (1990). Emergence of recreational drug abuse as a major risk factor for stroke in young adults. Annals of Internal Medicine 113(11): 821–827. doi:10.7326/0003-4819-113-11-821.
Levi, J., Segal, L.M., and Kohn, D. (2012). The Facts Hurt: A State-By-State Injury Prevention Policy Report. Washington, D.C.: Trust for America’s Health. http://www.rwjf.org/content/dam/farm/reports/reports/2013/rwjf72972.
Mathers, C.D., Fat, D.M., Inoue, M., Rao, C., and Lopez, A.D. (2005). Counting the dead and what they died from: an assessment of the global status of cause of death data. Bulletin of the World Health Organization 83(3): 171–177. http://www.who.int/bulletin/volumes/83/3/171.pdf.
McCarthy, J.F., Blow, F.C., Ignacio, R.V., Ilgen, M.A., Austin, K.L., and Valenstein, M. (2012). Suicide among patients in the Veterans Affairs health system: rural-urban differences in rates, risks, and methods. American Journal of Public Health 102(S1): S111–S117. doi:10.2105/AJPH.2011.300463.
Mehta, N.K. and Chang, V.W. (2009). Mortality attributable to obesity among middle-aged adults in the United States. Demography 46(4): 851–872. doi:10.1353/ dem.0.0077.
Mehta, N. and Preston, S. (2012). Continued increases in the relative risk of death from smoking. American Journal of Public Health 102(11): 2181–2186. doi:10.2105/
AJPH.2011.300489.
Mokdad, A.H., Marks, J.S., Stroup, D.F., and Gerberding, J.L. (2004). Actual causes of death in the United States, 2000. JAMA: the Journal of the American Medical Association 291(10): 1238–1245. doi:10.1001/jama.291.10.1238.
Mokdad, A.H., Marks, J.S., Stroup, D.F., and Gerberding, J.L. (2005). Correction : Actual Causes of Death in the United States, 2000. JAMA: the Journal of the American Medical Association 293(3): 293–294. doi:10.1001/jama.293.3.293. Murray, C.J.L., Kulkarni, S.C., Michaud, C., Tomijima, N., Bulzacchelli, M.T.,
Iandiorio, T.J., and Ezzati, M. (2006). Eight Americas: Investigating Mortality Disparities across Races, Counties, and Race-Counties in the United States. PLoS Medicine 3(9): 1513–1524. doi:10.1353/tam.2006.0127.
Murray, C.J., Abraham, J., Ali, M.K., Alvarado, M., Atkinson, C., Baddour, L.M., and Gutierrez, H.R. (2013). The state of US health, 1990-2010: burden of diseases, injuries, and risk factors. JAMA 310(6): 591–606. doi:10.1001/jama.2013.13805. Myers, S.R., Branas, C.C., French, B.C., Nance, M.L., Kallan, M.J., Wiebe, D.J., and
Carr, B.G. (2013). Safety in Numbers: Are Major Cities the Safest Places in the United States? Annals of Emergency Medicine. doi:10.1016/j.annemergmed. 2013.05.030.
National Center, for Health Statistics (2010). Mortality data, multiple cause-of-death public-use data files. Hyattsville, MD: National Center for Health Statistics. http://www.cdc.gov/nchs/data_access/Vitalstatsonline.htm#Mortality_Multiple. National Center, for Health Statistics (2012a). Health, United States, 2012: With
Special Feature on Emergency Care. Hyattsville, MD. http://www.cdc.gov/nchs/ data/hus/hus12.pdf.
National Center, for Health Statistics (2012b). Bridged-race intercensal estimates of the resident population of the United States for July 1, 2000-July 1, 2009, by year, county, single-year of age (0, 1, 2, .., 85 years and over), bridged race, hispanic origin, and sex. http://www.cdc.gov/nchs/nvss/bridged_race.htm.
Nolte, E. and McKee, C.M. (2008). Measuring the health of nations: updating an earlier analysis. Health affairs 27(1): 58–71. doi:10.1377/hlthaff.27.1.58.
Nolte, E. and Mckee, M. (2004). Does health care save lives? Avoidable mortality revisited. The Nuttfield Trust.
Oza, S., Thun, M.J., Henley, S.J., Lopez, A.D., and Ezzati, M. (2011). How many deaths are attributable to smoking in the United States? Comparison of methods for estimating smoking-attributable mortality when smoking prevalence changes. Preventive Medicine 52: 428–433. doi:10.1016/j.ypmed.2011.04.007. Peto, R., Lopez, A.D., Boreham, J., Thun, M., and Heath, C. (1992). Mortality from
tobacco in developed countries: indirect estimation from national vital statistics. The Lancet 339(8804): 1268–1278. doi:10.1016/0140-6736(92)91600-D. Pirie, K., Peto, R., Reeves, G.K., Green, J., and Beral, V. (2012). The 21st century
hazards of smoking and benefits of stopping: a prospective study of one million women in the UK. Lancet 381(9861): 133–141. doi:10.1016/S0140-6736(12) 61720-6.
Polednak, A.P. (2000). Black-white differences in sentinel causes of death: counties in large metropolitan areas. Journal of Urban Health Bulletin of the New York Academy of Medicine 77(3): 501–507.
Preston, S.H., Glei, D.A., and Wilmoth, J.R. (2010). A new method for estimating smoking-attributable mortality in high-income countries. International Journal of Epidemiology 39(2): 430–438. doi:10.1093/ije/dyp360.
Preston, S., Heuveline, P., and Guillot, M. (2001). Demography: Measuring and Modeling Population Processes. London: Blackwell Publishing.
Rehm, J. (2011). The risks associated with alcohol use and alcoholism. Alcohol Research and Health 34(2): 135–143. http://www.researchgate.net/publication/ 221828484_The_risks_associated_with_alcohol_use_and_alcoholism.
Renehan, A.G., Tyson, M., Egger, M., Heller, R.F., and Zwahlen, M. (2008). Body-mass index and incidence of cancer: a systematic review and meta-analysis of prospective observational studies. Lancet 371: 569–578.
doi:10.1016/S0140-6736(08)60269-X.
Singh, G.K. and Siahpush, M. (2002). Increasing Rural – Urban Gradients in US Suicide. American Journal of Public Health 92(7): 1161–1167. doi:10.2105/ AJPH.92.7.1161.
Single, E., Robson, L., Rehm, J., Xie, X., and Xi, X. (1999). Morbidity and mortality attributable to alcohol, tobacco, and illicit drug use in Canada. American Journal of Public Health 89(3): 385–390. doi:10.2105/AJPH.89.3.385.
Taylor, B., Irving, H. M., Kanteres, F., Room, R., Borges, G., and Cherpitel, C. et al. (2010). The more you drink, the harder you fall: a systematic review and meta-analysis of how acute alcohol consumption and injury or collision risk increase together. Drug and Alcohol Dependence 110(1): 108–116. doi:10.1016/j.drug alcdep.2010.02.011.
United States, Fire Administration (2013). www.usfa.fema.gov/campaigns/smoking. United, Nations (1982). Model Life Tables for Developing Countries. New York:
United Nations Publication, Sales No. E.81.XIII.7.
United States, Census Bureau. (2013). 2011 American Community Survey. Tabulations supplied by Alemayehu Bishaw of the U.S. Census Bureau.
Whitlock, G., Lewington, S., Sherliker, P., Clarke, R., Emberson, J., and Halsey et al. (2009). Body-mass index and cause-specific mortality in 900 000 adults: collaborative analyses of 57 prospective studies. Lancet 373(9669): 1083–1096.
doi:10.1016/S0140-6736(09)60318-4.
Appendix
Causes of death list
The Global Burden of Disease (GBD) cause-of-death groupings were chosen because they could be traced to ICD-9 and ICD-10, they identified ‘garbage’ codes, and they focused on public health. However, the GBD groupings are primarily for international comparisons, so several changes were made to make a list more appropriate for identifying latent variables in the United States. These changes are outlined below.
Important causes of death that meet the criterion for inclusion, but were grouped in “other” categories, were separately enumerated. These “other” categories included other cancers and other circulatory diseases.
Causes of death that are part of a broader category but are clear markers of behavioral risk factors were added to the list used in this analysis:
• COPD was taken out of respiratory diseases.
• Alcoholic liver cirrhosis was separated from non-alcoholic liver cirrhosis.
• Alcohol poisoning was separated from several categories then combined.
• Deaths from war and capital punishment were removed.
Table S1: Eigenvalues and the percent of cause of death variance explained by each factor
Male Female
Eigenvector Eigenvalue Percent of Variance Explained
Cumulative
Percent Eigenvector Eigenvalue
Percent of Variance Explained
Cumulative Percent
1 13.276 0.34 0.34 1 11.474 0.328 0.328
2 5.28 0.135 0.476 2 5.151 0.147 0.475
3 5.227 0.134 0.61 3 2.967 0.085 0.56
4 1.73 0.044 0.654 4 2.296 0.066 0.625
5 1.678 0.043 0.697 5 1.881 0.054 0.679
6 1.492 0.038 0.735 6 1.272 0.036 0.715
7 1.305 0.033 0.769 7 1.11 0.032 0.747
8 1.004 0.026 0.795 8 0.901 0.026 0.773
9 0.886 0.023 0.817 9 0.85 0.024 0.797
10 0.714 0.018 0.836 10 0.681 0.019 0.817
Notes: Death registration data is taken from the NCHS and includes white men/women ages 20-64 and years 2000-2009. Factor
analysis is run on a state by age-standardized cause of death matrix. This procedure produces 49 eigenvectors (factors) that are ordered by the amount of variance they explain. The first three factors were included in our analysis.
Table S2: Male factor loadings
Factor 1 Factor 2 Factor 3
Cause of Death Loading Cause of Death Loading Cause of Death Loading Lung, Trachea, and
Bronchus Cancer 0.947 Liver Cancer 0.844 Self-Inflicted Injuries 0.849
Colorectal Cancer 0.884 Interpersonal Violence 0.834 Transport Injures 0.794
Ischemic Heart Disease 0.880 Hepatitis 0.804 Exposure to Mechanical Forces 0.770
Oral Cancer 0.837 Non-Alcoholic Liver Cirrhosis 0.771 Other Accidents 0.753
Larynx Cancer 0.820 HIV/AIDS 0.758 Accidental Drowning 0.611
Cerebrovascular Disease 0.757 Accidental Poisoning 0.706 Falls 0.586
COPD 0.749 Other Digestive Diseases 0.670 COPD 0.494
Exposure to Smoke or Heat 0.744 Hypertensive Heart Disease 0.643 Multiple Myeloma 0.401
Pancreatic Cancer 0.729 Alcoholic Liver Cirrhosis 0.640 Prostate Cancer 0.401
Non-Hodgkins Lymphoma 0.717 Cardiomyopathy 0.520 Exposure to Smoke or Heat 0.384
Leukemia 0.706 Stomach Cancer 0.501 Alcohol Poisoning 0.363
Respiratory Disease 0.690 Alcohol Poisoning 0.431 Respiratory Disease 0.343
Diabetes Mellitus 0.635 Oral Cancer 0.332 Diabetes Mellitus 0.326
Esophagus Cancer 0.594 Cerebrovascular Disease 0.328 Skin Cancer 0.319
Aneurysm 0.567 Diabetes Mellitus 0.281 Cerebrovascular Disease 0.311
Non-Alcoholic Liver Cirrhosis 0.477 Aneurysm 0.254 Interpersonal Violence 0.308
Skin Cancer 0.474 Larynx Cancer 0.247 Aneurysm 0.293
Bladder Cancer 0.457 Self-Inflicted Injuries 0.233 Other Digestive Diseases 0.289
Table S2: (Continued)
Factor 1 Factor 2 Factor 3
Cause of Death Loading Cause of Death Loading Cause of Death Loading Exposure to Mechanical
Forces 0.437 Transport Injures 0.222 Ischemic Heart Disease 0.240
Transport Injures 0.409 Colorectal Cancer 0.214 Brain Cancer 0.134
Other Accidents 0.386 Falls 0.210 Colorectal Cancer 0.111
Stomach Cancer 0.320 Ischemic Heart Disease 0.189 Lung, Trachea, and Bronchus
Cancer 0.106
Brain Cancer 0.298 Skin Cancer 0.171 Hepatitis 0.100
Multiple Myeloma 0.281 Non-Hodgkins Lymphoma 0.164 Accidental Poisoning 0.096
Liver Cancer 0.230 COPD 0.158 Non-Alcoholic Liver Cirrhosis 0.094
Accidental Poisoning 0.226 Bladder Cancer 0.116 Oral Cancer 0.006
Interpersonal Violence 0.201 Accidental Drowning 0.092 Liver Cancer -0.018
Cardiomyopathy 0.193 Prostate Cancer 0.073 Non-Hodgkins Lymphoma -0.081
Hypertensive Heart Disease 0.165 Pancreatic Cancer 0.061 Hypertensive Heart Disease -0.095
HIV/AIDS 0.134 Leukemia 0.052 Leukemia -0.119
Prostate Cancer 0.130 Exposure to Smoke or Heat 0.027 Larynx Cancer -0.195
Hepatitis 0.080 Lung, Trachea, and
Bronchus Cancer 0.001 Esophagus Cancer -0.229
Accidental Drowning 0.021 Other Accidents -0.058 Pancreatic Cancer -0.233
Self-Inflicted Injuries -0.039 Multiple Myeloma -0.087 Tissue Cancer -0.242
Falls -0.260 Tissue Cancer -0.168 HIV/AIDS -0.372
Alcoholic Liver Cirrhosis -0.293 Exposure to Mechanical
Forces -0.188 Cardiomyopathy -0.411
Tissue Cancer -0.297 Esophagus Cancer -0.278 Bladder Cancer -0.479
Alcohol Poisoning -0.508 Brain Cancer -0.386 Stomach Cancer -0.480
Notes: Death registration data is taken from the NCHS and includes white men ages 20-64 and years 2000-2009. Factor analysis is run on a state by age-standardized cause of death matrix that generates three factors. Factor loadings represent the correlations between causes of death and these factors.
Table S3: Female factor loadings
Factor 1 Factor 2 Factor 3
Cause of Death Loading Cause of Death Loading Cause of Death Loading
Interpersonal Violence 0.879 Colorectal Cancer 0.743 HIV/AIDS 0.728
Cerebrovascular Disease 0.876 Breast Cancer 0.740 Stomach Cancer 0.580
Other Digestive Diseases 0.869 Lung, Trachea, and
Bronchus Cancer 0.725
Hypertensive Heart
Disease 0.466
Non-Alcoholic Liver
Cirrhosis 0.837 Non-Hodgkins Lymphoma 0.651
Non-Alcoholic Liver
Cirrhosis 0.372
Accidental Poisoning 0.778 Ischaemic Heart Disease 0.618 Breast Cancer 0.339
Chronic Obstructive
Pulmonary Disease 0.769 Leukemia 0.548 Leukemia 0.287
Transport Injures 0.761 Oral Cancer 0.495 Hepatitis 0.279
Table S3: (Continued)
Factor 1 Factor 2 Factor 3
Cause of Death Loading Cause of Death Loading Cause of Death Loading
Cervical Uteri Cancer 0.749 Chronic Obstructive
Pulmonary Disease 0.396 Cardiomyopathy 0.206
Ischaemic Heart Disease 0.726 Cervical Uteri Cancer 0.363 Cervical Uteri Cancer 0.167
Self-inflicted Injuries 0.718 Pancreatic Cancer 0.362 Interpersonal Violence 0.144
Diabetes Mellitus 0.690 Corpus Uteri Cancer 0.311 Tissue Cancer 0.107
Hepatitis 0.663 Cerebrovascular Disease 0.298 Alcohol Poisoning 0.071
Liver Cancer 0.654 Diabetes Mellitus 0.281 Accidental Poisoning 0.065
Other Accidents 0.613 HIV/AIDS 0.255 Other Digestive Diseases 0.036
Cardiomyopathy 0.573 Other Accidents 0.254 Multiple Myeloma 0.005
Colorectal Cancer 0.548 Esophagus Cancer 0.227 Respiratory Diseases -0.023
Hypertensive Heart
Disease 0.538 Skin Cancer 0.221 Ischaemic Heart Disease -0.044
Leukemia 0.381 Other Digestive Diseases 0.172 Non-Hodgkins Lymphoma -0.048
Lung, Trachea, and
Bronchus Cancer 0.357 Multiple Myeloma 0.169 Colorectal Cancer -0.049
Skin Cancer 0.297 Respiratory Diseases 0.162 Esophagus Cancer -0.074
Breast Cancer 0.280 Brain Cancer 0.157 Lung, Trachea, and
Bronchus Cancer -0.078
Non-Hodgkins Lymphoma 0.248 Stomach Cancer 0.148 Pancreatic Cancer -0.089
Alcoholic Liver Cirrhosis 0.197 Liver Cancer 0.091 Oral Cancer -0.111
Brain Cancer 0.139 Cardiomyopathy 0.060 Alcoholic Liver Cirrhosis -0.112
Alcohol Poisoning 0.114 Transport Injures 0.049 Diabetes Mellitus -0.166
Stomach Cancer 0.099 Hypertensive Heart
Disease -0.009 Cerebrovascular Disease -0.171
Oral Cancer -0.040 Interpersonal Violence -0.014 Corpus Uteri Cancer -0.259
Pancreatic Cancer -0.055 Non-Alcoholic Liver
Cirrhosis -0.032 Self-inflicted Injuries -0.276
HIV/AIDS -0.060 Accidental Poisoning -0.164 Other Accidents -0.309
Falls -0.155 Falls -0.211 Skin Cancer -0.313
Multiple Myeloma -0.183 Hepatitis -0.311 Chronic Obstructive
Pulmonary Disease -0.370
Tissue Cancer -0.193 Self-inflicted Injuries -0.523 Transport Injures -0.411
Esophagus Cancer -0.319 Alcoholic Liver Cirrhosis -0.725 Falls -0.416
Corpus Uteri Cancer -0.632 Alcohol Poisoning -0.815 Brain Cancer -0.629
Table S4: Factor scores
Men Women
State Factor 1 Factor 2 Factor 3 Factor 1 Factor 2 Factor 3
AL 1.423 -0.105 0.824 1.303 0.466 -0.435
AK -1.913 -0.067 1.825 0.207 -2.830 0.522
AR 1.599 0.197 1.230 1.540 1.265 -0.348
AZ -0.777 1.834 0.084 0.611 -1.335 0.666
CA -0.924 1.890 -0.778 0.264 -0.490 2.089
CO -1.841 0.633 0.644 0.072 -1.905 -0.415
CT -0.942 0.077 -1.627 -1.067 -0.162 1.363
DE 0.418 0.596 -1.300 0.392 0.085 0.637
FL 0.444 1.815 -0.506 0.490 -0.562 1.101
GA 0.085 0.342 0.144 0.527 -0.191 0.234
IA -0.025 -1.462 0.056 -0.897 0.834 -1.041
ID -0.655 -1.071 0.936 -0.298 -0.988 -1.581
IL -0.045 -0.162 -1.094 -0.725 0.675 0.956
IN 1.040 -0.745 -0.121 0.303 1.105 -0.342
KS 0.195 -0.851 0.234 -0.028 -0.111 -0.629
KY 1.879 -0.246 0.831 1.024 1.637 -0.457
LA 1.133 0.739 0.473 1.333 0.506 0.653
MA -0.271 0.012 -1.799 -1.324 0.390 0.973
MD -0.317 -0.342 -0.914 -0.776 0.265 0.949
ME 0.457 -0.911 -0.634 -0.907 0.373 -0.731
MI 0.455 -0.334 -0.950 -0.154 0.295 0.103
MN -0.886 -1.290 -0.292 -1.623 -0.186 -0.602
MO 0.637 -0.218 0.126 0.393 0.784 -0.524
MS 1.682 0.231 1.493 1.720 0.696 -0.360
MT -1.289 -0.607 1.635 -0.380 -1.199 -1.878
NC 0.258 -0.004 0.354 0.224 0.101 -0.507
ND -0.488 -1.574 0.188 -1.559 -0.195 -0.409
NE -0.562 -1.287 0.137 -0.960 -0.127 -0.900
NH -0.227 -0.824 -0.811 -1.099 -0.250 0.156
NJ -0.228 0.323 -1.947 -1.262 0.810 1.860
NM -1.303 3.143 1.421 1.485 -2.178 1.181
NV -0.426 2.109 0.052 1.497 -1.217 0.967
NY 0.120 0.417 -1.951 -1.085 1.091 2.576
OH 0.955 -0.389 -0.988 -0.113 1.073 -0.182
OK 1.606 0.518 0.818 2.041 1.119 -0.714
OR -0.483 0.190 0.475 0.128 -0.758 -0.833
PA 0.467 -0.286 -0.858 -0.619 0.992 0.035
RI -0.010 -0.093 -1.455 -0.760 0.511 0.491
SC 0.717 0.621 0.445 0.792 -0.009 -0.198
SD -0.588 -1.599 0.858 -1.464 0.613 -1.468
TN 1.684 0.485 0.550 1.553 0.716 -0.452
TX -0.018 1.548 -0.307 0.788 -0.097 1.817
Table S4: (Continued)
Men Women
State Factor 1 Factor 2 Factor 3 Factor 1 Factor 2 Factor 3
VA -0.288 -0.600 -0.464 -0.670 0.309 0.358
VT -0.694 -0.692 -0.407 -1.195 0.128 -0.797
WA -0.679 0.251 -0.206 -0.225 -0.595 -0.734
WI -0.501 -1.040 -0.135 -1.112 -0.321 -0.694
WV 2.163 -0.173 1.069 1.206 1.913 -0.628
WY -1.468 -0.416 2.207 0.640 -1.415 -1.492
Notes: Death registration data is taken from the NCHS and includes white men/women ages 20-64 and years 2000-2009. Factor
analysis is run on a state by age-standardized cause of death matrix. After the analysis, the factor scores above are estimated using the regression approach.
Figure S1: Male scree plot
Notes: Death registration data is taken from the NCHS and includes white men/women ages 20-64 and years 2000-2009. Factor
analysis is run on a state by age-standardized cause of death matrix. This procedure produces 49 eigenvectors (factors) that are ordered by the amount of variance they explain. The first three factors were included in our analysis.
0 2 4 6 8 10 12 14
1 2 3 4 5 6 7 8 9 10
E
ig
en
val
u
e
Figure S2: Female scree plot
Notes: Death registration data is taken from the NCHS and includes white men/women ages 20-64 and years 2000-2009. Factor
analysis is run on a state by age-standardized cause of death matrix. This procedure produces 49 eigenvectors (factors) that are ordered by the amount of variance they explain. The first three factors were included in our analysis.
Table S5: Correlations between factor loadings when retaining 3 factors and factor loadings when retaining 1-5 factors
Male Factors from Analysis Female Factors from Analysis
Number of Factors Retained Factor Factor 1 Factor 2 Factor 3 Factor 1 Factor 2 Factor 3
1 Factor Retained 1 0.863 0.153 0.116 0.948 0.250 0.077
2 Factors Retained 1 0.845 0.307 -0.226 1.000 -0.083 0.064
2 0.070 -0.429 0.958 -0.057 1.000 0.044
3 Factors Retained
1 1.000 -0.249 -0.135 1.000 -0.071 0.047
2 -0.249 1.000 -0.190 -0.071 1.000 0.025
3 -0.135 -0.190 1.000 0.047 0.025 1.000
4 Factors Retained
1 1.000 -0.259 -0.137 0.961 0.177 -0.076
2 -0.206 0.995 -0.189 -0.262 0.957 0.115
3 -0.075 -0.181 0.987 0.267 -0.058 0.964
4 -0.393 -0.043 0.332 -0.388 0.325 -0.147
5 Factors Retained
1 0.911 -0.274 0.264 0.960 0.180 -0.073
2 -0.161 0.987 -0.320 -0.250 0.959 0.106
3 -0.501 0.011 0.851 0.316 -0.053 0.839
4 0.421 -0.128 -0.734 -0.414 0.345 -0.092
5 -0.135 -0.062 0.339 0.051 -0.031 0.666
Notes: Factors at the top of the table are from our original analysis. Their factor loadings are correlated with factor loadings from factors that were generated by running the same analysis, but specifying a different number of factors to retain. When specifying 1 to 5 factors, the same factors as the original analysis are identified in the same order with one exception: when 2 factors are retained for men, the "injury" factor becomes the second factor.
0 2 4 6 8 10 12 14
1 2 3 4 5 6 7 8 9 10
E
ig
en
val
u
e
Table S6: Correlation between factor loadings when using varimax rotation and factor loadings when using promax rotation
Varimax Rotation
Factor 1 Factor 2 Factor 3
Male Female Male Female Male Female
Promax(1) 1.000 1.000 1.000 1.000 1.000 1.000
Promax(2) 0.998 0.999 0.996 0.999 0.999 0.998
Promax(3) 0.996 0.998 0.994 0.998 0.998 0.995
Promax(4) 0.995 0.997 0.993 0.997 0.999 -0.993
Promax(5) 0.994 0.996 0.993 0.997 0.999 -0.991
Notes: Factor loadings produced using varimax rotation (the specification chosen in the analysis) are correlated with factor loadings produced using promax rotation. Promax rotation allows factors to be correlated, and the higher the number in parenthesis next to promax, the more correlation is allowed. Correlations between factor loadings go down slightly as more correlation is allowed between factors, but correlations are still very high for any specification.
Table S7: Correlations between factor scores when using regression estimation and factor scores when using Bartlett's estimation
Factor Male Female
1 1.000 0.997
2 1.000 0.993
3 1.000 0.984
Notes: Stata provides two of the most common methods for estimating factor scores: Bartlett and Regression. The correlations above demonstrate that this specification does not affect factor scores.
Table S8: Correlations between factor loadings when using the 2000 age distribution and using the 2010 age distribution for death rate calculations
Factor Male Female
1 0.998 0.940
2 0.998 0.954
3 0.999 0.843
Table S9: Factor loadings ages 20-64 with men and women combined
Factor 1 Factor 2 Factor 3
Cause of Death
Factor
Loading Cause of Death
Factor
Loading Cause of Death
Factor Loading
Ischaemic Heart Disease 0.92429 Liver Cancer 0.83098 Self-Inflicted Injuries 0.85972
Colorectal Cancer 0.90851 Interpersonal Violence 0.82123 Exposure to Forces of Nature 0.79888
Lung, Trachea, and Bronchus
Cancer 0.90739 Hepatitis 0.80609 Transport Injures 0.66112
Chronic Obstructive Pulmonar
Disease 0.863 Cirrhosis of the Liver 0.79085 Accidental Drowning 0.65741
Cerebrovascular Disease 0.82453 HIV/AIDS 0.70626 Other Accidents 0.5777
Oral Cancer 0.78727 Hypertensive Heart Disease 0.66948
Exposure to Mechanical
Forces 0.57411
Exposure to Smoke or Heat 0.78267 Accidental Poisoning 0.65418 Falls 0.54859
Non-Hodgkins Lymphoma 0.76017 Other Digestive Diseases 0.62599 Rheumatic Heart Disease 0.51581
Larynx Cancer 0.73807 Stomach Cancer 0.54015 Alcohol Poisoning 0.51086
Leukemia 0.73792 Alcoholic Liver Cirrhosis 0.53619 Prostate Cancer 0.4641
Cervical Uteri Cancer 0.73519 Cardiomyopathy 0.52878 Alcoholic Liver Cirrhosis 0.43043
Respiratory Diseases 0.73201 Cervical Uteri Cancer 0.45251
Chronic Obstructive Pulmonar
Disease 0.31467
Diabetes Mellitus 0.7167 Alcohol Poisoning 0.3896 Aneurysm 0.2755
Exposure to Mechanical Forces 0.6711 Cerebrovascular Disease 0.34509 Interpersonal Violence 0.25958
Aneurysm 0.63677 Gall Bladder Cancer 0.32448 Brain Cancer 0.23567
Other Accidents 0.62317 Respiratory Diseases 0.30939 Cerebrovascular Disease 0.21847
Transport Injures 0.60087 Self-Inflicted Injuries 0.26613 Skin Cancer 0.21298
Other Digestive Diseases 0.5758 Diabetes Mellitus 0.24125 Other Digestive Diseases 0.19822
Breast Cancer 0.57139 Oral Cancer 0.23973 Respiratory Diseases 0.19687
Pancreatic Cancer 0.54636 Breast Cancer 0.21978 Diabetes Mellitus 0.19037
Skin Cancer 0.52218 Aneurysm 0.21589 Multiple Myeloma 0.18424
Cirrhosis of the Liver 0.47342 Transport Injures 0.1953 Exposure to Smoke or Heat 0.16369
Esophagus cancer 0.43919 Ischaemic Heart Disease 0.1817 Accidental Poisoning 0.15455
Hodgkins Lymphoma 0.4163 Rheumatic Heart Disease 0.1767 Hepatitis 0.14909
Interpersonal Violence 0.32528 Colorectal Cancer 0.16912 Ischaemic Heart Disease 0.0388
Brain Cancer 0.31295 Larynx Cancer 0.16561 Cirrhosis of the Liver 0.01738
Accidental Poisoning 0.30789 Accidental Drowning 0.14715 Cervical Uteri Cancer 0.00179
Multiple Myeloma 0.27415 Leukemia 0.13912 Liver Cancer -0.01048
Liver Cancer 0.27137
Chronic Obstructive Pulmonar
Disease 0.11889 Hypertensive Heart Disease -0.07343
Bladder Cancer 0.27047 Non-Hodgkins Lymphoma 0.09627 Colorectal Cancer -0.1362
Rheumatic Heart Disease 0.22099 Exposure to Smoke or Heat 0.08004
Lung, Trachea, and Bronchus
Cancer -0.17795
Prostate Cancer 0.19043 Skin Cancer 0.0745 Oral Cancer -0.21178
Cardiomyopathy 0.17204 Falls 0.06534 Non-Hodgkins Lymphoma -0.23852
Self-Inflicted Injuries 0.16261 Bladder Cancer 0.06057 Esophagus cancer -0.28141