Vol. 47 - No. 1 - Spring 2015, pp. 1- 8
٭Corresponding Author, Email: [email protected]
SFLA Based Gene Selection Approach for Improving
Cancer Classification Accuracy
Jamshid Pirgazi
1and Ali Reza Khanteymoori
1*1 -University of Zanjan Department of Computer Engineering Zanjan, Iran
ABSTRACT
In this paper, we propose a new gene selection algorithm based on Shuffled Frog Leaping Algorithm that
is called SFLA-FS. The proposed algorithm is used for improving cancer classification accuracy. Most of
the biological datasets such as cancer datasets have a large number of genes and few samples. However,
most of these genes are not usable in some tasks for example in cancer classification. Therefore, selection of
the appropriate genes is important in bioinformatics and machine learning. The proposed method combines
the advantage of wrapper and filter methods for gene subset selection. SFLA-FS consists of two phases. In
the first phase a filter method is used for gene ranking from high dimensional microarray data and in the
second phase, SFLA is applied to gene selection. The performance of SFLA-FS evaluated for cancer
classification using seven standard microarray cancer datasets. Experimental results are compared with
those of obtained from several existing well-known gene selection algorithm. The experimental results show
that SFLA-FS has a remarkable ability to generate reduced size of genes while yielding significant
classification accuracy in cancer classification.
KEYWORDS
1. INTRODUCTION
Classification of cancer samples based on microarray expression data has considerably advanced in recent years and many methods have been developed to increase classification accuracy. An obvious challenge for effective classification is that in these datasets, there are a large number of genes and a small number of samples. There are two ways to tackle this challenge. Some of the researches try to create better classifiers with a given set of feature such as SVM [1], Fuzzy SVM [2]. The others seek ways to reduce the dimensionality by selecting informative features. We focus here on the feature selection approaches [4, 5]. In fact in the data with many features, features are irrelevant or redundant or relevant. For feature selection, relevant features should be selected and redundant and irrelevant features should be eliminated. In the context of classification, feature selection techniques can be organized into five categories: Filter methods, Wrapper methods, embedded methods, Hybrid methods and Ensemble methods [4]. Filter methods assess the relevant of features by looking only at the natural properties of the data. Usually in this method a score is assigned to each feature and low ranked features are removed which is called univariate filter methods [6]. Some scoring measures used in these algorithms such as Euclidean distance, t-test and Information gain. Filter methods are computationally simple, fast and they are independent of the classifier. A common disadvantage of filter methods is that they ignore the interaction with the classifier thereby ignoring feature dependencies.
The other kind of filter methods is multivariate filter method which considers the interconnection between features and is slower than univariate methods such as Correlation-based feature selection (CFS), Markov blanket filter (MBF), Fast correlation-based feature selection (FCBF) [7,8].
Wrapper methods search the optimal subset of features to maximize the classification accuracy. Optimal subset features with high accuracy are selected as the output of wrapper methods. This method considers interconnection of features and have high chance for finding the best subset of features such as Sequential
Forward Selection (SFS), Sequential Backward
Elimination (SBE) [9, 10, 11, and 12]. These methods are used for gene selection and genetic data classification [13]. Major disadvantage of this method is that, the search of optimal features subsets for different classifiers needs to be conducted separately. Because various classifiers
have been used like SVM, ANN, Decision Tree, K
nearest neighbor (KNN) and Diagonal Linear
Discriminant Analysis (DLDA) and there are different ways of evaluating the performance of a classifier like Cross-Validation, bootstrap, leaves one out and sampling.
In embedded methods, the search for the optimal subset of features is built into the classifier construction, and can be seen as a search in the combined space of features subsets and models such as feature selection using the weight vector of SVM, Decision trees and weighted naive Bayes [14, 15]. Advantage of this method is that they include the interaction with classifier with far less computationally intensive than wrapper methods.
Hybrid methods combine both filter and wrapper method [16, 17, 18]. Ensemble methods are a class of popular methods in recent years that combine both classifier building and feature selection [19, 20, and 21]. This method uses multiple classifiers to produce a learner system. Random subspace method is one of popular ensemble methods that represents a class of learning ensemble of week classifier to achieve good accuracy. The ensemble output is based on majority voting. Subspace clustering methods find optimal subset of features that maximizes the classification accuracy. However, those methods work with big data while cancer datasets have a large number of genes and few samples.
This paper presents as Shuffled Frog Leaping Algorithm (SFLA) for feature selection problems using standard microarray cancer data sets. This represents a novel approach, which will reduce the set of available features. Each frog is representing a subset of genes. Population of frogs is partitioned into subsets called meme lexes. During the process of evolution, in each memeplexe worst frogs leap to the best frogs in the memeplexs. For leap worst frog to the best frog, low ranked genes will be removes and high ranked genes will be adds into the worst frog. The local updating of frog not only makes the irrelevant features less desirable, but also helps Frogs select relevant features. In addition, because of the Shuffled of frogs at each stage, frogs select that subset of features, which has never previously been explored.
The paper is organized as follows in this paper is as follows: Section 2 describes the proposed SFLA-based feature selection method. In Section 3, presents the practical results. Finally, a conclusion is given in Section4.
2. THE PROPOSED SFLA-FS
The SFLA is a mimetic meta-heuristic method that is derived from a virtual population of frogs in which each frog represents a set of feasible solutions. Each frog is into a subset of the population viewed as meme lexes. A local search is performed in each memeplex. To ensure global exploration, a shuffled information exchange will occur between meme lexes after a defined number of evolution steps [22].
In this paper, we have sfla_p frog. Each frog is representing a subset of genes. Each frog has its own maximum length. Population of frogs is partitioned into subsets called meme lexes. sfla_m is the number of memeplex. Therefore, there are sfla_nfrogs in each memeplex. The different meme lexes are considered as different cultures of frogs, each performing a local search. Within each memeplex, there is a submemeplex. In each submemeplex there are sfla_q frogs randomly selected according to the following probability function.
2( _ 1 )
, 1, 2,..., sfla_n
_ ( _ 1)
j
sfla n j
P j
sfla n sfla n
(1)
Submemeplex causes the algorithm does get seldom stuck in a local optimum [23].
where Pj is the probability of selecting j-th frog. After a number of mimetic evolution steps, genes are passed among frogs of meme lexes in a shuffling process. The local search and the shuffling processes continue until some convergence criteria are satisfied. In each iteration, within each submemeplex of memeplexs, the frog with the best fitness and the frog with the worst fitness are identified as Pb and Pw, respectively. The frog with the global best fitness is identified as Pg. In each iteration only the worst fitness frog will be modified. Therefore, the position of the frog with the worst fitness is adjusted as:
max
max
min{int( .[P P ]),S
max{int( .[P P ]),
G w
B
G w
rand for positiveleap S
rand S for negativeleap
(2)
'
w w B
P P S
(3)
where Smax The maximum length allowed for leap. Note for positive leaping in size SB genes which have a highest rank in the t-test filter method will be added to the worst frog. Also for negative leaping in size SB genes which have a low rank in the t-test filter method will be
eliminated from the worst frog. If the new frog ( '
w P ) is
better than the worst frog (Pw) it will be replaced by the worst frog. Otherwise, the position of the worst frog is modified according to the position of the frog with the global best fitness as:
max
max
min{int( .[P P ]),S max{int( .[P P ]),
G w
G
G w
rand for positiveleap S
rand S for negativeleap
(4)
''
w w G
P PS
(5)
Nota for positive leaping in size SG genes which have a highest rank in the t-test filter method will be added to the worst frog. Also for the negative leaping in size SG genes which they have low rank in t-test filter method will be eliminate from worst frog. The same state before the
new frog (P''w) was better than the worst frog (Pw), it
will replace the worst frog. If no improvement becomes possible in this case a random frog is generated which re-places the worst frog in submemeplex. These steps are repeated several times (ITmem), in the other word again all frog shuffling together and again be divided into sfla_m memeplex. This operation will continue until the termination conditions are satisfied.
Pseudo-code of SFLA is give in Table (1). Based on this algorithm, the worst frog can leap to a better frog. By repeating this operation, mean fitness of population increases in the mimetic evolution steps. The best solution found during the search process can be considered as the output of the algorithm. In fact, during the process of evolution, worst frogs jump to the best frogs in the memeplexs or best frog in the population. Frog will be updated using first stage information and low ranked genes will be removed and high ranked genes will be added into the worst frog. Because of the movement of information between frogs, the probability of finding the best subset of gene increases.
3. EXPERIMENTAL RESULTS
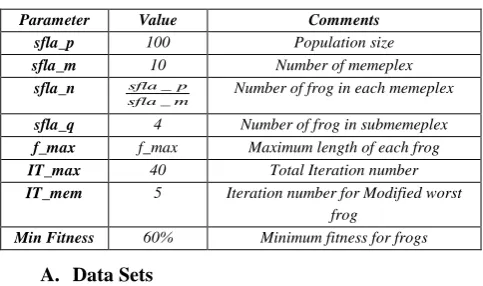
We evaluate the performance of SFLA-FS on seven microarray datasets, which have dimensions (number of gene) varying from 2000 to 12600. The parameters of SFLA are give in Table (2).
follows: number of iterations = 200, population size = 40, crossover rate = 0.7, mutation rate = 0.02. The parameter settings in PSO are as follows: number of iterations 200, number of particles = 40, w= 0.9, c1 = 2, c2 = 2 and in ACO methods, β= 5, ρ=0.1, m = 40.
TABLE 1.PSEUDO-CODE OF SFLA 1.rank gene base t-test filter method
2. Create an initial population of SFLA_P frogs generated randomly. 3. Divide the frogs into afla_m memplexes each holding sfla_n frogs. 3.2. i= 0
3.3. while I <ITmem
3.3.1. create a submemeplex for each memeplex
3.3.2. the position of the worst frog Pw’ for the memplex is adjusted such as (3)
3.3.3. if (fitness(Pw’) < fitness(Pw))
the position of the worst frog Pw’ for the memplex is adjusted such as (5)
3.3.4. if (fitness(Pw’’) < fitness(Pw))
a random frog is generated which replaces the worst frog. 3.3.5. otherwise
Pw = Pw’’
3.3.6. otherwise Pw = Pw’
3.3.7. i = i + 1
3.4. frog shuffling together
4. Check the convergence. If the convergence criteria are satisfied stop, otherwise return to the step 3.
5.finish
TABLE 2.THE PARAMETERS OF SFLA
Parameter Value Comments
sfla_p 100 Population size
sfla_m 10 Number of memeplex
sfla_n _
_
sfla p
sfla m
Number of frog in each memeplex
sfla_q 4 Number of frog in submemeplex
f_max f_max Maximum length of each frog
IT_max 40 Total Iteration number
IT_mem 5 Iteration number for Modified worst frog
Min Fitness 60% Minimum fitness for frogs
A. Data Sets
We chose seven common microarray data sets to evaluate the accuracy of the proposed method. Summary of the data sets are give in Table 3.
The data sets include leukemia dataset [24], colon dataset [25], prostate tumor dataset [26], Diffuse Large B-Cell Lymphoma dataset (DLBCL) [27] and Central Nervous System dataset (CNS) [28], Lung dataset [29], prostate1 dataset [30]. Leukemia dataset contains expression levels of 7129 genes taken over 72 samples which contain 47 Acute Lymphoblastic Leukemia (ALL)
samples and 25 Acute Myelogenous Leukemia (AML) samples.
TABLE 3.MICROARRAY DATA SETS USED IN THE EXPERIMENTS
Data Set #Samples #Gene #classes #class1 #class2
Leukemia 72 7129 2 47 25
Colon 62 2000 2 40 22
Prostate 136 12600 2 77 59
DLBCL 77 11226 2 58 19
CNS 60 7129 2 39 21
Lung 181 12533 2 150 31
Prostate1 88 12625 2 38 50
The colon dataset contains expression levels of 2000 genes taken in 62 samples. For each sample it is indicated whether it came from a colon cancer or not. Prostate dataset contains expression levels of 12600 genes taken over 136 samples. For each sample it is indicated whether it came from a tumor or not. DLBCL dataset contains expression levels of 11226 genes taken over 77 samples which contain 58 diffuse large b-cell lymphoma samples and 19 Follicular lymphoma samples. The CNS dataset contains expression levels of 7129 genes taken over 60 samples. Lung dataset contains expression levels of 12533 genes taken over 181 samples. Prostate1 dataset contains expression levels of 12625 genes taken over 88 samples.
B. Results
Evaluation criteria to assess the performance of the proposed method are Accuracy, Specificity, Sensitivity and Balanced Rate (BR) defined below.
TP TN Accuracy
TP TN FP FN
(6)
TN Specificity
TN FP
(7)
TP Sensitivity
TP FN
(8)
2
Specificity Sensitivity
BR
(9)
After training phase, the mean fitness value of all frogs converges to its optimal value. As shown in Fig (1) it is clear that the mean fitness value and the maximum fitness value are increasing and after 16 iteration fitness value is almost constant, and the systems converge.
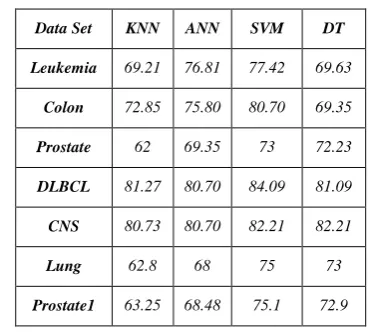
Table 4 presents the accuracy of common classification models applied into microarrays when no gene selection step is taken. The predictive results yielded by the proposed method with four classifiers, kNN, ANN, SVM, and DT are given in Table 5. Each classifier has an advantage on some datasets. Certainly, SVM outperforms other classifiers on most datasets. Table 6 summarizes the result of the number of selected genes via four classifiers on seven datasets. The SVM classifier base on proposed method selects smaller number of genes than other four methods in dataset.
In Fig (2) the measures accuracy, balance rates, sensitivity and specificity of each classifier for Prostate dataset are shown. As is clear from fig, performance of SVM classifier base on selected gene by proposed method is better than the other methods.
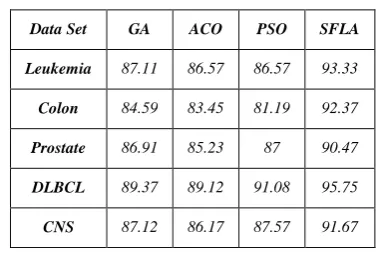
We also compare the performance of SFLA-FS with results obtained from three existing well known bionic optimization algorithms based on the SVM classifier. Table 7 shows the number of selected gene via four method on five dataset. A smaller number of genes selected by the method means that the methods is better. Apparently, the proposed method selected smaller number genes in comparison with the other three methods. Table 8 lists the accuracies of the proposed method and three methods on five dataset.
Table 9 summarizes the selected genes, some of which are new while others can also be found in the literature. For example our method find GSDMA gene. Study investigated the expression pattern of the GSDM family genes in the upper gastrointestinal epithelium and cancers. NRBP1, High NRBP1 expression in prostate cancer is linked with poor clinical outcomes and increased cancer cell growth. YWHAE, It has implicated in the pathogenesis of small cell cancer. WNK2 is involved in the modulation of growth factor-induced cancer cell proliferation through the MEK1/ERK1/2 pathway. ESRRG investigated the expression pattern of the ESRRG family genes in the upper cancers. Should be noted the disadvantage of this method is, its slow convergence
Fig. 1.Mean fitness value of frogs populations in the 40 iteration training
TABLE 4.ACCURACY OF COMMON CLASSIFICATION MODELS USED ON MICROARRAYS WHEN NO GENE
SELECTION STEP IS TAKEN
Data Set KNN ANN SVM DT
Leukemia 69.21 76.81 77.42 69.63
Colon 72.85 75.80 80.70 69.35
Prostate 62 69.35 73 72.23
DLBCL 81.27 80.70 84.09 81.09
CNS 80.73 80.70 82.21 82.21
Lung 62.8 68 75 73
Prostate1 63.25 68.48 75.1 72.9
TABLE 5.CLASSIFICATION ACCURACY RATES (%) OBTAINED BY SFLA BASED METHOD WITH DIFFERENT
CLASSIFIERS
Data Set KNN ANN SVM DT
Leukemia 86.66 86.66 93.77 90.53
Colon 92.30 92.30 92.37 92.37
Prostate 80.95 85.71 90.47 86.66
DLBCL 94.75 93.75 95.75 95.75
CNS 91.66 85.33 91.67 91.66
Lung 93.71 89.47 94.89 92.89
TABLE 6.THE NUMBER OF SELECTED GENES OBTAINED BY SFLA-FS BASED METHOD VIA DIFFERENT CLASSIFIERS
Data Set KNN ANN SVM DT
Leukemia 28 23 19 22
Colon 25 19 19 27
Prostate 18 17 14 21
DLBCL 32 24 19 27
CNS 17 13 9 17
Lung 17 17 12 18
Prostate1 15 19 13 20
Fig. 2.Comparing the performance measures (accuracy, Specificity, Sensitivity and Balanced Rate) of each classifier
for Prostate dataset
TABLE 7.TABLE 7: THE NUMBER SELECTED GENES OBTAINED BY THE FOUR METHODS ON DATASETS.
Data Set GA ACO PSO SFLA
Leukemia 123 101 87 19
Colon 129 117 73 19
Prostate 138 127 131 14
DLBCL 121 116 74 19
CNS 118 109 78 9
TABLE 8.CLASSIFICATION ACCURACY RATE (%) OBTAINED BY GA, ACO, PSO AND SFLA
Data Set GA ACO PSO SFLA
Leukemia 87.11 86.57 86.57 93.33
Colon 84.59 83.45 81.19 92.37
Prostate 86.91 85.23 87 90.47
DLBCL 89.37 89.12 91.08 95.75
CNS 87.12 86.17 87.57 91.67
TABLE 9.SUMMARIZES THE SELECTED GENES
CCDC19 NRBP1 PCNA PRKCQ RAI2
ESRRG YWHAE TAGAP SNAPC5 CNN3
MED16 ROD1 DGKG NMT2 SPC24
ECM2 NASP MTRF1 ATPAF1 DDX31
GSDMA C17orf51 WDTC1 WNK2 GABRB3
GP9 HLA-DQA2 HN1L HES3 MCM6
ZNF878 DBF4 JAG1 MED15 PHF11
ERLIN1 PPAP2A TMEM192 PRPF40A TDP1 ACSF3 SNORD14D NGEF COL17A1 SAMD3
4. CONCLUSION
In this paper, we presented an efficient method for gene selection. The proposed framework consists of two stages, in the first stage a filter method is used to rank genes from a high dimensional data. In the second stage, SFLA is applied to gene selection. Frog will be updated using first stage information and low ranked genes will be removed and high ranked genes will be added. The experimental results show that SFLA-FS enables to balance between exploration and exploitation, thus finding more important genes by taking advantage of the parameter adjustment and gene importance. SFLA-FS method not only selects a gene subset of smallest size, but also improves cancer classification accuracy. This is because, each frog represents a subset of genes which is different for any other frog so we can select smallest set of gene also when we want to updated frogs low ranked genes will be removed of frog and high ranked genes will be added to frog. Moreover Submemeplex causes the algorithm does get seldom stuck in a local optimum.
REFERENCES
[1] Chang.C and Lin.C.J,” LIBSVM:a library for
[2] Hajiloo.M, Rabiee.H.R and Anooshahpour .M,”Fuzzy support vector machine: an efficient
rule-based classification technique for
microarrays,” BMC bioinformatics
/1471-2105/14/s13/s4. 2013.
[3] Ammu.K and Preeja.V,”Feature Selection for high
Dimensional DNA Microarray data using hybrid approaches,” Bioinformatics, vol. 9, no. 16, pp. 824-828, 2013.
[4] Abedini.M,Kirly.M and Chiong.R, ”Incorporating
feature ranking and evolutionary methods for the
classification of high-dimensional DNA
microarray gene expression data,” Australasian Medical Journal AMJ, vol. 6, no. 5, pp. 272-279, 2013.
[5] Ben-Bassat.M,”Pattern recognition and reduction
of dimensionality,” In Krishnaiah.P and Kanal,L, (eds.) Handbook of Statistics II, Vol. 1.North-Holland, Amsterdam. pp. 773–791, 1982.
[6] Yu.L and Liu.H, “Efficient feature selection via analysis of relevance and redundancy,” J. Mach. Learn. Res, vol. 5, pp. 1205–1224, 2004.
[7] ElAlami.M.E,”A filter model for feature subset
selection based on genetic algorithm,” Knowledge-Based Systems, vol. 22, pp. 356–362, 2009.
[8] Kittler.J, “Pattern Recognition and Signal
Processing: Chapter Feature Set Search
Algorithms,” Sijth off and Noordhoff, Alphen an den Rijn, Netherlands, pp. 41–60, 1978.
[9] Foithong. S, Pinngern. O, and Attachoo.B,
”Feature subset selection wrapper based on mutual information and rough sets,” Expert Systems with Applications, vol. 39, pp. 574–584, 2012.
[10] Yang.W,Li.D and Zhu.L, ”An improved genetic
algorithm for optimal feature subset selection from multi-character feature set,” Expert Systems with Applications, vol. 38, pp.2733–2740, 2011.
[11] Gheyas .I and Leslie .S,”Feature subset selection
in large dimensionality domains,” Pattern
Recognition, vol. 43, pp. 5 – 13, 2010.
[12] Yassi .M and Moattar .M.H ,” Robust and stable feature selection by integrating ranking methods
and wrapper technique in genetic data
classification ,” Biochemical and Biophysical Research Communications, vol. 446, pp. 850–856, 2014.
[13] Weston .J and et al,”Use of the zero-norm with linear models and kernel methods,” J. Mach. Learn. Res , vol. 3, pp. 1439 –1461, 2003.
[14] Duda .P and et al, Pattern Classification, Wiley, New York, 2001.
[15] MonirulKabir .M.D, Shahjahan .M.D and Murase
.K, “A new hybrid ant colony optimization algorithm for feature selection,” Expert Systems with Applications, vol. 39, pp. 3747–3763, 2012.
[16] Bermejo .P, Ossa .L, Gmez .L and Puerta .J.M, ”Fast wrapper feature subset selection in high-dimensional datasets by means of filter re-ranking,” Knowledge-Based Systems, vol. 25, pp. 35–44, 2012.
[17] Sivagaminathan .R and Ramakrishnan .M,”A
hybrid approach for feature subset selection using neural networks and ant colony optimization,” Expert Systems with Applications, vol. 33, pp. 49– 60, 2007.
[18] Shengqiao.Li, James .H.E and Adjeroh. D.A,
“Random KNN feature selection - a fast and stable
Alternative to Random Forests,” BMC
Bioinformatics, vol. 12, pp. 450, 2011.
[19] Huang .J and et al,”Decision forest for
classification of gene expression data,” Computers in biology and medicine, vol. 40, pp.698-704, 2010.
[20] Li .X and Zhao .H, “Weighted random subspace
method for high dimensional data classification,” Stat Interface, vol. 2, pp. 153–159, 2009.
[21] Eusuff .M, Laney .K and Pasha .F, “Shuffled
frog-leaping algorithm: a mimetic meta-heuristic for discrete optimization,” Engineering Optimization, vol. 38, no. 2, pp. 129-154, 2006.
[22] Duan, Q.Y, et al, “Shuffled complex evolution
approach for effective and efficient global minimization,” journal of optimization theory and application, vol. 76, no. 3, pp. 501-521, 2009.
[23] Golub .T.R and et al, “Molecular Classification of
Cancer: Class Discovery and Class Prediction by Gene Expression Monitoring,” Science, vol. 826, no. 5439, pp. 530-537, 1999.
[24] Alon .U, Barkai .N and Notterman .D.A,
Gishdagger .k, Ybarradagger .S, Mackdagger .D and Levine .A.J. “Broad Patterns of Gene Expression Revealed by Clustering Analysis of Tumor and Normal Colon Tissues Probed by Oligonucleotide Arrays,” Proc. Nat’l Academy of Sciences USA, vol. 96, no. 08, pp. 6745-6750. June 1999.
[25] Singh .D and et al. “Gene Expression Correlates of
Clinical Prostate Cancer Behavior,” Cancer Cell, vol. 0, no. 8, pp. 803-809, 2000.
[26] Shipp .M.A and et al, “Diffuse Large B-Cell
Lymphoma Outcome Prediction by
Learning,” Nature Medicine, vol. 2, no.0, pp. 62-74.Jan, 2008.
[27] Pomeroy .S.L and et al, “Prediction of Central Nervous System Embryonic Tumor Outcome Based on Gene Expression,” Nature, vol. 405, pp. 865-870, 2008.
[28] Gordon GJ, Jensen RV, Hsiao LL, Gullans SR, Blumenstock JE, Ramaswami S ,Richards WG, Sugarbaker DJ, Bueno R: “Translation of microarray data into clinically relevant cancer diagnostic tests using gene expression ratios in lung cancer and mesothelioma,” Cancer Res, vol. 62, pp. 4963–4967, 2002.
[29] Stuart RO, Wachsman W, Berry CC,