Language Learning Aptitude and Language Learning
Strategy Use
Zainab Abolfazli Khonbi1 & Karim Sadeghi2
1Corresponding author, Urmia University, [email protected]
2Urmia University, [email protected]
Received: 09/04/2014 Accepted: 30/10/2014
Abstract
This study investigated the relationship between language learning aptitude (LLA) and the use of language learning strategies (LLSs) among a cohort of Iranian EFL students at Urmia University, Iran. The adapted versions of the Modern Language Aptitude Test (MLAT; Carrol & Sapon, 1983) and Oxford’s (1990) Strategy Inventory for Language Learning (SILL) were distributed among the participants (i.e., 6 males and 32 females). A strong positive relationship was found between aptitude and the use of all the categories of LLSs. Pearson product-moment
correlation also indicated a strong positive relationship among
components/categories within MLAT and SILL. Furthermore, the application of t
test showed no significant differences between the males and females on their overall LLA test scores, but a one-way ANOVA indicated significant differences between the two genders regarding the cognitive and metacognitive strategies in favor of the males. One-way ANOVA also revealed significant differences between high versus low-aptitude students on LLSs use in favor of the former group.
Keywords: Iranian EFL Students; Language Learning Aptitude (LLA); Language Learning Strategies (LLSs); Strategy Training
1.Introduction
in the course of L2 development (Dörnyei & Skehan, 2003; Ellis, 1997). Research on students’ LLSs has been a hot topic since the late 1970s (Hong-Nam & Leavell, 2007; Zare, 2010). There seems to be certain factors that determine the choice and use of LLSs. Previous experience, gender, affective/cognitive styles, or linguistic backgrounds/social settings, and language learning aptitude (LLA) are some of the variables responsible for differential learning among EFL students (Ellis, 1997; Harley & Hart, 2000; Skehan, 1989).
One of the most frequently cited definitions of LLSs in the literature was provided by Oxford (1990) as “specific actions taken by the learner to make learning easier, faster, more enjoyable, more self-directed, more effective, and more transferable to new situations” (p. 8). These strategies have also been described as “any sets of operations, steps, plans, routines used by the learner to facilitate the obtaining, storage, retrieval, and use of information” (Wenden & Rubin, 1987, p.19) and “special thoughts or behaviors that individuals use to help them comprehend, learn, or retain new information” (O’Malley & Chamot, 1990, p. 1). Richards, Platt, and Platt (1992) regard learning strategies as “intentional behavior and thoughts that learners make use of during learning in order to better help them understand, learn, or remember new information” (p. 209).
The most inclusive taxonomy of LLSs was provided by Oxford (1990). She categorized LLSs into two main categories (i.e., direct and indirect strategies), subdivided into six classes. Direct strategies which “require mental processing of the language” (p. 37) are divided into memory, cognitive, and compensation strategies. Indirect strategies consist of metacognitive, affective, and social strategies. These strategies assist language learning indirectly by employing multiple strategies like focusing, arranging, evaluating, seeking opportunities, and lowering anxiety (Oxford, 1990).
Within a cognitive information processing paradigm, according to Robinson (2005), LLA has been defined as strengths that every learner might have in their cognitive abilities. These strengths are required for information processing both during L2 learning process and for performance, in different contexts and at various stages. Highlighting the importance of aptitude as a foundation for learning, Snow (1992) in broad terms characterizes it as,
Finally, Cronbach and Snow (1977) describe aptitude as “whatever makes a person ready to learn rapidly in a particular situation (or, more generally to make effective use of a particular environment)” (p. 107).
The most frequently used instrument for testing LLA is Modern Language Test (MLAT) which has been initially developed as a means of screening candidates for foreign language instruction. Generally, MLAT has five different components, each focusing on a separate skill: (a) number learning, (b) phonetic script, (c) spelling clues, (d) words in sentences, and (e) paired associates. It was shown statistically that these five components are representative of a number of underlying constructs constituting LLA (Ellis, 2008). Carrol (1965) identified four key constructs in MLAT, namely phonemic coding ability (i.e., the ability to code foreign sounds in a way that can be remembered later, grammatical sensitivity (i.e., the ability to recognize the grammatical functions of words in sentences), inductive language-learning ability (i.e., the ability to identify patterns of correspondence and relationships involving form and meaning), and rote-learning ability (i.e., the ability to form and remember associations between stimuli).
The two factors discussed above (i.e., LLA and LLSs use) are among the two influential variables affecting success in any learning program. However, if the students who enter an educational program via some kind of standardized exam such as university entrance examination, as is the norm in Iran, are expected to enjoy an approximately equal level of LLA, it needs investigation into why during and at the end of the program, these students prove to perform differently. It seems that some other factors should determine how and the extent to which students can utilize their abilities, or to put it differently, some other factors seem to be related to LLA which make it function inconsistently among individuals. LLSs are a determining element in this regard. In order to get a solid view of this relationship, studies should be carried out in multiple settings because each context has unique characteristics which would limit the degree to which its results could be generalized. However, to make this claim of empirical reference, this study was an attempt to investigate the relationship between these two factors in an Iranian EFL context. The controversies in some findings of research on LLA and LLSs, intensified by the lack of research examining the two in combination both worldwide and locally (particularly in an Iranian university EFL context), invoked the current researchers to explore the link between these two factors by scrutinizing them from three angels: (1) the relationship between LLA and LLSs use, (2) the relationship between gender and LLA and the use of LLSs, and (3) the role of LLA in the use of LLSs.
2. Literature Review
their learning independently (Frey, 2014). Even if this prediction does not materialize by the predicted deadline, very few people will deny the role of independent learning (i.e., education without the help of a teacher) in our current education system. To become an independent learner, either today or tomorrow, there is an urgent need for the learner to first identify which strategies they currently use, and then to find out which strategies they should learn to become more effective learners so that they can survive without the help of a teacher. This is why LLSs have attracted the attention of numerous researchers, teachers, and learners.
Allwright (1990) and Little (1991) propose that for strategies to enable more independent, autonomous, and lifelong learning, they must meet three conditions. First, the strategy must relate well to the L2 task at hand; second, the strategy should fit the particular student’s learning style preferences to one degree or another; and third, the student ought to employ the strategy effectively and link it with other relevant strategies. Chamot and O’Malley (1996) as well as Cohen and Weaver (1998) investigated the effects of strategy instruction among native-English-speaking learners of foreign languages and found some positive results mixed with neutral findings. Strategy instruction also led to increased L2 learning motivation (Nunan, 1997) and greater strategy use and self-efficacy (Chamot & O’Malley, 1996). Further, it was realized that certain learners seemed to be successful regardless of methods or teaching techniques. Observations and research studies led
researchers (Rubin, 1975; Rubin & Thompson, 1994; Stern, 1975) to describe good
language learners in terms of personal characteristics, styles, and strategies. They insist that successful and proficient language learners have reported to use a wider range of LLSs; however, the amount of prior exposure to the English language, learner’s aims, and proficiency levels should be considered in determining who the good language learner is (Anderson, 2005; Bruen, 2001; Ehrman & Oxford, 1989; Green & Oxford, 1995; Griffiths, 2003; Lee, 2003; Rahimi, Riazi, & Saif, 2008).
and their relationship to English achievement found the strong and consistent effect of belief variables on strategy variables.
The most consistent predictor of one’s success in learning a foreign language as declared by Dörnyei (2005) is aptitude. To Lightbown and Spada (1999), one can suppose that a high-aptitude learner learns with greater ease and speed, but low-aptitude learners can accomplish success if they persevere. Robinson (2001, 2005) believed that aptitude does not have a unidimensional nature. It is, indeed, hierarchical and multilevel, a characteristic which he calls an aptitude complex. In proposing the model, Robinson (2001) adopted an interactionist approach where multiple perspectives of the situation, the individual, and their interaction were presented. Robinson (2001) claims that if this interaction occurs successfully and at a high level, it can lead to “academic success in a variety of educational contexts (p. 371).
Also, Ranta (1995, as cited in Lightbown & Spada, 1999), working on children, found that children who were good at analyzing language (one component of aptitude that is targeted by aptitude tests) were the most successful learners in an English L2 program in which activities almost never involved distinct attention to grammar. Elsewhere, Erlam (2005) worked with secondary school learners and divided them into three groups who received either deductive or inductive or structured input instructions (60 were in each group), he found that deductive instruction that allows students to produce language output may control for the effect of individual differences in LLA. Gardner and Lambert (1972) found that grammatical sensitivity (a component in aptitude tests) correlates with grades in all aspects of educational attainment (not just in foreign language learning), and that other kinds of learning are to some extent linked to each other. Ehrman and Oxford (1995) found that language analytic ability is a predictor of success in L2 learning. Furthermore, performance on the words and sentences sections of MLAT was one of the differential variables that strongly correlated with proficiency.
If LLA and LLSs use were found to be related, the results of the study can then be used in a variety of ways to help students progress more efficiently and even independently. LLA tests can detect the choice and frequency of use of LLSs among high and low-aptitude students. Consequently, programs can be scheduled to include teaching LLSs used by high-aptitude students to low-aptitude students. Then, through practice, students will learn to use these LLSs more frequently, consciously or unconsciously, and in turn will gradually improve their attainment. Motivated by a dearth of research on the relationship between LLA and LLSs in an Iranian EFL context in particular, this research was aimed to understand how university EFL students’ LLA is actually related to their LLSs use. Another aim of this research was to identify the easiest and the most difficult parts of aptitude, based on which matched forms of instruction can be developed. In this paper, the researchers investigated the role of LLA on and the relationship between gender and learners’ patterns of strategy use and LLA, as aptitude and strategy seemed to be interrelated. In particular, this study tried to answer three general research questions as follows:
1. Is there any significant relationship between Iranian university EFL
students’ LLA and LLSs use?
2. Is there any significant relationship between gender and Iranian university
EFL students’ LLA and LLSs use?
3. Method
3.1. Participants
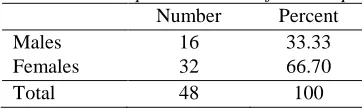
The participants were 48 male and female Iranian university EFL students at Urmia University, Iran, and ranged in age from 21 to 23. The study employed a convenient sampling procedure and, indeed, all the senior students doing a B.A. in English language and literature at Urmia University participated in this study. They were all in the same class and were more or less the same in terms of their L1 and cultural backgrounds. The distribution of participants based on their gender is provided in Table 1:
Table 1. DescriptiveStatistics of the Sample
Number Percent
Males 16 33.33
Females 32 66.70
Total 48 100
3.2. Instruments
some participants. The final version had five parts with 10 items in each, so the test had a total of 50 multiple-choice items including, number learning (items 1-10), phonetic script (items 11-20), spelling clues (items 21-30), words in sentences (items 31-40), and paired associates (items 41-50).
The second tool was Oxford’s (1990) 50-items SILL (version 7.0). It had a
five-point Likert scale format: from 1 (never) to 5 (always). SILL structures the
strategies into six categories, namely memory strategies (items 1-9), cognitive strategies (items 10-23), compensatory strategies (items 24-29), metacognitive strategies (items 30-38), affective strategies (items 39-44), and social strategies (items 45-50). The estimates of Cronbach’s alpha reliability indices for MLAT
(items = 50 and SILL (items = 50) were estimated as r = .80 and r = .87,
respectively, both of which were good according to Cohen’s (1988) specification. The validity of MLAT and SILL has been established due to their wide use and acceptance among researchers in relevant fields.
3.3. Procedure
This study followed a survey-based design in which MLAT and SILL were given to the research sample. The students were given instructions on how to complete the two. They were instructed to provide their best options in the case of MLAT and to give complete and honest responses to the SILL.
Paired Associates (PA), a list of 10 Kurdish words along with their English translations (which they were required to memorize) was given to the students. Then, the Kurdish words were given to the students and they specified the correct English translation for each word from among five alternatives.
Regarding the SILL, in addition to the directions provided on the questionnaire itself (which the students were required to follow with great care), they were told in Persian that there were 50 statements with respect to strategies they may use when learning English as a foreign language. It was explained to them that they needed to indicate how often they use each of the strategies on a scale from ‘never’ to ‘always’ by putting a mark on the associated cells in the strategy table.
The questionnaires were administered as part of the classroom hour between two groups of students, and their completion took nearly 45 min (firstly, 30 min was devoted to MLAT completion and, secondly, 15 min was given for SILL).
3.4. Data Analysis
Using the Statistical Package for Social Sciences (Version 17), the whole analysis procedure was divided into two main parts: (a) Four series of Pearson product-moment correlations in order to find the relationships between total aptitude scores and total strategy use, between total aptitude and categories of strategies, between total strategy use and components of MLAT, and among the component
parts of the aptitude and the specific types of strategies; (b) two series of t tests and
ANOVAs in order to show how the groups (males and females versus low and high-aptitude) differed from each other in LLA and LLSs use. It needs to be mentioned that the students’ MLAT scores were the sum of their correct responses to each item, and for the items in SILL, because there was no right or wrong answer, each student’s response to an item was an indication of the amount of his or her agreement/disagreement with it.
4. Results
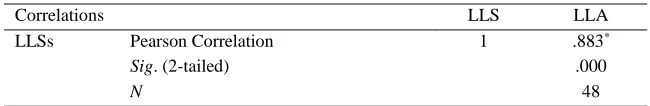
For the first stage, the Pearson product-moment correlation was carried out
which revealed that there was a significantly large positive relationship (r = .88)
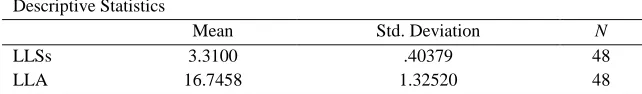
between total LLA test scores and the frequency of use of LLSs by the participating EFL students. Table 2 shows the means of aptitude and LLSs use among the participants and Table 3 presents the results of the correlation test:
Table 2. Descriptive Statistics for Total LLSs Use and Total MLAT Scores
Descriptive Statistics
Mean Std. Deviation N
LLSs 3.3100 .40379 48
Table 3. Pearson Product-Moment Between Total MLAT Scores and Total LLSs Use
Correlations LLS LLA
LLSs Pearson Correlation 1 .883*
Sig. (2-tailed) .000
N 48
*Correlation is significant at the 0.01 level (2-tailed).
In order to see which type of strategy correlated most with the aptitude scores, another Pearson product-moment correlation was run, and it was found that aptitude had large positive correlations with all categories of strategies except for memory strategies (see Table 4):
Table 4. PearsonProduct-Moment for the Total MLAT Scores and the Categories of LLSs
Correlations
LLA Mem
o ry C o g n it iv e C o m p en sa ti o n M etac o g n it iv e A ffe cti v e S o cial
LLA Pearson Correlation 1 .233 .843** .639** .674** .596** .527**
Sig. (2-tailed) .111 .000 .000 .000 .000 .000
N 48 48 48 48 48 48 48
*Correlation is significant at the 0.05 level (2-tailed). **Correlation is significant at the 0.01 level (2-tailed).
Similarly, another correlation test revealed that the use of LLSs had significant large positive relationships with all components of MLAT, but a small one with the scores on phonetic script:
Table 5. Pearson Product-Moment for Total LLSs Use and Components of MLAT
Correlations LLSs NL PS SC WS PA
LLSs
Pearson Correlation 1 .408** .290* .613** .616** .451**
Sig. (2-tailed) .004 .045 .000 .000 .001
N 48 48 48 48 48 48
*Correlation is significant at the 0.05 level (2-tailed). **Correlation is significant at the 0.01 level (2-tailed).
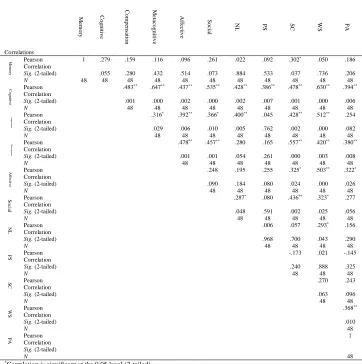
In order to understand whether the components of MLAT were in any ways related to the specific types of strategies as well as within themselves, the scores on each part of MLAT was correlated with each strategy type (see Table 6). It was interesting that large positive correlations were found: Metacognitive strategies
correlated with SC, PS, WS components; cognitive strategies correlated with all components; social strategies correlated with SC, WS, NL parts; compensation strategies correlated with SC, WS, NL sections; affective strategies correlated with SC, WS, PA components; and memory strategies correlated with SC section.
relationship was found between performance on NL part and WS section; other components of MLAT were not related to each other. A further finding of this test was that the use of memory strategies was not correlated with the use of other strategies and that the use of affective strategies had no relationship with social strategy use; all the other strategy types, namely cognitive, compensation, metacognitive, affective, and social, had large positive correlations with each other in their frequencies of use.
Table 6. Pearson Product-Moment for Categories of LLSs and Components of MLAT
Correlations M emor y C ognit ive C ompens ati on M etac ognit ive Af fe cti ve S oc
ial NL PS SC
WS PA M e m o ry Pearson Correlation
1 .279 .159 .116 .096 .261 .022 .092 .302* .050 .186
Sig. (2-tailed) .055 .280 .432 .514 .073 .884 .533 .037 .736 .206
N 48 48 48 48 48 48 48 48 48 48 48
Co g n itiv e Pearson Correlation
.483** .647** .437** .535** .428** .386** .478** .630** .394**
Sig. (2-tailed) .001 .000 .002 .000 .002 .007 .001 .000 .006
N 48 48 48 48 48 48 48 48 48
c o m pe n sa tio n Pearson Correlation
.316* .392** .366* .400** .045 .428** .512** .254
Sig. (2-tailed) .029 .006 .010 .005 .762 .002 .000 .082
N 48 48 48 48 48 48 48 48
M eta co gn itiv e Pearson Correlation
.478** .457** .280 .165 .557** .420** .380**
Sig. (2-tailed) .001 .001 .054 .261 .000 .003 .008
N 48 48 48 48 48 48 48
A ffe c tiv e Pearson Correlation
.248 .195 .255 .325* .503** .322*
Sig. (2-tailed) .090 .184 .080 .024 .000 .026
N 48 48 48 48 48 48
S oc ia l Pearson Correlation
.287* .080 .436** .323* .277
Sig. (2-tailed) .048 .591 .002 .025 .056
N 48 48 48 48 48
NL Pearson Correlation
.006 .057 .293* .156
Sig. (2-tailed) .968 .700 .043 .290
N 48 48 48 48
PS Pearson Correlation
-.173 .021 -.145
Sig. (2-tailed) .240 .888 .325
N 48 48 48
SC Pearson Correlation
.270 .243
Sig. (2-tailed) .063 .096
N 48 48
WS Pearson Correlation
.368**
Sig. (2-tailed) .010
N 48
PA Pearson Correlation
1 Sig. (2-tailed)
N 48
*Correlation is significant at the 0.05 level (2-tailed). **Correlation is significant at the 0.01 level (2-tailed).
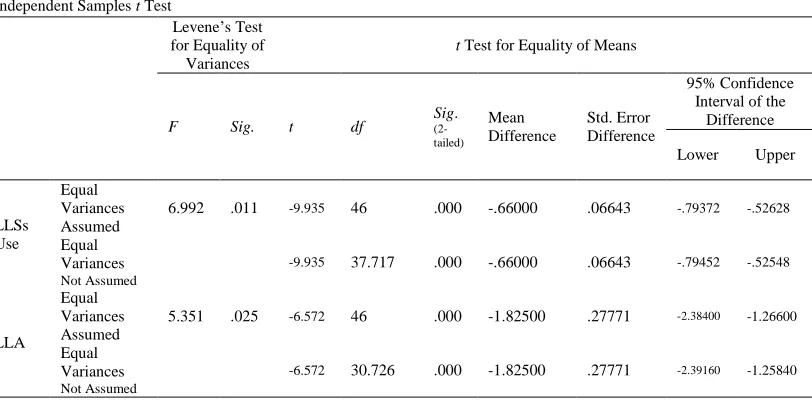
MLAT score, and then they were divided into two groups of equal numbers. The t -test table that follows reveals that the differences between the high and low-aptitude groups on both MLAT and SILL was statistically significant:
Table 7. t Test for Aptitude Level and MLAT Scores and Strategy Use
Independent Samples t Test
Levene’s Test for Equality of Variances
t Test for Equality of Means
F Sig. t df Sig(2-.
tailed)
Mean Difference
Std. Error Difference
95% Confidence Interval of the
Difference Lower Upper
LLSs Use
Equal Variances Assumed
6.992 .011 -9.935 46 .000 -.66000 .06643 -.79372 -.52628
Equal Variances
Not Assumed
-9.935 37.717 .000 -.66000 .06643 -.79452 -.52548
LLA
Equal Variances Assumed
5.351 .025 -6.572 46 .000 -1.82500 .27771 -2.38400 -1.26600
Equal Variances
Not Assumed
-6.572 30.726 .000 -1.82500 .27771 -2.39160 -1.25840
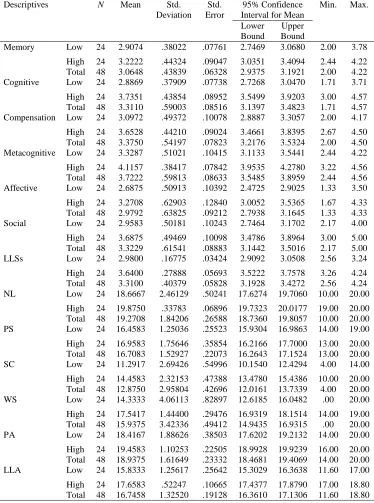
Table 8 shows the descriptive statistics for performances on the components of MLAT between the two aptitude level groups. It can be seen that the high-aptitude students had consistently and significantly outperformed the low-aptitude students on each component of MLAT, except on the PS part for which their difference was not statistically significant. The table also shows that, in general, (following Oxford’s classification, 1990), the high-aptitude students were
high strategy users (M = 3.64), but the low-aptitude students used strategies with a
medium frequency (M = 2.98). In detail, out of the six strategy types for which the
low-aptitude students were regarded as medium users, the high-aptitude students were similar to them only in the implementation of memory and affective strategies;
however, these students were high users of metacognitive (M = 4.11), cognitive (M
Table 8. Descriptive Statistics for MLAT and SILL Performances Based on Aptitude Level
Descriptives N Mean Std. Deviation
Std. Error
95% Confidence Interval for Mean
Min. Max.
Lower Bound
Upper Bound
Memory Low 24 2.9074 .38022 .07761 2.7469 3.0680 2.00 3.78
High 24 3.2222 .44324 .09047 3.0351 3.4094 2.44 4.22 Total 48 3.0648 .43839 .06328 2.9375 3.1921 2.00 4.22 Cognitive Low 24 2.8869 .37909 .07738 2.7268 3.0470 1.71 3.71
High 24 3.7351 .43854 .08952 3.5499 3.9203 3.00 4.57 Total 48 3.3110 .59003 .08516 3.1397 3.4823 1.71 4.57 Compensation Low 24 3.0972 .49372 .10078 2.8887 3.3057 2.00 4.17
High 24 3.6528 .44210 .09024 3.4661 3.8395 2.67 4.50 Total 48 3.3750 .54197 .07823 3.2176 3.5324 2.00 4.50 Metacognitive Low 24 3.3287 .51021 .10415 3.1133 3.5441 2.44 4.22
High 24 4.1157 .38417 .07842 3.9535 4.2780 3.22 4.56 Total 48 3.7222 .59813 .08633 3.5485 3.8959 2.44 4.56 Affective Low 24 2.6875 .50913 .10392 2.4725 2.9025 1.33 3.50
High 24 3.2708 .62903 .12840 3.0052 3.5365 1.67 4.33 Total 48 2.9792 .63825 .09212 2.7938 3.1645 1.33 4.33 Social Low 24 2.9583 .50181 .10243 2.7464 3.1702 2.17 4.00
High 24 3.6875 .49469 .10098 3.4786 3.8964 3.00 5.00 Total 48 3.3229 .61541 .08883 3.1442 3.5016 2.17 5.00 LLSs Low 24 2.9800 .16775 .03424 2.9092 3.0508 2.56 3.24
High 24 3.6400 .27888 .05693 3.5222 3.7578 3.26 4.24 Total 48 3.3100 .40379 .05828 3.1928 3.4272 2.56 4.24 NL Low 24 18.6667 2.46129 .50241 17.6274 19.7060 10.00 20.00
High 24 19.8750 .33783 .06896 19.7323 20.0177 19.00 20.00 Total 48 19.2708 1.84206 .26588 18.7360 19.8057 10.00 20.00 PS Low 24 16.4583 1.25036 .25523 15.9304 16.9863 14.00 19.00
High 24 16.9583 1.75646 .35854 16.2166 17.7000 13.00 20.00 Total 48 16.7083 1.52927 .22073 16.2643 17.1524 13.00 20.00 SC Low 24 11.2917 2.69426 .54996 10.1540 12.4294 4.00 14.00
High 24 14.4583 2.32153 .47388 13.4780 15.4386 10.00 20.00 Total 48 12.8750 2.95804 .42696 12.0161 13.7339 4.00 20.00 WS Low 24 14.3333 4.06113 .82897 12.6185 16.0482 .00 20.00
High 24 17.5417 1.44400 .29476 16.9319 18.1514 14.00 19.00 Total 48 15.9375 3.42336 .49412 14.9435 16.9315 .00 20.00 PA Low 24 18.4167 1.88626 .38503 17.6202 19.2132 14.00 20.00
High 24 19.4583 1.10253 .22505 18.9928 19.9239 16.00 20.00 Total 48 18.9375 1.61649 .23332 18.4681 19.4069 14.00 20.00 LLA Low 24 15.8333 1.25617 .25642 15.3029 16.3638 11.60 17.00
As is revealed in the ANOVA table that follows (see Table 9), the differences in the mean scores on each component of MLAT was significant between the groups in favor of the high-aptitude students. Based on the aptitude groups’ mean scores on the components of MLAT (See Table 8), the order of difficulty of its components, as the most difficult component, was the SC part (M = 12.87) followed by WS (M = 15.93), then PS (M = 16.70) followed by PA (M = 18.93), and finally the easiest one was NL (M= 19.27):
Table 9. ANOVA Test for MLAT and SILL Performances Based on Aptitude Level
ANOVA Sum of
Squares
df Mean Square F Sig.
Memory Between Groups
1.189 1 1.189 6.975 .011 Within Groups 7.844 46 .171
Total 9.033 47 Cognitive Between
Groups
8.634 1 8.634 51.387 .000 Within Groups 7.729 46 .168
Total 16.362 47 Compensation Between
Groups
3.704 1 3.704 16.865 .000 Within Groups 10.102 46 .220
Total 13.806 47 Metacognitive Between
Groups
7.433 1 7.433 36.446 .000 Within Groups 9.382 46 .204
Total 16.815 47 Affective Between
Groups
4.083 1 4.083 12.470 .001 Within Groups 15.062 46 .327
Total 19.146 47 Social Between
Groups
6.380 1 6.380 25.699 .000 Within Groups 11.420 46 .248
Total 17.800 47 NL Between
Groups
17.521 1 17.521 5.677 .021 Within Groups 141.958 46 3.086
Total 159.479 47 PS Between
Groups
3.000 1 3.000 1.291 .262 Within Groups 106.917 46 2.324
Total 109.917 47 SC Between
Groups
120.333 1 120.333 19.027 .000 Within Groups 290.917 46 6.324
Total 411.250 47 WS Between
Groups
123.521 1 123.521 13.298 .001 Within Groups 427.292 46 9.289
Total 550.813 47 PA Between
Groups
13.021 1 13.021 5.455 .024 Within Groups 109.792 46 2.387
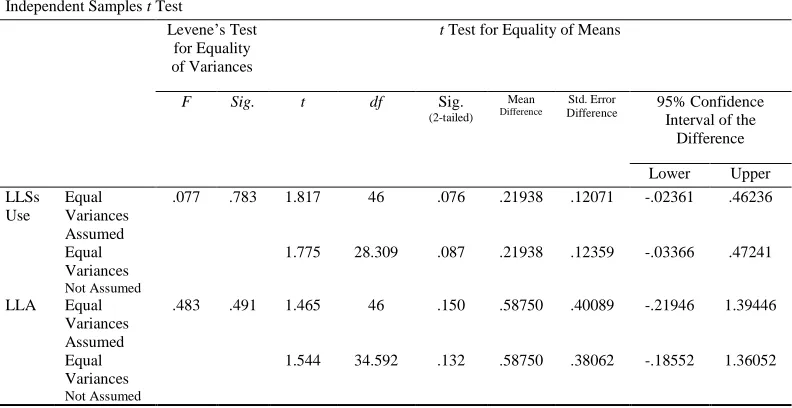
To recognize the role of gender on LLA and LLSs use, the two genders’ differences in terms of their mean scores on MLAT and LLSs use were compared.
As presented in the t-test table below, their differences were not statistically
significant:
Table 10. tTest for Gender and MLAT Scores and Strategy Use
Independent Samples t Test
Levene’s Test for Equality of Variances
t Test for Equality of Means
F Sig. t df Sig.
(2-tailed) Mean
Difference
Std. Error
Difference 95% Confidence
Interval of the Difference Lower Upper LLSs
Use
Equal Variances Assumed
.077 .783 1.817 46 .076 .21938 .12071 -.02361 .46236
Equal Variances
Not Assumed
1.775 28.309 .087 .21938 .12359 -.03366 .47241
LLA Equal Variances Assumed
.483 .491 1.465 46 .150 .58750 .40089 -.21946 1.39446
Equal Variances
Not Assumed
1.544 34.592 .132 .58750 .38062 -.18552 1.36052
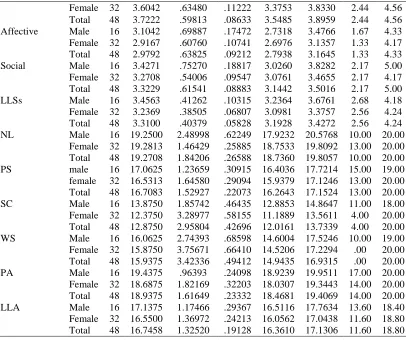
It can be seen in the following descriptive data table (see Table 11), all types of strategies were used with a medium frequency among both males and females, except for the case of metacognitive strategies that enjoyed a high level of utilization in the two groups and cognitive strategies that were used with a higher frequency among males:
Table 11. Descriptive Statistics for Performances on MLAT and SILL Based on Gender
Descriptives N Mean Std.
Deviation Std. Error
95% Confidence Interval for Mean
Min. Max.
Lower Bound
Upper Bound
Memory Male 16 3.0625 .52739 .13185 2.7815 3.3435 2.00 4.22
Female 32 3.0660 .39598 .07000 2.9232 3.2087 2.33 4.00
Total 48 3.0648 .43839 .06328 2.9375 3.1921 2.00 4.22
Cognitive Male 16 3.5625 .62861 .15715 3.2275 3.8975 2.29 4.43
Female 32 3.1853 .53632 .09481 2.9919 3.3786 1.71 4.57
Total 48 3.3110 .59003 .08516 3.1397 3.4823 1.71 4.57
Compensation Male 16 3.4271 .47519 .11880 3.1739 3.6803 2.50 4.17
Female 32 3.3490 .57791 .10216 3.1406 3.5573 2.00 4.50
Total 48 3.3750 .54197 .07823 3.2176 3.5324 2.00 4.50
Female 32 3.6042 .63480 .11222 3.3753 3.8330 2.44 4.56
Total 48 3.7222 .59813 .08633 3.5485 3.8959 2.44 4.56
Affective Male 16 3.1042 .69887 .17472 2.7318 3.4766 1.67 4.33
Female 32 2.9167 .60760 .10741 2.6976 3.1357 1.33 4.17
Total 48 2.9792 .63825 .09212 2.7938 3.1645 1.33 4.33
Social Male 16 3.4271 .75270 .18817 3.0260 3.8282 2.17 5.00
Female 32 3.2708 .54006 .09547 3.0761 3.4655 2.17 4.17
Total 48 3.3229 .61541 .08883 3.1442 3.5016 2.17 5.00
LLSs Male 16 3.4563 .41262 .10315 3.2364 3.6761 2.68 4.18
Female 32 3.2369 .38505 .06807 3.0981 3.3757 2.56 4.24
Total 48 3.3100 .40379 .05828 3.1928 3.4272 2.56 4.24
NL Male 16 19.2500 2.48998 .62249 17.9232 20.5768 10.00 20.00
Female 32 19.2813 1.46429 .25885 18.7533 19.8092 13.00 20.00
Total 48 19.2708 1.84206 .26588 18.7360 19.8057 10.00 20.00
PS male 16 17.0625 1.23659 .30915 16.4036 17.7214 15.00 19.00
female 32 16.5313 1.64580 .29094 15.9379 17.1246 13.00 20.00
Total 48 16.7083 1.52927 .22073 16.2643 17.1524 13.00 20.00
SC Male 16 13.8750 1.85742 .46435 12.8853 14.8647 11.00 18.00
Female 32 12.3750 3.28977 .58155 11.1889 13.5611 4.00 20.00
Total 48 12.8750 2.95804 .42696 12.0161 13.7339 4.00 20.00
WS Male 16 16.0625 2.74393 .68598 14.6004 17.5246 10.00 19.00
Female 32 15.8750 3.75671 .66410 14.5206 17.2294 .00 20.00
Total 48 15.9375 3.42336 .49412 14.9435 16.9315 .00 20.00
PA Male 16 19.4375 .96393 .24098 18.9239 19.9511 17.00 20.00
Female 32 18.6875 1.82169 .32203 18.0307 19.3443 14.00 20.00
Total 48 18.9375 1.61649 .23332 18.4681 19.4069 14.00 20.00
LLA Male 16 17.1375 1.17466 .29367 16.5116 17.7634 13.60 18.40
Female 32 16.5500 1.36972 .24213 16.0562 17.0438 11.60 18.80
Total 48 16.7458 1.32520 .19128 16.3610 17.1306 11.60 18.80
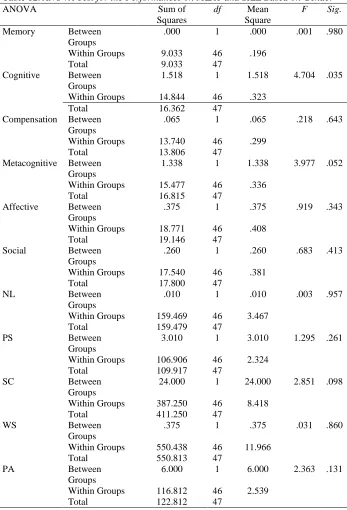
Although Table 10 revealed no significant differences between the
two genders on their total strategy use, one-way analysis of variance (see
Table 12) uncovered that there was a significant difference between the
males and females in their use of cognitive
F
(1, 46)= 4.70,
p
= .03 and
metacognitive
F
(1, 46)= 3.97,
p
= .05 LLSs use in favor of males; however,
as the
t
test showed, one-way ANOVA also confirmed that there were no
Table 12. ANOVA Test for the Performances on MLAT and SILL Based on Gender
ANOVA Sum of
Squares
df Mean
Square
F Sig.
Memory Between
Groups
.000 1 .000 .001 .980
Within Groups 9.033 46 .196
Total 9.033 47
Cognitive Between
Groups
1.518 1 1.518 4.704 .035
Within Groups 14.844 46 .323
Total 16.362 47
Compensation Between Groups
.065 1 .065 .218 .643
Within Groups 13.740 46 .299
Total 13.806 47
Metacognitive Between Groups
1.338 1 1.338 3.977 .052
Within Groups 15.477 46 .336
Total 16.815 47
Affective Between
Groups
.375 1 .375 .919 .343
Within Groups 18.771 46 .408
Total 19.146 47
Social Between
Groups
.260 1 .260 .683 .413
Within Groups 17.540 46 .381
Total 17.800 47
NL Between
Groups
.010 1 .010 .003 .957
Within Groups 159.469 46 3.467
Total 159.479 47
PS Between
Groups
3.010 1 3.010 1.295 .261
Within Groups 106.906 46 2.324
Total 109.917 47
SC Between
Groups
24.000 1 24.000 2.851 .098
Within Groups 387.250 46 8.418
Total 411.250 47
WS Between
Groups
.375 1 .375 .031 .860
Within Groups 550.438 46 11.966
Total 550.813 47
PA Between
Groups
6.000 1 6.000 2.363 .131
Within Groups 116.812 46 2.539
Based on the results presented above, the research questions can be answered as follows:
1. There is a strong positive relationship between Iranian university EFL
students’ LLA and LLSs use.
2. There is no relationship between gender and Iranian university EFL
students’ LLA, but a partial relationship with their LLSs use.
5. Discussion
This study sought to unearth the relationship between LLA (based on MLAT) and LLSs use (based on SILL) among a cohort of male and female Iranian university EFL students. The researchers found a strong positive relationship between LLA and LLSs use; it was also found that the high-aptitude students used LLSs significantly more frequently than did the low-aptitude students; however, gender had no relationship with aptitude level and LLSs use, except for cognitive and metacognitive strategies that it had in favor of the males. As regards the relationship between total LLA scores and the use of categories of LLSs, LLA was found to have a significant positive relationship with all the categories of LLSs excluding memory strategies. Furthermore, total LLSs use was largely positively correlated with the performances of the students on all the components of MLAT, except on PS with which it had a small positive relationship. Regarding the relationship between the components of MLAT and LLS categories, large positive relationships existed between the use of cognitive strategies and performance on all the five components of MLAT; the same was found between compensation strategies and NL, SC, and WS components; between metacognitive strategy use and SC, WS, and PA; between affective strategy use and SC, WS, and PA components; between the use of social strategies and scores on NL, SC, WS sections, and between memory strategy use and SC. Large positive relationship was also found between WS and PA components, but a medium positive relationship was revealed between NL and WS sections; other components of MLAT had no relationship with each other. The use of memory strategies correlated with none of the other strategy types; also, the frequency of use of affective strategies was not associated with the use of social strategies; however, the frequencies of use of all the other categories of strategies were found to have large positive correlations with each other. Finally, the main factor determining the use of LLSs was found to be the students’ aptitude, not their gender.
being medium in the case of memory and affective strategies. Based on frequency of use of LLS categories among the high-aptitude students, the most frequently used strategies ranked as metacognitive, cognitive, social, and compensation with a decrease in their means of use. Finally, the high-aptitude students’ mean scores significantly surpassed the low-aptitude students’ on all the components of MLAT, except in the PS component in which, although the former outperformed the latter, their difference was not significant. Based on Ellis (2008), SC component involves using inductive language learning ability; PS part is related to phonemic coding ability; WS utilizes grammatical sensitivity; PA involves the application of rote-learning; and possibly NL again uses phonemic coding ability. In addition, the first three parts were found to be difficult even for the high-aptitude students. Furthermore, these students used metacognitive, cognitive, social, and compensation strategies more than other strategy types, meanwhile, SC component correlated with all the six categories of strategies, WS with all except memory strategies, NL with cognitive, social, and compensation strategies, PS with metacognitive and cognitive strategies, and PA part with just cognitive and affective strategies. We also found that there were two common strategies, that is, metacognitive and cognitive strategies that correlated with performance on SC, PS, WS; however, for completing WS, PA, and NL, the cognitive strategy was the only commonly used strategy.
These findings enabled us to conclude that, in improving students’ language learning, metacognitive strategies are more important than cognitive strategies which are themselves more important than social strategies, with this latter strategy type being more important than compensation strategies. To the confirmation of this conclusion, Graham (1997) defines metacognition simply as thinking about thinking and it is believed that learners who are metacognitively aware know what to do exactly when they do not know what to do; in fact, they use strategies to help them find out what they need to do. The reason why metacognitive strategies were found to be the mostly used strategies among the high-aptitude students might be that they involve various thinking and reflection processes (Anderson, 1999). Metacognitive strategies, it seems, allow students to plan, control, and evaluate their learning, so they can have the most focal role to play in this regard than strategies that merely increase input and interaction (Graham, 1997).
discovered that there is an association between the use and choice of LLSs and different variables like context, learner’s characteristics and their experiences, language proficiency, or cultural and academic backgrounds (Deneme, 2008; Fuping, 2006; Hong, 2006; Oxford, 2003). The findings have concluded that the employment of LLSs facilitates and improves language learning and assists language learners in different ways. It was also found that a direct relationship exists between proficiency and achievement (Griffiths, 2003; Ya-Ling, 2008; Yang, 2007). Supporting the findings of the present study, many research studies have explored the relationship between LLSs and learners’ proficiency in which the findings have indicated that more proficient language learners use a greater variety and often a greater number of LLSs (Anderson, 2005; Ehrman & Oxford, 1989; Green & Oxford, 1995; Griffiths, 2003; Lee, 2003; O’Malley & Chamot, 1990).
In contrast to the findings of this research, studies have shown significant gender differences between males and female language learners in which females have demonstrated the use of more and a wider range of strategies than males (Ehrman & Oxford, 1989; Green & Oxford, 1995; Lee, 2003; Zare, 2010). Contrary to the findings of the present research, Yang (1992) found that EFL learners used strategies at a medium level; however, their results are in line with our finding as far as low-aptitude students are concerned.
The present study, like its predecesors, is not without its shortcomings. The major limitation which might even underrepresent some findings might be the possible disproportionate distribution of the males and females. Another factor that might reduce the generalizability of the findings would be the small sample size, and the possible effect of cultural backgrounds which is also a thought provoking area for future replications. Finally, as SILL is a self-report tool, there may be some “regression toward mean” effect (Li, 2010) because students are not free in the options, so there may be strategies not provided in the SILL but employed by the learners. Researchers suggest that future studies consider the relationship between students’ achievement and aptitude and strategy use in a single study. Future studies can replicate this type of research in an experimental design by conducting strategy training programs and scrutinizing the effect of strategy-based instruction on language learning, aptitude, and achievement. Finally, as Skehan (2002, as cited by Erlam, 2005) states, LLA is modular in that one’s aptitude for L1 learning is different from L2 learning in perception, analysis, storage, and retrieval of information, accordingly future researchers can also compare L1 with L2 aptitude.
6. Conclusion
References
Abraham, R. G., & Vann, R. J. (1987). Strategies of two language learners: A case
study. In A.L. Wenden, A. & Rubin, J. (Eds.) Learning strategies in language
learning (pp. 85-102). Englewood Cliffs, NJ: Prentice Hall.
Allwright, D. (1990). Autonomy in language pedagogy. CRILE working paper 6.
UK: Center for Research in Education, University of Lancaster.
Anderson, N. (2005). L2 learning strategies. In E. Hinkel (Ed.), Handbook of
research in second language teaching and learning (pp. 757-771). Mahwah, NJ: Lawrence Erlbaum Associates.
Anderson, N. J. (1999). Exploring second language reading: Issues and strategies.
Boston: Heinle & Heinle.
Baker, W., & Boonkit, K. (2004). Learning strategies in reading and writing: EAP
contexts. RELC Journal, 35(3), 299-328.
Bruen, J. (2001). Strategies for success: Profiling the effective learners of German.
Foreign Language Annals, 34(3), 216-225.
Carrol, J. (1965). The prediction of success in foreign language training in R.
Glaser: Training, research, and education. New York: Wiley.
Carrol, J. B., & Sapon, S. M. (1983). Modern language aptitude test (MLAT):
Manual. New York: The Psychological Corporation Harcourt Brace Jovanovich, Inc.
Chamot, A. U. (2004). Issues in language learning strategy research and teaching.
Electronic Journal of Foreign Language Teaching, 1(1), 14-26.
Chamot, A. U. (2005). Language learning strategy instruction: Current issues and
research. Annual Review of Applied Linguistics, 25, 112-130.
Chamot, A. U., & O’Malley, J. M. (1996). Implementing the cognitive academic
language learning approach (CALLA). In R. Oxford (Ed.), Language learning
strategies around the world: Cross-cultural perspectives (pp. 167-174). Manoa: University of Hawaii Press.
Cohen, A. D., & Weaver, S. J. (1998). Strategies-based instruction for second
language learners. In W. A. Renandya & G. M. Jacobs (Eds.), Learners and
language learning (pp. 1-25). Singapore: SEAMEO Regional Language Center.
Cohen, J. W. (1988). Statistical power analysis for the behavioral sciences (2nd ed.).
Cronbach, L., & Snow, R. (1977). Aptitudes and instructional methods. New York: Wiley.
DeKeyser, R. (2003). Implicit and explicit learning. In C. Doughty & M. H. Long
(Eds.), The handbook of second language acquisition (pp. 313-348). New
York: Blackwell.
Deneme, S. (2008). Language learning strategy preferences of Turkish students. The
Journal of Language and Linguistic Studies, 4(2), 83-93.
Dörnyei, A., & Skehan, P. (2003). Individual differences in second language
learning. In C. Doughty & M. H. Long (Eds.), The handbook of second
language acquisition (pp. 589-630). New York: Blackwell.
Dörnyei, Z. (2005). The psychology of the language learner: Individual differences
in second language acquisition. Mahwah, NJ: Erlbaum.
Ehrman, M. E., & Oxford, R. L. (1989). Effects of sex differences, career choice,
and psychological type on adult language learning strategies. The Modern
Language Journal, 73, 1-3.
Ehrman, M. E., & Oxford, R. L. (1995). Cognition plus: Correlates of language
learning success. Modern Language Journal, 79 (1), 67-89.
Ellis, R. (1994). The study of second language acquisition. Oxford: Oxford
University Press.
Ellis, R. (1997). Second language acquisition. Oxford: Oxford University Press.
Ellis, R. (2008). The study of second language acquisition (2nd ed.). Oxford: Oxford
University Press.
Erlam, R. (2005). Language aptitude and its relationship to instructional
effectiveness in second language acquisition. Language Teaching Research, 9,
147-171.
Frey, T. (2014). 2020 and the future of education. Paper presented at Terraki ELT
Conference, Istanbul, Turkey.
Fuping, X. (2006). The impact of strategy training on reading comprehension.
CELEA Journal, 29(4), 36-42.
Gardner, R. C., & Lambert, W. E. (1972). Attitudes and motivation in second
language learning. Rowley, MA: Newbury House.
Graham, S. (1997). Effective language learning. Clevedon, England: Multilingual
Matters.
Green, J. M., & Oxford, R. L. (1995). A closer look at learning strategies, L2
Griffiths, C. (2003). Patterns of language learning strategy use. System, 31, 367-383. Harley, B., & Hart, D. (2000). Language aptitude and second language proficiency
in classroom learners of different starting ages. Studies in Second Language
Acquisition, 19(03), 379-400.
Hong, K. (2006). Beliefs about language learning and language learning strategy
use in an EFL: A comparison study of monolingual Korean and bilingual Korean-Chinese university students. Unpublished doctoral dissertation, University of North Texas.
Hong-Nam, K., & Leavell, A.G. (2007). Language learning strategy use of ESL
students in an intensive English learning context. System, 34, 399-415.
Khamkhien, A. (2010). Factors affecting language learning strategy reported usage
by Thai and Vietnamese EFL learners. Electronic Journal of Foreign
Language Teaching, 7(1), 66-85.
Lee, K. (2003). The relationship of school year, sex and proficiency on the use of
learning strategies in learning English. Asian EFL Journal, 5(4), 1-36.
Li, J. (2002). An empirical study on learning strategies of Chinese ESL learners.
Foreign Language Teaching, 1, 42-49.
Li, F. (2010). Relationship between EFL learners’ belief and learning strategy use
by English majors in vocational colleges. Journal of Language Teaching and
Research, 1(6), 858-866.
Lightbown, P. M., & Spada, N. (1999). How languages are learned (2nd ed.).
Oxford: Oxford University Press.
Little, D. (1991). Learner Autonomy 1: Definitions, issues, and problems. Dublin:
Authentik.
McIntyre, P. D., & Noels, K. (1996). Using social-psychological variables to predict
the use of language learning strategies. Foreign Language Annals, 29, 373-386.
Nunan, D. (1997). Does learner strategy training make a difference? Lenguas
Modernas, 24, 123-142.
O’Malley, J. M., & Chamot, A. U. (1990). Learning strategies in second language
acquisition. Cambridge: Cambridge University Press.
Oxford, R. L. (1990). Language learning strategies: What every teacher should
know. New York: Newbury House/Harper & Row.
Oxford, R. L. (2003). Language learning styles and strategies: An overview. GALA,
Oxford, R. L., & Nyikos, M. (1989). Variables affecting choice of language learning
strategies by university students. The Modern Language Journal, 73, 291-300.
Rahimi, M., Riazi, A., & Saif S. (2008). An investigation into the factors affecting
the use of language learning strategies by Persian EFL learners. CJAL, 11(2),
31-60.
Reiss, M. A. (1985). The good language learner: Another look. Canadian Modern
Language Review, 41, 511-523.
Richards, J. C., Platt, J., & Platt, H. (1992). Longman dictionary of language
teaching and applied linguistics. Essex: Longman.
Robinson, P. (2001). Individual differences, cognitive abilities, aptitude complexes
and learning conditions in second language acquisition. Second Language
Research, 17, 368-392.
Robinson, P. (2005). Aptitude and second language acquisition. Annual Review of
Applied Linguistics, 25, 46-73.
Rubin, J., & Thompson I. (1994). How to be a more successful language learner (2nd
ed.). Boston: Heinle & Heinle.
Rubin, J. (1975). What the “good language learner” can teach us. TESOL Quarterly,
9(1), 41-51.
Skehan, P. (1989). Individual differences in second language learning. Great
Britain: Chapman and Hall, Inc.
Skehan, P. (1998). A cognitive approach to language learning. Oxford: Oxford
University Press.
Snow, R. (1992). Aptitude theory: Yesterday, today, and tomorrow. Educational
Psychologist, 27, 5-32.
Stern, H. H. (1975). What can we learn from the good language learner? Canadian
Modern Language Review, 31, 304-318.
Wen, Q. F., & Johnson, R. K. (1997). L2 learner variables and English achievement:
A study of tertiary-level English majors in China. Applied Linguistics, 18,
27-48.
Wenden, A., & J. Rubin, (1987). Learner strategies in language learning.
Englewood Cliffs, NJ: Prentice Hall.
Wenden, A. L. (1998). Metacognitive knowledge and language learning. Applied
Linguistics, 19, 515-537.
Ya-Ling W. (2008). Language learning strategies used by students at different
Yang, M. N. (2007). Language learning strategies for junior college students in
Taiwan: Investigating ethnicity and proficiency. The Asian EFL Journal, 9(2),
35-57.
Yang, N. (1992). Second language learners’ beliefs about language learning and
their use of learning strategies: A study of college students of English in Taiwan. Unpublished doctoral dissertation, University of Texas, Austin, TX. Zare, P. (2010). An investigation into language learning strategy use and gender
among Iranian undergraduate language learners. World Applied Sciences
Journal, 11(10), 1238-1247.
Zare, P., & Nooreen, N. (2011). The relationship between language learning strategy use and reading comprehension achievement among Iranian undergraduate