Research Journal
Volume 10, No. 29, March 2016, pages 109–115
DOI: 10.12913/22998624/61938 Research Article
Received: 2015.12.15 Accepted: 2016.02.01 Published: 2016.03.01
THE STUDY OF CHANGES IN ARDABIL PLAIN GROUNDWATER LEVEL
USING GIS
Javad Zare Aghbolagh1, Ebrahim Fataei1,*
1 Department of Environment, Ardabil Branch, Islamic Azad University, Ardabil, Iran, e-mail: zare.javad66@
gmail.com
* Corresponding author e-mail: [email protected]
ABSTRACT
Uncontrolled exploitation of groundwater in many parts of the world has led to a sharp drop in groundwater levels. In this study, changes in Ardabil plain groundwater level were studied using geographic information system (GIS). For this purpose, the interpo-lation table method was used, the intrinsic data as table data of piezo metric wells was used. In order to implement the model, the Majol Geoestatical in geographic information system software was used. The data entered as regions into the geographic information system, and then done for the entire zoning area, due to zoning 8 models, the IDW, GPI, RBF, LPI, KO, KS, KU and EBK in geostatical extension were evaluated. The ordi-nary kriging method (KO) with the lowest RMSE, was determined as the most accurate one, and finally, as the ultimate method for zoning and map providing for the changes in groundwater levels drop of the region. The results of classification showed that the biggest drop of about 40 meters was in the areas close to the southeastern parts of the study region and in other areas, little changes were observed, this rate of the change and decline in some parts of the desert like southern regions is very tangible and specified. Keywords: Ardebil plain, groundwater, GIS, interpolated.
INTRODUCTION
The provided statistics by the world resources illustrate a dilemma in the trend of annual drop in the ground water. The deficit in volume of the global groundwater storage annually is between 700 to 800 billion cubic meters, out of which 1 % belongs to Iran [1, 10]. In some countries with dry areas in which, the underground water has been used more than the consumption amount, and with full discharging of it, they are facing severe difficulties in the supply of water at the moment [11, 13] so being aware of the status of water re-sources both in terms of quality and quantity is the most important implementation to prevent the destruction of water resources [4]. Within the re-cent years in Ardabil desert uncontrolled exploi-tation has caused a significant drop in groundwa -ter resources that land subsidence in some areas of the plain especially in southern parts is one of
its reasons [2]. Shafi’I Motlagh (1388) stated that the risk of water resources crisis, which is caused by a sharp decline in precipitation and wrong methods of irrigation and uncontrolled exploita-tion of groundwater resources draws a troubling future ahead of us. Akbari et al. (1388) conducted research to assess the groundwater levels drop of Mashhad plain, the statistics of 70 observed wells during 2 periods of 10 years (76 in 1366 and 87 in 1377) examined, and the results showed that during 20 years, the rate of 1.12 m, and it means that averagely every year 60 cm water level has been reduced.
-sions [8]. Ebrahimi et. al. (2009) by evaluating the effect of drought on wetland water surface of Chaharmahal and Bakhtiari province utilizing the GIS and remote sensing technology made this conclusion that by the means of uncontrolled ex-ploitation of groundwater and effects of drought, the Pond water surface also decreased. Albertson and Henington (1995) reviewed the analysis of groundwater resources by using GIS. Makoto et. al. (2008) conducted a research in an area of ev-ergreen forest in the central Cambodia river ba-sin, and measured groundwater level fluctuations and analyzed the movement of groundwater us-ing boundary conditions and parameters that in field operations were able to be measured. The results showed that, generally in the rainy season the height of groundwater level increases and in the dry season drops [9, 12]. In this study, decline in groundwater levels in the Ardebil plain aqui-fer using interpolation functions and zoning in the GIS was conducted, due to high population density, limited water resources in groundwater and removal of surplus capacity, increasing the acreage surface of crops, decline in groundwater levels and land subsidence.
MATERIALS AND METHODS
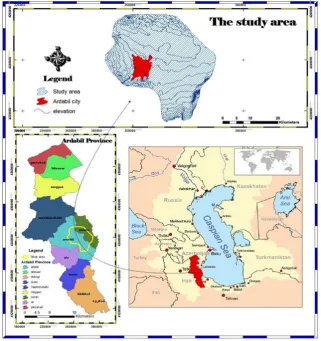
Study region: Ardabil plain in the eastern part of Azerbaijan plateau and in terms of the coun-try divisions is located in the center of Ardabil province. The total water resources of Ardabil county are around 95/285 million cubic meters embody 120 million cubic meters surface water and groundwater 95/165 million cubic meters (recoverable from wells and subterranean). The volume of mentioned groundwater in the city of Ardabil through 39 series of aqueducts (85/1 mil-lion cubic meters) and 2192 wells (3/126 milmil-lion cubic meters) utterly 15/128 million cubic meters are currently used (Ardabil Regional Water Com-pany, 1392). illustrates the Ardebil plain position in Iran and Ardebil city (Figure 1).
In order to do the following research, the sta-tistics of 56 peso metric wells within the watery years 1350 to 1393 were used. After sorting the resulted data in Microsoft Excel environment, the column chart of the studied time period was drawn. The aim of drawing the following chart was the overview of underground water varia-tion trends. Applicavaria-tion used in this research,
was ARC GIS software, version 2.10. In this study, due to providing the final map for drop in the groundwater levels, associated information to wells in the whole area was extended, that’s why the interpolation model was used to exam-ine the final map. According to this status that claims how the resulted data related to the rate of RMSE is lower, it illustrates this interpola-tion model as the efficient model for exhibiting the related information to peso metric wells in the total region. 8 models including Inverse dis-tance weighting, Global polynomial interpola-tion, Radial basis funcinterpola-tion, local polynomial in-terpolation, kriging – ordinary, kriging – simple, kriging – universal, Empirical Bayesian kriging were studied. For the implementation of model in geographic information system software, the Majol Geostatical model was used.
RESULTS AND DISCUSSION
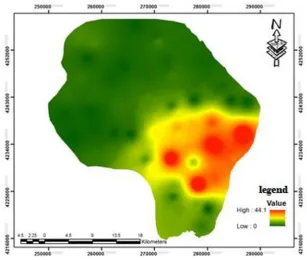
Throughout the Ardabil plain an unconfined aquifer extends across it. Because of the uneven stone floor and existence of the feeding areas of surrounding mountains, the aquifer is not homo-geneous and does not have the same situation in terms of watering. According to Figure 2, it is clear that Piraqum village near the southeastern of the area with about 40.38 meters of drop with-in the years 1961–1993 has the heighest exploi-tation and relevance to villages such as Nouran, Jabe dar lands, Aghcheh Kandy, Yajlu, Saadi Street, Niyar and Saeed Abad, in the northern half of the area with the loss of about 0 m and by the years 1961–1993 have the lowest uptake shown in Figure 2.
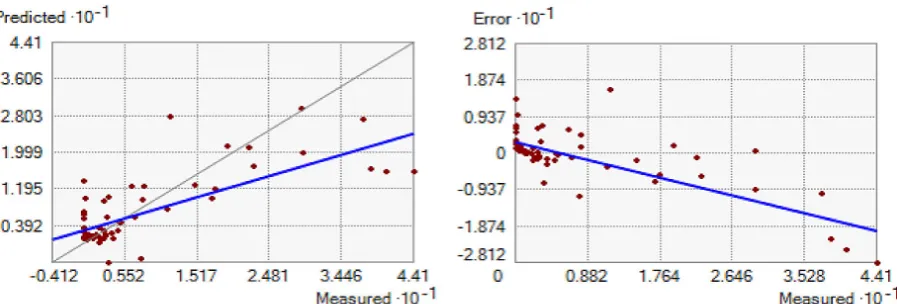
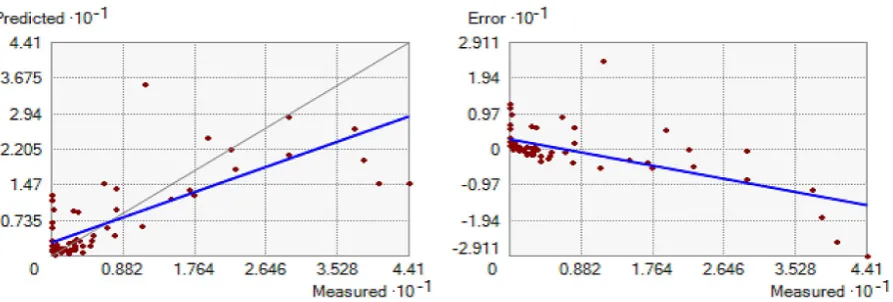
INTERPOLATION DATA
Figures 3 to 10 illustrate the relevant infor-mation to the unknown regions prediction and the related error in determination of these parts for the used 8 models.
The measurement of validation results showed that the ordinary kriging method with the lowest RMSE (Table 1) is the most accurate one, and finally was selected as the ultimate method for preparing the map changes in groundwater level decline of the region.
The zoning map of changes in groundwater level drop in the entire plain was developed us-ing ArcGIS software (Figure 11).
The zoning maps and distribution of wells show that the highest values of changes and the amount of ground water level reduction are in the southeast and in the villages (Khalil Abad, Merny, Piraqum and big Arallo).
Based on the circumstances and characteris-tics of Ardabil plain, there is a free aquifer that is extended throughout the Ardabil desert in which
Fig. 2. The changing rate of groundwater decline in the wells of Ardabil plain villages
Table 1. The RMS rate and average for each methods of interpolation RMSE Mean Method 8.185463 -0/39
Inverse distance weighting
10.36717 0/06716
Global polynomial interpolation
7.6060 -0/32
Radial basis function
7.7790 -0/6153
local polynomial interpolation
7.4861 -0/1895
Kriging – ordinary
8.5684 0/06
Kriging – simple
7.7861 -0/1895
Kriging – universal
7.6417 -0/01757
Fig. 3. The error chart and prediction for the Inverse distance weighting model
Fig. 4. The error chart and prediction for the Global polynomial interpolation model
Fig. 5. The error chart and prediction for the Radial basis function model
Fig. 10. The error chart and prediction for the empirical Bayesian kriging model Fig. 7. The error chart and prediction for the kriging – ordinary model
Fig. 8. The error chart and prediction for the kriging – simple model
Fig. 11. The changes of groundwater drop table in Ardabil plain
this aquifer has broaden in the middle of the fer-tile lands and settlement of the studied wells in the agricultural fertile regions and uncontrolled exploitation from the aquifers in the recent years have caused a sharp fall in the water of these ar-eas. Akbari et al. [1] also studied the groundwa-ter level drop in Mashhad plain, and came to this conclusion that ground water levels in the cen-tral and western parts of the aquifer was reduced to 30 meters. The focus of the harvest wells with high flow rates in the region has caused this phe -nomenon.
CONCLUSIONS
In the past, irregular and incorrect exploita-tions of groundwater caused a drop in groundwa-ter levels and in some cases, caused the ground-water aquifers to be dried in some parts of the country. Population growth, technology progress and other factors caused excessive water with-drawals for different uses such as drinking, in-dustry and agriculture in different regions. In this context, due to withdrawing too much water for agriculture is the main factor that could make a significant decrease in the level of groundwater table. In the Ardebil plain during recent years due to excessive harvest about 500 million cubic me-ters of water have declined from the reservoirs. This rate of changes and reduction in some
ar-eas of the desert, such as southern regions are very tangible and specific. This information as regions is entered into the geographic informa-tion system, and then done to all zoning areas. For zoning, 8 models including: IDW (Inverse distance weighting), GPI (global polynomial interpolation), RBF (radial basis furction), LPI (local polynomial interpolation), KO (kriging – ordinary), KS (kriging – simple), KU (kriging – universal) and EBK (empirical Bayesian krig-ing) in geostatical extension were studied and two models with the lowest RMSE were finally accepted and eventually based on the ordinary kriging model. The unknown regions for the en-tire area was zoned. The results showed that the highest drop with about 40 m was in the areas close to the southeast of the study area and in other areas, little change was observed. Accord-ingly, we can say, the density of population and much exploitation of groundwater for agricul-ture, industry and drinking water caused a sharp drop in these regions.
REFERENCES
2. Razavian M.T., Ghafori Poor A., Razavian M., Green roofs. Journal of the Preparation, 2010; 215–226. 3. Shafiee Motlagh K.H., Evaluation of a sharp drop
in the underground water in the province with spe-cial attention to the sliding clutch of plain kohki-loye and Boyer ahmad. Global Water Conference, Islamic Azad University, Behbahan, 2009, 67–81. 4. Keshavarzi H.A., Bashiri M., Ojaghlo A.,
Fac-tors affecting spatial and temporal variations in groundwater salinity and depth. Case study: Ghor-veh. First National Conference on the Challenges of Water Resources and Agriculture, Islamic Azad University, Khorasan. 2012, 195–213.
5. Albertson P.E. Hennington G.W., Groundwater analysis using a geographic information system following finit-differenced and element techniques. Engineering Geology, 42, 1995, 167–173.
6. Makoto A., Akira S., Naoki K., Tatsuhiko N., Er-iko I., Yasuhiro O., Koji T., Jumpei T., Bora T., Sopheavuth P., Sopheap L. ,Saret K., Seasonal fluc -tuation of groundwater in an evergreen forest, cen-tral Cambodia: Experiments and two-dimensional numerical analysis. Paddy and Water Environment Journal, 6(1), 2008, 37–46.
7. Ebrahimi A.A., Mohammadi F., Kaveh N., Malek-mohamadi M. 2009. Effect of drought on wetlands using RS and GIS. In: The 5th Conference on Wa-tershed Management (Natural Hazards Sustainable Management). Gorgan, Golestan, Iran.
8. Makhdoum A.F., Darvishsefat A.A., Jafarzadeh H.H., Environmental evaluation and planning by geographic information system. Tehran Univ. Press, 2002, pp. 304.
9. Walker W.R., Hrezo M.S., and Haley C.J., Man-agement of water resources for drought condition. National Water Summery. Geological Survey Wa-ter Supply, Paper No. 2375, 1991, 147–156. 10. Tremblay L., Larocque M., Anctil F., Rivard C.,
Teleconnections and interannual variability in Ca-nadian groundwater levels. Journal of Hydrology, 410, 2011, 178–188.
11. Grasby S.E., Chen Z., Hamblin A.P., Wozniac P.R.J., Sweet A. Regional characterization of the Paskapoo Bedrock Aquifer System, southern Al-berta. Can. J. Earth Sci. 45(12), 2009, 1501–1516. 12. Gurdak J.J., Hanson R.T., Green T.R., Effects of
climate variability on groundwater resources of the United States. US Geological Survey Fact Sheet 2009–3074, 4 p.
13. Rivard C., Vigneault H., Piggott A., Larocque M., Anctil F., Groundwater recharge trends in Canada. Can. J. Earth Sci. 46, 2009, 841–854.