ISSN: 2394-2231 http://www.ijctjournal.org
Page 71Effective Use of Data Mining on Biological and Clinical Data
Analysis
1Ms. Lavanya M,
2Mrs. Shoba S.A.,
*1 M.Phil Research Scholar, PG & Research Department of Computer Science & Information Technology Arcot Sri Mahalakshmi Women’s College ,Vellore , Tamil Nadu, India
*2Head of the Department, PG & Research Department of Computer Science & Information Technology Arcot Sri Mahalakshmi Women’s College, Vellore, Tamil Nadu, India
---
************************
---Abstract:
In the past, many researchers used data mining techniques in any area. A lot of amounts of data have been collected from scientific domains such as geo sciences, astronomy, meteorology, geology and biological sciences. Data mining techniques and tools used by researchers in biological and environmental problems also. In biological science data mining used in sequences alignment is based on the fact that all living organisms are related by evolution and in environmental science data mining used in predicting data such as earthquakes and landslide etc. This paper highlights on the wide survey of protein sequences, (DNA, RNA) sequences, cancer prediction, relational and semantic data mining for biomedical research area. Health care data, multiagent framework for bio data mining, predicting earthquakes, landslide and spatial data in distributed data mining alg orithms and tools. This is including in bioinformatics and environmental studies also.
Keywords—
Daa mining Process, DNA, RNA Relational Database Schema, health care monitoring---
************************
---I INTRODUCTION
Data mining an interdisciplinary subfield of computer science, is the computational route of determine outlines in great data sets involving ways at the intersection of artificial intelligence, machine studying, statistics, and database systems.
The excess of aim of the data mining development is to remove in sequence from a data set and convert it into a comprehensible construction for more use. Aside from the raw investigation step, it involves database and data management aspects, data pre-processing, copy and conjectured liberations, interestingness metrics, complexity deliberations, post-processing of discovered configurations, visualization, and online updating.
• Finding relevant information in unstructured data is a challenge. The data is unknown in terms of structure and values. The lifecycle of each part of data is in a specific domain, whereby a domain expert is available for a priori knowledge. Domain experts can creates structures by hand in the data, however this is a time-consuming job and it is done for one dataset in one domain.
• An additional challenge is connecting data from different domains.
The main problem is retrieving relevant information from multiple domain resources.gives an overview of multiple domains with cross-domain information sharing. Each domain consists of multiple manifests, where by these manifest can change from structure in time. Each domain expert tries to create a structure or pattern by hand with his/her a priori domain knowledge. However, this is done by hand. Each domain administrator does this for his domain for fulfilling the goal of retrieving rich information from manifest in a readable structure. When there is the need for collaboration in connecting and coupling two domains for creating a shared conceptualization the domain experts have to perform the job together. By communication and creating conformity, reducing the noise of interacting, and both physically and virtual different worlds are connected in creating a holistic environment.
1.2 Collaborative environment
Al the data is (geographically) spread over multiple domains. Whereby the environment consists of more than one domain and they have the intention to collaborate. Users are physically located at different places exchanging knowledge and share information by
ISSN: 2394-2231 http://www.ijctjournal.org
Page 72 interacting. Nowadays collaborative environments havethe characteristics of being a complex infrastructure, multiple organizational sub-domains, information sharing is constrained, heterogeneity, changes, volatile, and dynamic.
Fig: Collaborative environment
II. BACKGROUND
The following approach is used to address the research questions. First, state of the art literature research is performed to get an overview of learning mechanisms and agent technology in distributed systems. Experiment: Corpus creation using genetic algorithms the first experiment is using or creating an intelligent algorithm for Region of Interest (ROI) extraction. ROI's are possible parts of the solution domain (the retrievable structure/pattern, see figure 1-1). The algorithm has to have the ability to read manifests, to interpret them, and have a learning function. The result should be a structured set containing regular expressions. The structured set is called a corpus. The regular expressions represent the value data of ROI's. A ROI in a log file can be a sentence, verb, IP address, date or a combination (see figure 1-3). The algorithm uses a log file and domain knowledge as input. Domain knowledge contains descriptive attributes e.g. {; ,Time = . * date= }. A descriptive attribute is a data pattern that the agent will search for in the log file. A descriptive attribute is a regular expression. With the manifest and the domain knowledge the algorithm will return a corpus. The corpus represents an information pattern in the log file. Information retrieval is achieved by querying the corpus. These queries return the values of the ROI
Fig: Text mining executed by Multi-agents
Information extraction (IE) in computing science means obtaining structured data from an unstructured format. Often the format of structured data is stored in a dictionary or an ontology that defines the terms in a specific domain with their relation to other terms. IE processes each document to extract (find) possible meaningful entities and relationships, to create a corpus. The corpus is a structured format to obtain structured data.
Well-known information-retrieval systems are search engines on the web. For instance, Google tries to find a set of available documents on the web, using a search phrase. It tries to find matches for the search phrase or parts of it. The pre-processing work for the search engines is the information extraction process. quickly accessed when users are firing search phrases.
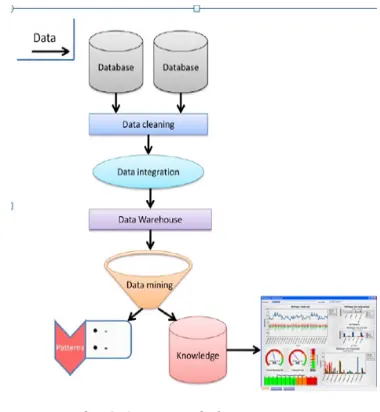
Fig. 2.1 Data mining process
Data mining consists of an iterative sequence of the following steps
1) Data cleaning (to remove noise and inconsistent data)
2) Data integration (where multiple data sources may be combined)
3) Data selection (where data relevant to the analysis task are retrieved from the database) 4) Data mining (an essential process where
ISSN: 2394-2231 http://www.ijctjournal.org
Page 73 5) Pattern evaluation (to identify the trulyinteresting patterns representing knowledge based on some interestingness measures) Properties of environment
• Accessible vs. inaccessible
• Deterministic vs. non-deterministic • Episodic vs. non-episodic
• Static vs. dynamic
•
Discrete vs. continuousDisease Management Programs are beginning to encompass providers across the healthcare continuum, including home health care. The premise behind disease management is that coordinated, evidence-based interventions can be applied to the care of patients with specific high-cost, high-volume chronic conditions, resulting in improved clinical outcomes and lower overall costs. The paper presents an approach to designing a platform to enhance effectiveness and efficiency of health monitoring using DM for early detection of any worsening in a patient’s condition.( Kavitha K, Sarojamma R M) DM based on the CART method. The work also gives a description of constructing a decision tree for diabetes diagnostics and shows how to use it as a basis for generating knowledge base rule. Clinical trials involving local patients are still running and will require longer experimentation
.
Data mining technology has been considered as useful means for identifying patterns and trends of large volume of data. To extract the unknown pattern from the large set of data for business as well as real time application. .The clustering algorithms namely centroid based K-Means and representative object based FCM (Fuzzy C-Means) These algorithm performance is evaluated on the basis of the efficiency of clustering output. Both the algorithms are analyzed. FCM produces close results to K-Means clustering but it still requires more computation time than K-Means clustering
.(
SoumiGhosh, Sanjay Kumar Dubey)III. PREVIOUS IMPLEMENTATIONS
PRE-PROCESSING IN INFORMATION RETRIEVAL
The main terminologies used in steganography systems are: the cover file, secret message, stego file, embedding algorithm and extraction algorithm. The cover file is defined as the original file such as image, video, audio, text, or some other digital media used to embedding the secret message. The secret message is defined as the message you want to embed inside the cover file, it is called payload. Stego file is defined as the file after embedding the secret message in the cover file; it should have similar properties to that of the cover. The
embedding algorithm is the method that used to embed the secret message in the cover image. The extraction algorithm is the method that retrieves the secret message from the stego image In the Steganography system, before the hiding process, the sender must select the carrier (i.e. image, video, audio or text) then select the secret message. The effective and appropriate Steganography algorithm must be selected that able to encode the message in more secure technique. Then the sender may send the Stego file by email or chatting, or by other techniques. After receiving the message by the receiver, the message can be decoded by using the extracting algorithm
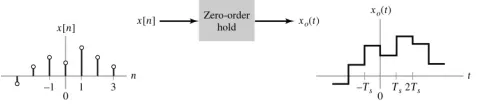
3.1 Zero Order Hold Method
There are many methods for zooming image, Zero order hold is one of this. In zero order hold method, two adjacent elements are picked from the rows respectively and then the average value between two pixel (add them and divide the result by two then take the integer value) is calculated, and their result is placed in between those two elements. First, this row is done wisely and then the result is taken and do this column is don wisely as the same way. This is one of the simplest and easiest methods of hiding the data in images. In this method, the binary data form is hidden into the LSBs of the carrier bytes or in pixels of image. The overall change to the image is so small that human eye would not be able to discover. In 24-bit images each 8-bit value refers to the red, green and blue color. But in 8–bit images each pixel is of 8-bits, so each pixel stores maximum 256 colors.
Fig .3.1 Zero order Embedding
ZOH Embedding Algorithm
Input: Cover Image C; Secret Message M.
Output: StegoImage S.
Steps:
1) Split C into 3 channels Red (R), Green (G), and Blue (B).
2) Convert image (B) to one column x.
3) Split M into characters.
4) Take m from M.
ISSN: 2394-2231 http://www.ijctjournal.org
Page 74 6) Take pixel 1 from bin.7) Calculate average of x (count) and x (count+1).
If end (average)! =end (bin) then x (count+1) = x (count+1) +2
8) Add 1 to count.
9) Repeat steps from 4 to 8 until the whole M has been embedded in C.
10) Merge the 3 channels R, G, y again to construct the StegoImage S.
Properties of z transformation
Linearity Let us consider summation of two discrete functions f (k) and g (k) such that
P x f ( k ) + qg ( k)
such that p and q are constants, now on taking the Laplace transform we have by property of linearity:
Z [ p x f ( k ) + q x g ( K ) =p x Z[f (k ) ] +q x Z [g ( k ) ]
Change of Scale: let us consider a function f(k), on taking the z transform here have
Z [ f (k ) ] = f ( z )
The Zero-Order Hold block samples and holds its input for the specified sample period. The block accepts one input and generates one output, both of which can be scalar or vector. If the input is a vector, all elements of the vector are held for the same sample period. You specify the time between samples with the Sample time parameter. A setting of -1 means the Sample times inherited. A causal continuous-time signal x (t) under consideration is defined as
X (t ) =
≥ 0 | 0
< 0
This block provides a mechanism for discrediting one or more signals in time, or resembling the signal at a different rate. If your model contains MultiMate transitions, you must add Zero-Order Hold blocks between the fast-to-slow transitions. The sample rate of the Zero-Order Hold must be set to that of the slower block. For slow-to-fast transitions, use the unit delay block. For more information about multi rate transitions, refer to the Simulink or the Real-Time Workshop documentation.
Message embedding Procedure
S(i,j) = C(i,j) - 1, if LSB(C(i,j)) = 1 and SM = 0
S(i,j) = C(i,j) + 1, if LSB(C(i,j)) = 0 and SM = 1
S(I,j) = C(i,j), if LSB(C(i,j)) = SM
Where LSB(C(i, j)) stands for the LSB of cover image C(i,j) and “SM” is the next message bit to be embedded. S(i,j) is the stego image.Here can use images to hide things if we replace the last bit of every color’s byte with a bit from the message.
Message A-01000001
Image with 3 pixels
Pixel 1: 11111000 11001001 00000011
Pixel 2: 11111000 11001001 00000011
Pixel 3: 11111000 11001001 00000011
Algorithm Embedding Implementation
Begin
Input: Cover_Image, Secret_Message, Secret_Key;
Transfer Secret_Message into Text_File;
Zip Text_File;
Convert Zip_Text_File to Binary_Codes;
Convert Secret_Key into Binary_Codes;
Set BitsPerUnit to Zero;
Encode Message to Binary_Codes;
Add by 2 unit for bitsPerUnit;
Output: Stego_Image;
End
Algorithm for extracting Implementation
Begin
Input: Stego_Image, Secret_Key; Compare Secret_Key;
Calculate BitsPerUnit; Decode All_Binary_Codes; Shift by 2 unit for bitsPerUnit; Convert Binary_Codes to Text_File;
Unzip Text_File; Output Secret_Message; End
3.2 Performance Measurements
ISSN: 2394-2231 http://www.ijctjournal.org
Page 75 between the cover image and the stego image. MeanSquare Error (MSE): It is the measure used to quantify the difference between the initial and the distorted or noisy image.
Where X and Y are the image coordinates, M and N are the dimensions of the image, Sxy is the generated stego-image and Cxy is the cover image. From (MSE) we can find Peak Signal to Noise Ratio (PSNR) which measures the quality of the image by comparing the original image with the stego-image. (PSNR) is used to evaluate the quality of the stego-image after embedding the secret message in the cover. It is computed using the following formula:
= 10
Where, C max holds the maximum value in the image that is 255. Finally, other associated measures are the Steganographic capacity, which is the maximum information that can safely embedded in a work without having statistically detectable objects. An important note is that, for all the cover images, PSNR are more than 37 dB, this means that the proposed Steganography algorithm provides very good imperceptibility performance and the stego images can't be detected.
IV. PROPOSED ANALYSIS
ROUGH SETS IN BIOINFORMATICS
Since biological data is today usually very large and multi-parameter, and since we wanted to provide legible and easily interpretable models for such data, we had to turn to appropriate machine learning techniques such as rough sets. Rough set is a well The theory is based on logics and Boolean reasoning and in particular on the upper and lower approximations of a set, the approximation space, and the modeling of sets. The theory provides tools for solving classifica¬tion challenges. The tools produce models the quality of which is comparable with other widely used methods. The added value, which makes rough sets a preferred tool for classification problems, is the structure of the classification model, that is minimal subsets of attributes sufficient for classification and their combinations. In certain cases we would also like an ordering of the attributes.
Rough sets can be applied to incomplete, inconsistent and noisy data. Rough sets models consist of sets of minimal rules, which can be easily interpreted by the user.
Following the tutorial by rough sets usually operate on decision systems. A decision system is a table where each row represents an object and each column represents an attribute (also known as a feature) and the last attribute is
called the decision attribute. Formally, we have a pair A = (U, A U {d}); d$A, where U is the universe of objects, A is a set of attributes called conditions and d is the decision attribute (also known as the classification outcome). Both U and A are non-empty and finite. Each object from U has a value (can be a missing value) for each attribute from A and for the decision attribute d.
V a : U -+ Va (1)
where: Va - a set of possible values for attribute a, i.e. the value set of a. and
d : U - Vd (2)
where: Vd - a set of possible values for decision attribute d i.e. the value set of d.
Tokenization is done based on the set of training vectors which are initially provided into the algorithm to train the system. The training documents are of different knowledge domain, are used to create vectors. The created vector helps algorithm to process the input documents. The tokenization on documents is performed with respect to the vectors, use of vectors in pre tokenization helps to make whole tokenization process more precise and successful. The effect on tokenization of vectors is shown in results section also, where the no of token generated & time consumed for the process significantly differ
.
Input : (Di)
Output : (Tokens)
Begin
Step1: Collect Input documents (Di) where i=1, 2, 3....n; Step2: For each input Di; Extract Word
(EWi) = Di;
// apply extract word process for all documents i=1, 2, 3...n in and extract words//
Step 3: For each EWi; Stop Word
(SWi) =EWi;
// apply Stop word elimination process to remove all stop words like is, am, to, as, etc.//
Stemming (Si) = SWi;
// It create stems of each word, like “use” is the stem of user, using, usage etc. //
Step 4: For each Si; Freq_Count (WCi)= Si;
// for the total no. of occurrences of each Stem Si. // Return (Si);
ISSN: 2394-2231 http://www.ijctjournal.org
Page 76 Example Phase 1:Table: Documents to the tokenization process
Phase 2:
In this phase, all the words are extracted from these four documents as shown below:
Name: doc1
[Military, is, a, good, option, for, a, career, builder, for, youngsters, Military, is, not, covering, only, defense, it, also, includes, IT, sector, and, its, various, forms, are, Army,, Navy,, and, Air, force., It, satisfies, the, sacrifice, need, of, youth, for, their, country.]
Name: doc2
[Cricket, is, the, most, popular, game, in, India., In, crocket, a, player, uses, a, bat, to, hit, the, ball, and, scoring, runs., It, is, played, between, two, teams;, the, team, scoring, maximum, runs, will, win, the, game.]
Name: doc3
[Science, is, the, essentiality, of, education,, what, we, are, watching, with, our, eyes, happening, non-happening, all, include, science., Various, scientists, working, on, different, topics, help, us, to, understand, the, science, in, our, lives., Science, is, continuous, evolutionary, study,, each, day, something, new, is, determined.]
Name: doc4
[Engineering, makes, the, development, of, any, country,, engineers, are, manufacturing, beneficial, things, day, by, day,, as, the, professional, engineers, of, software, develops, programs, which, reduces, man, work,, civil, engineers, gives, their, knowledge, to, construction, to, form, buildings,, hospitals, etc., Everything, can, be, controlled, by, computer, systems, nowadays.]
Phase 3 and Phase 4:
After extracting all the words, next phases is to remove all stop words and stemming, as shown below:
Name: doc1
[militari, good, option, for, career, builder, for, youngster, militari, not, cover, onli, defens, it, also, includ, it, sector, it, variou, form, ar,armi, navi, air, forc, it, satisfi, sacrific, need, youth, for, their, country]
Name: doc2
[Cricket, most, popular, game, in, India, in, crocket, player, us, bat, to, hit, ball, score, run, it, plai, between, two, team, team, score, maximum, run, win, game
]
Fig.4.1 Document Tokenization Graph
Fig.4.2 Overall-Time Graph
The Tokenization with Pre-processing leads to effective and efficient approach of processing, as shown in results strategy with pre-processing process 100 input documents and generate 200 distinct and accurate tokens in 156 (ms), while processing same set of documents
in another strategy takes 289 (ms) and generates more than 300 tokens
Network Algorithm
Algorithm: Generate Data Set Input: Training Data, Testing Data Output: Decision Value
Method:
ISSN: 2394-2231 http://www.ijctjournal.org
Page 77 Step 2: Classify Features (Attributes) based on classlabels
Step 3: Estimate Candidate Support Value While (instances! =null)
Do
Step 4: Support Value=Similarity between each instance in the attribute Find Total Error Value
Step 5: If any instance < 0
Estimate
Decision value = Support Value/Total Error Repeat for all points until it will empty End If
Classification Tree Algorithm
Algorithm: Generate a Classification from the training tuples of data partition D.
Input:
Data partition D, which is a set of training tuples and their associated class labels;
Attribute list, the set of can dilate attributes;
Attribute selection method, a procedure to determine the splitting criterion that “best” Partitions the data tuples into individual classes. These criterions consist of a splitting Attribute and, possibly, either a split point or splitting subset.
Output: A decision tree
Method:
1. Create a node N;
2. If tuples in D are all of the same class, C then 3. Return N as a leaf node labeled with the class C 4. If attribute list is empty then
5. Return N as a leaf node label 6. d with the majority class in D
7. Apply Attribute selection method (D, attribute list) to find the “best” splitting criterion
8. Label node N with splitting criterion
9. If splitting attribute is discrete-valued and multi way splits allowed then
10. Attribute list ← attribute list − splitting attribute
11. For each outcome j of splitting criterion
12. Let Dj be the set of data tuples in D satisfying outcome j
13. If Dj is empty then
14. Attach a leaf labeled with the majority class in D to node N
15. Else attach the node returned by Generate decision tree (Dj, attribute list) to node N 16. End for
17. Return N
CONCLUSION
In thesis research since the new model is aimed to predict PASes from mRNA sequences, we only consider the up-stream elements around a candidate PAS. Therefore, there are only 84 features (instead of 168 features). To train the model, we use 312 experimentally verified true PASes and same number of false PASes that randomly selected from our prepared negative data set. The validation set comprises 767 annotated PASes and same number of false Passes also from our negative data set but different from those used as training (data source (2)). This time, we achieve reasonably good results. Sensitivity and specificity for 10-fold cross-validation on training data are 79.5% and 81.8%, respectively. Validation result is 79.0% sensitivity at 83.6% specificity. Besides, we observe that the top ranked features are different from those listed in Table 7.7 (detailed features not shown).
Since every 3 nucleotides code for an amino acid when DNA sequences translate to mRNA sequences, it is legitimate to investigate if an alternative approach that generating features based on amino acids can produce more effective PASesprediction for mRNA sequence data. In fact, this idea is also encouraged by the good results we achieved in the TIS prediction described in the previous section..
In the new feature space, we conduct feature selection and train SVM on 312 true PASes and same number of false PASes. The 10-fold cross-validation results on training data are 81.7% sensitivity with 94.1% specificity. When apply the trained model to our validation set containing 767 true PASes and 767 false PASes, we achieve 94.4% sensitivity with 92.0% specificity (correlation coefficient is as high as 0.865). Figure 7.7 is the ROC curve of this validation. In this experiment, there are only 13 selected features and UP-T-Number is the best feature. This indicates that the up-stream sequence of PAS in mRNA sequence may also contain T-rich segments. However, when we apply this model built for mRNA sequences using amino acid patterns to predict PASes in DNA sequences, we cannot get as good results as that achieved in the previous experiment. This indicates that the down-stream elements are indeed important for PAS prediction in DNA sequences
FUTURE WORK
ISSN: 2394-2231 http://www.ijctjournal.org
Page 78 data. Now days can see that data mining use in any area. Itpresents survey on the data mining for biological and environment problem. So here observe that much kind of concepts and technique used in these problems and tries the removed complicated and hard type of data. Highlights on biological sequences problem such as protein and genomic sequences and other biological segments such as cancer prediction. In environment presents earth quakes, land slide, spatial data and environment al tool also discuss. Data mining algorithms, tools and concepts used in these problems Such as MATLAB, WEKA, SWIISPORT , Clustering , Bio clustering and any other thing in this survey.
REFERENCES
1. Dr. Hemalatha M. and Saranya Naga N. (2011), “A Recent Survey on Knowledge Discovery in Spatial Data Mining” IJCSI International Journal of Computer Science, 8 (3):473-479.
2. Dzeroski S. and Zenko B. (2004), “Is combining classifiers with stacking better than selecting the best one? Machine Learning”, 255–273.
3. Ester Martin, Kriegel Peter Hans, Sander Jörg (2001), “Algorithms and Applications for Spatial Data Mining Published in Geographic Data Mining and Knowledge Discovery, Research Monographs in GIS”, Taylor and Francis, 1-32.
4. Elena Makhalova, (2013), “Fuzzy C means Clustering in MATLAB”, The 7th International Days of Statistics and Economics, Prague, 19(21): 905-914.
5. Ester Martin, Kriegel Peter Hans, Sander Jörg (2001), “Algorithms and Applications for Spatial Data Mining Published in Geographic Data Mining and Knowledge Discovery, Research Monographs in GIS”, Taylor and Francis, 1-32.
6. Ghosh, Soumi and Dubey, Sanjay, Kumar (2013), “Comparative Analysis of KMeans and Fuzzy C-Means Algorithms”, (IJACSA) International Journal of Advanced Computer Science and Applications, 4(4):35-39.
7. Jain Shreya and GajbhiyeSamta (2012), “A Comparative Performance Analysis of Clustering Algorithms”, International Journal of Advanced Research in Computer Science and Software Engineering, 2(5):441-445.
8. Kalyankar A. Meghali and Prof. Alaspurkar S. J. (2013), “Data Mining Technique to Analyse the Metrological Data”, International Journal of Advanced Research in Computer Science and Software Engineering, 3(2):114-118.
9. Kavitha K. and Sarojamma R M (2012), “Monitoring of Diabetes with Data Mining via CART Method”, International Journal of Emerging Technology and Advanced Engineering, 2 (11):157-162.
10. Elena Makhalova, (2013), “Fuzzy C means Clustering in MATLAB”, The 7th International Days of Statistics and Economics, Prague, 19(21): 905-914.
11. Ester Martin, Kriegel Peter Hans, Sander Jörg (2001), “Algorithms and Applications for Spatial Data Mining Published in Geographic Data Mining and Knowledge Discovery, Research Monographs in GIS”, Taylor and Francis, 1-32.
12. Ghosh, Soumi and Dubey, Sanjay, Kumar (2013), “Comparative Analysis of KMeans and Fuzzy C-Means Algorithms”, (IJACSA) International Journal of Advanced Computer Science and Applications, 4(4):35-39.
13. Jain Shreya and GajbhiyeSamta (2012), “A Comparative Performance Analysis of Clustering Algorithms”, International Journal of Advanced Research in Computer Science and Software Engineering, 2(5):441-445.